Dynamic RSI Bollinger Bands with Waldo Cloud
TradingView Indicator Description: Dynamic RSI Bollinger Bands with Waldo Cloud
Title: Dynamic RSI Bollinger Bands with Waldo Cloud
Short Title: Dynamic RSI BB Waldo
Overview:
Introducing an experimental indicator, the Dynamic RSI Bollinger Bands with Waldo Cloud, designed for adventurous traders looking to explore new dimensions in technical analysis. This indicator overlays on your chart, providing a unique perspective by integrating the Relative Strength Index (RSI) with Bollinger Bands, creating a dynamic trading tool that adapts to market conditions through the lens of momentum and volatility.
What is it?
This innovative indicator combines the traditional Bollinger Bands with the RSI in a way that hasn't been commonly explored. Here's a breakdown:
RSI Integration: The RSI is calculated with customizable length settings, and its values are used not just for momentum analysis but as the basis for the Bollinger Bands. This means the position and width of the bands are directly influenced by the RSI, offering a visual representation of momentum within the context of price volatility.
Dynamic Bollinger Bands: Instead of using price directly, the Bollinger Bands are calculated using a scaled version of the RSI. This scaling is done to fit the RSI values into the price range, ensuring the bands are relevant to the actual price movement. The standard deviation for these bands is also scaled accordingly, providing a unique volatility measure that's momentum-driven.
Waldo Cloud: Named after a visual representation concept, the 'Waldo Cloud' refers to the colored area between the Bollinger Bands, which changes based on various conditions:
Purple when RSI is overbought.
Blue when RSI is oversold.
Green for bullish conditions, defined by the fast-moving average crossing above the slow one, RSI is bullish, and the price is above the slow MA.
Red for bearish conditions, when the fast MA crosses below the slow MA, the RSI is bearish, and the price is below the slow MA.
Gray for neutral market conditions.
Moving Averages: Two simple moving averages (Fast MA and Slow MA) are included, which can be toggled on or off, offering additional trend analysis through crossovers.
How to Use It:
Given its experimental nature, this indicator should be used with caution and in conjunction with other analysis methods:
Identifying Market Conditions: Use the color of the Waldo Cloud to gauge market sentiment. A green cloud might suggest a good time to consider long positions, while a red cloud could indicate potential shorting opportunities. Purple and blue clouds highlight extreme conditions that might precede reversals.
Volatility and Momentum: The dynamic nature of the Bollinger Bands based on RSI provides insight into how momentum is affecting price volatility. When the bands are wide, it might indicate high momentum and potential trend continuation or reversal, depending on the RSI's position relative to its overbought/oversold levels.
Trend Confirmation: The moving average crossovers can act as confirmation signals. For instance, a bullish crossover (fast MA over slow MA) within a green cloud might strengthen a buy signal, whereas a bearish crossover in a red cloud might reinforce a sell decision.
Customization: Adjust the RSI length, overbought/oversold levels, and moving average lengths to suit different trading styles or market conditions. Experiment with these settings to find what works best for your strategy.
Combining with Other Indicators: Since this is an experimental tool, it's advisable to use it alongside established indicators like traditional Bollinger Bands, MACD, or trend lines to validate signals.
Conclusion:
The Dynamic RSI Bollinger Bands with Waldo Cloud is an experimental venture into combining momentum with volatility visually and interactively. It's designed for traders who are open to exploring new methods of market analysis.
Remember, due to its experimental status, this indicator should be part of a broader trading strategy, and backtesting or paper trading is recommended before applying it in live trading scenarios. Keep an eye on how the market reacts to the signals provided by this indicator and always consider risk management practices.
Relativestrengh

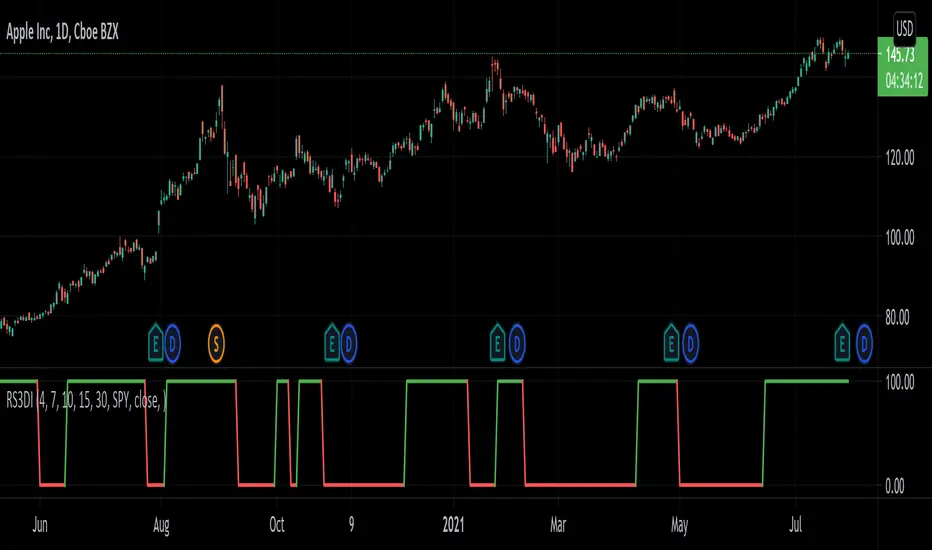
Relative Strength 3D Indicator [CC]This is a custom indicator of mine loosely based on the work by James Garofallou (Stocks and Commodities Sep 2020 pg 14) and this is meant for medium to long term trend confirmations. The idea behind this indicator is to capture 3 different dimensions of trend strength. The first dimension captures the overall strength of the underlying stock vs the market (in this case the S&P 500). The second dimension captures the overall trend strength by assigning a scoring system so when all faster moving averages are stronger than slower moving averages then it gets the max points. The final dimension is the strength of the overall strength of everything so far. Buy when the indicator line turns green and sell when it turns red.
Let me know if there are any other indicators or scripts you would like to see me publish!
Sell Gravitation IndexThe Sell Gravitation Index was created by Howard Wang and was published in Stocks & Commodities V37:02 (36-38)
This indicator is similar to the relative strength index but the big difference is that this indicator gives early buy and sell signals which I find very helpful. Buy when it rises above its signal line and sell when it falls below its signal line.
Let me know if you would like to see me publish any other scripts!
