Estimate, Earnings, Surprise EarningsThis plot helps you to show estimate earnings , reported earnings , and surprise earnings of a company inside a chart.
Estimate earnings is the projection of earnings of a company by the analysts for a given period of time.
Earnings is a company's reported profits (or sometimes a loss if going negative) in a given quarter or fiscal year.
Surprise earnings is an earning (or sometimes a loss if going negative) which is above (or even below) the estimated or reported earnings.
Estimate earning is plotted by white lines
Reported Earnings is plotted by columns, where positive number is blue and negative number is purple.
Surprise Earnings is plotted by columns, where positive number is green and negative number is red.
You surely will be able to tweak and customize all the colors above with color you find comfortable.
Since earnings are reported every quarter of the year, this plot will gives a good view when you put it inside a 3 Months timeframe.
Hope this helpful.
Ratio

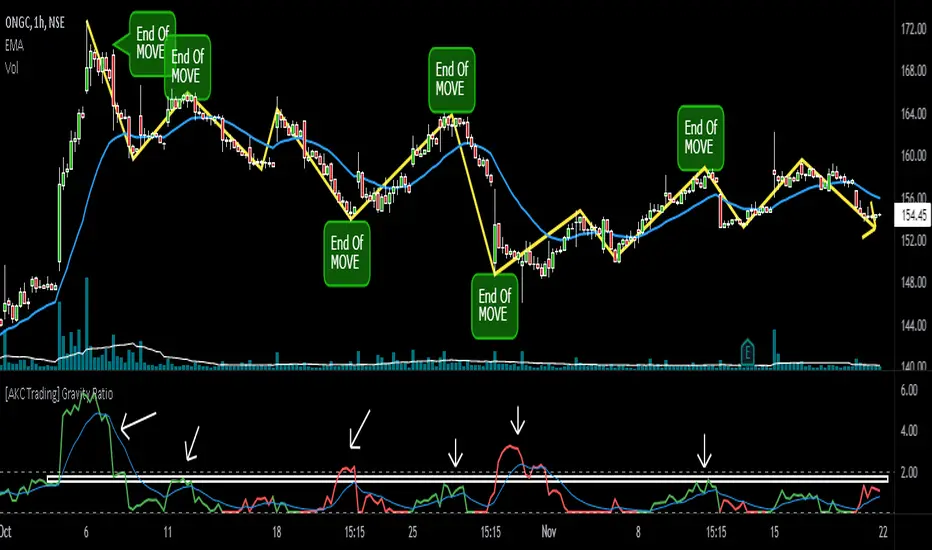
[AKC Trading] Gravity RatioGRAVITY RATIO must be used for taking PROFIT and EXIT from the trade.
1) Whenever Gravity Ratio value is near or more than 2 (general limit), it is assumed that move is extended and traders should look for booking out some or full profits (as per their initial trade plan)
2) Gravity Ratio considers length of price movement. And every stock has its own behavior, so it is advisable to look at the indicator and see on what prior values of Gravity Ratio, the move ended and use that value as zone to plan your exit.
For example, in the chart shown, instead of standard value of 2, this particular stock have seen be start exhausting around 1.5-1.8 zone. Once the Gravity Ratio reaches near to this value, a trader must used price action to trail their SL and should book (partial or full) near its pre-defined Target (Take Profit) levels.
SSR - Stablecoin Supply Ratio - Bitcoin - CryptocurrencyThe Stablecoin Supply Ratio (SSR) is the ratio between Bitcoin supply and the supply of stablecoins, denominated in BTC.
When the SSR is low, the current stablecoin supply has more "buying power" to purchase BTC. It serves as a proxy for the supply/demand mechanics between BTC and USD.

Divina - Support and ResistanceGiven the positive feedback received on the first Dynamic Support/Resistance script, I've decided to rewrite it on Pine Script v5 and publish it with open source code.
The main Divina area (box) is derived from change in price and volume, while the other support and resistance levels are based on the golden ratio (Divina proportione) or Fibonacci numbers.
The box will start to paint if the previous closed bar satisfy a condition and it will be never be repainted in the future. Anyway the box and the levels will be extended until a new signal is detected.
The Divina Support and Resistance will help you to find good price zones on wich the market might take trading decision. It is not a strategy by per se, it should be used with other good trading techniques.

PE BandPE Band is computed from the historical patterns of the Price Earnings Ratio (PE Ratio) for each individual stock. The advantage of the PE Band is its consideration for both the fundamental factor (i.e. profitability) and the historical trading pattern of a stock. But if you need to adjust to your favorite PE Band, you can still enter the PE figures in settings.
The use of PE Band is especially meaningful for listed companies, which have profitable track records. For a stock with stable earnings, its price tends to move within the PE Band. In other words, the stock price in one extreme tends move to the other extreme within the Band.

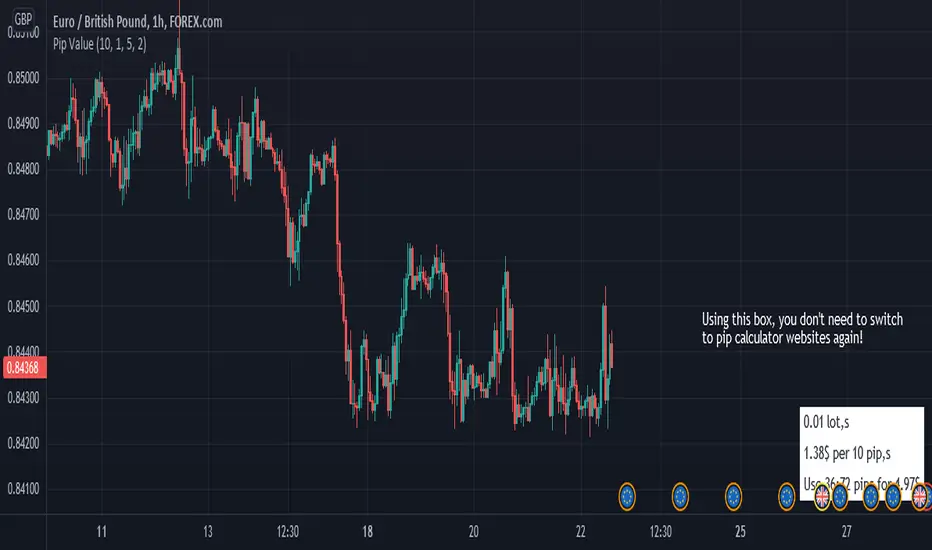
Pip ValueThis simple tool helps you manage your risk by calculating the exact price for pips.
it only works for forex pairs.
Profit Percentage TrackerThis script provides a quick and easy way to visualize profits in a chart, based on the given entry date and price.
Optionally, alerts can be sent when profits cross up the given " profit unit ".
In short:
Tracks how much profit one could take based on the input " entry date " and the input " entry price "
These inputs are interactive (www.tradingview.com)
Displays the result in a label on top of the last candle
(Optional) Sends alerts based on the given " profit unit ", that is: if ' 0.5 ' is given, then an alert is triggered every time the profit is raised by that number
(Be careful with low values, as TradingView could stop an alert if it triggers too much.)
For alerts to be displayed, a " script alert " must be created right after the script was added to the chart:
- www.tradingview.com
(Choose ' Profits ' as condition and ' Any alert() function call ')
Good to know: if you check " Notify on app ", alerts can be delivered directly to your phone:
i.imgur.com
Prerequirements :
The chart's timezone has to be set to " Exchange " (this is required in order to support the alert's logic):
- kodify.net

Relative Strength ComparisonThis script plots the ratio between a ticker and the selected index. Currently, I have US equities indexes listed + BTC. It's a great way to check for relative strength, determine if absolute highs relative to the ratio are being made, etc.
Additionally, optional comparison of the RSI is included. I was just testing something out but figured I'd leave in here because why not. If you use this, enable the 1.0 line.
Script is a bit slow, will try to optimize eventually.

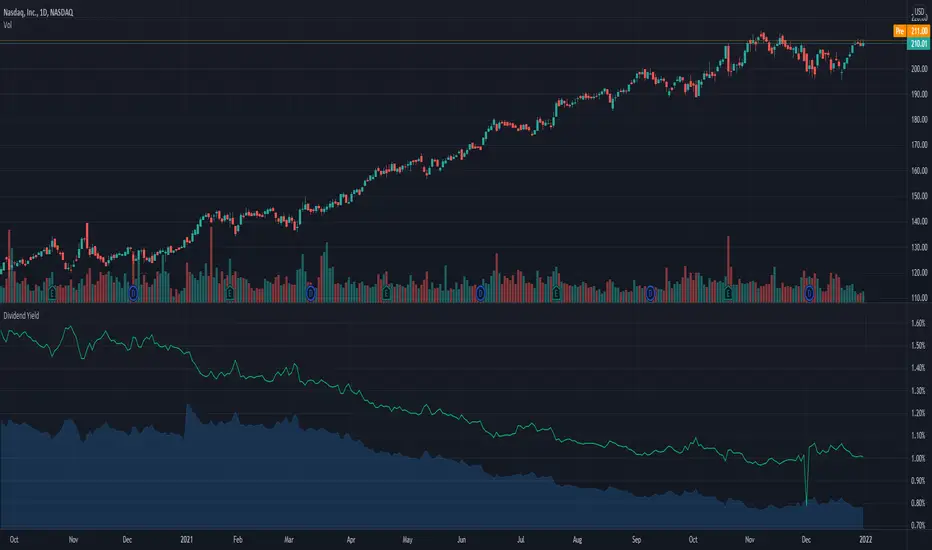
Dividend Yield & Dividend Growth Rate (Most Accurate)In this indicator it shows the dividend yield in green line and dividend growth rate in blue area.
Currently our dividend yield calculation is the most accurate in TradingView.
Dividend growth rate is the annualized percentage growth rate experienced by dividends of a given stock over 5 years period of time.
Many established companies have sought to regularly increase dividends paid to investors.
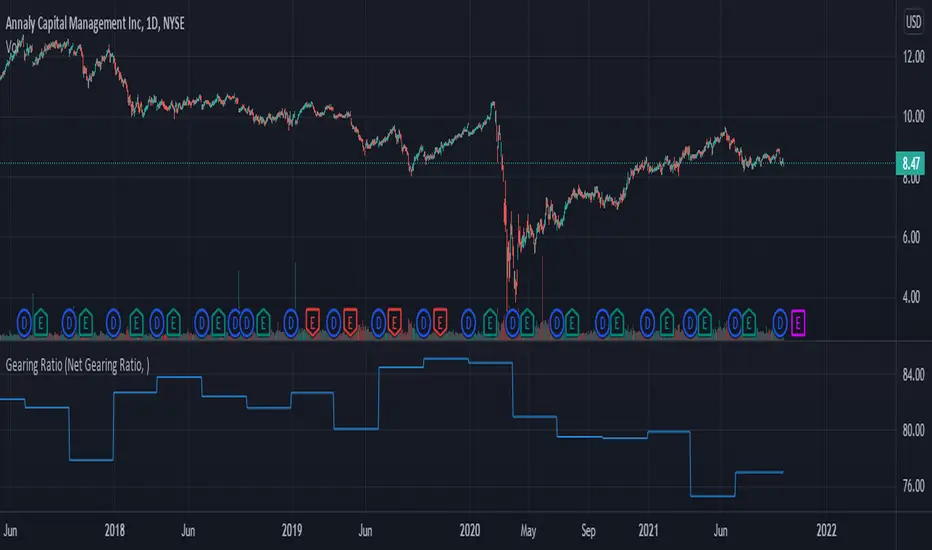
Gearing RatioEach company uses a different method to calculate their gearing ratio in financial quarterly report or annual report.
The best way to compare each other is to use the same calculation.
In this version we have 2 calculation method, you change this from the setting.
1. Net gearing ratio (default setting)
2. Gearing ratio
Silen's Financials P/E & P/S[x10] RatesThis script aims to give a better visualization of P/E and P/S rates compared to the build-in "Price to earnings ratio" and "Price to sales ratio" in the "Financials" Section of Tradingview. For those of you don't know, those rates compare earnings and sales with your share price in regard to market cap and outstanding shares.
The scripts differs to the build-in versions in the following points:
- P/E & P/S rates are combined in one indicator
- Negative P/E rates are displayed better: Positive P/E rates are green, Negative P/E rates are red
- For visualization reasons, the indicator will cap positive and negative P/E rates at 100. (P/E rates above those levels are not siginificant either way)
- P/E & P/S rate are directly displayed on the graph
- Both P/E and P/S rates are combined on one left scale
- For visualization reasons, P/S rate is showing 10x the actual P/S rate. Using the standard P/S rate would result in hard-to-recognize changes of the P/S line.
To sum up:
- Positive P/E rates are green
- Negative P/E rate are red
- P/S rates are multiplied by 1 0
- P/S rates are yellow
How to use P/E and P/S rates:
The US market average for P/E rates is roughly ~18 in the US right now (10/2022) while the market average for P/S rates is roughly ~3 in the US. Note that average P/E and P/S can change when the market situation changes.
P/E and P/S rates help you value your stock better and help you decide whether your stock is undervalued or overvalued compared to the market or the industry when it comes to earnings and sales. If you compare to Market averages, a positive P/E of less than 18 means that your stock is likely unvervalued. A P/S rate below 3 (30 in the chart!) means that your stock is likely undervalued as well. If your stock shows rates above those, it is likely that it is overvalued compared to market averages.
Please note that P/E and P/S rates are not the only factors that make up a stock valuation. Valuations are complex and subjective.
A positive P/E rate also means that your company is profitable.
A Negative P/E rate means that your company is unprofitable.
If you have any questions or feedback let me know!
Disclaimer: This script doesn't show the actual P/S rate. It shows the P/S rate multiplied by 10, due to visualization issues. Positive P/E Rates above 100 are displayed as 100. Positive P/E rates are green, Negative P/E rates are red and multiplied by -1.
Disclaimer2: @Tradingview_Team: I couldn't find the right category for this script but categories are mandatory. I assume that "Breadth Indicators" is still the closest there is. Please let me know if you want me to change the category.
Disclaimer3: For visualization, the opacity of the displayed image is 70%. The standard opacity for the P/E and P/S lines is 50% and can be changed in the indicator settings. I found this setting more useful when working together with other indicators on the same chart
Disclaimer4: Earnings Per Share, Total Revenue used are TTM. Total Shares Outstanding used are FQ.

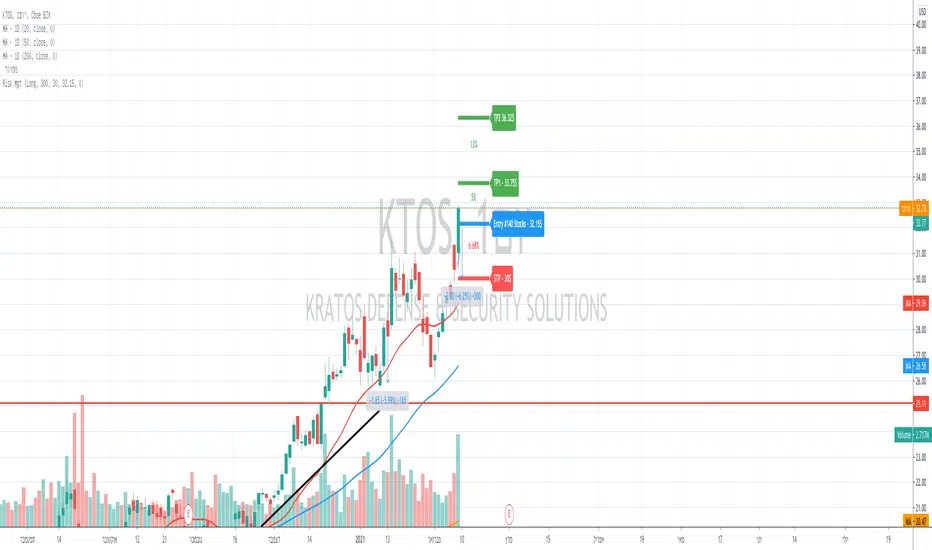
Gain/StopLoss Percentage LinesGain/StopLoss Percentage Lines is a quick way to enter your Entry Price in to a stock and track the percentage of gain or loss at the 5% and 10% markers.
Click on the gear settings icon and type in your entry price. The percentage is defaulted to 5%. You can change this to a different percentage at this screen. Note that whatever number you enter will be doubled for the upper and lower lines. For instance, if you want to set your first red line stop loss and green gain line at 2.5%, your two other upper and lower green and red lines will be at 5%.
However, this will not change the text on the tab marker.
To change the tab text, go in to the Pine Editor and change the green text that says "5% Gain" and "5% Loss" to your new percentages.

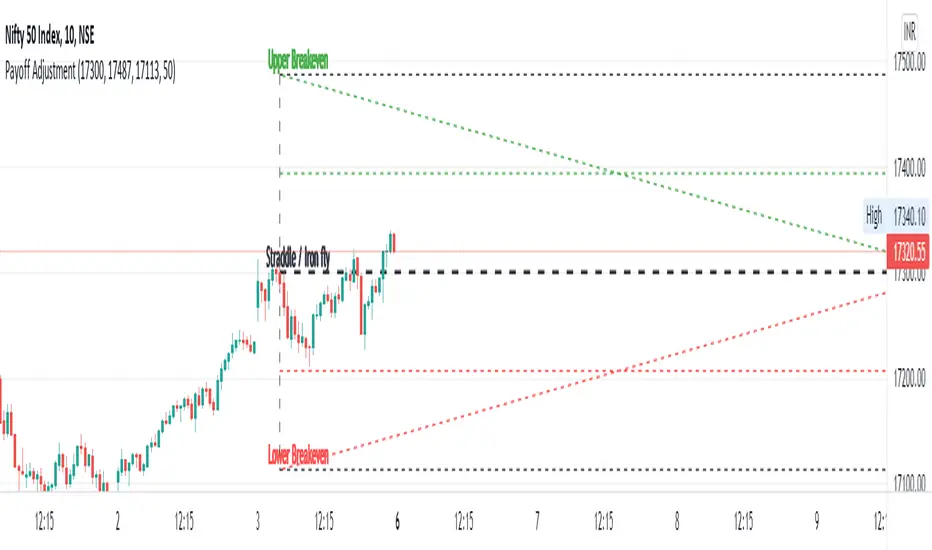
Straddle / Ironfly AdjustmentStraddle / Iron fly Adjustment is an indicator to assist (especially) Nifty / Bank Nifty Option Writers / Sellers (other instrument writers also) to draw their straddle / iron fly payoff diagram in the chart, mainly max profit and breakeven points and do adjustment based on the market movement.
Basic Idea: (My Conclusion for making this Indicator)
1) For Straddle / Iron fly writers need to adjust their position based on the market movement.
2) Here I give two adjustment ideas which one is my favorite method and another one is one of my friends is using.
a) Price Vs Time based Adjustment
I usually wait until price cross the price vs time line to do any adjustment. Generally, price vs time-based adjustment gives you more point to enter any adjustment in initial day/time when you created the straddle / iron fly. But one later it will reduce the range it become narrow.
b) Percentage based Adjustment
This method using by one of my friends which is based percentage between straddle / iron fly line and upper / lower breakeven points. Generally, he using 50 percentage. In this indicator we do have option to change the percentage between 25 to 100.
User must give inputs to see the straddle / iron fly diagram (Max Profit, Breakeven points, Adjustment, Percentage based adjust line and so)
This is not an intraday indicator and also its not suggesting you to take any buy/sell or straddle/iron fly positions. Its just giving an opportunity to draw a payoff diagram of for max profit and breakeven zone. And also helps to identify the adjustment based given scenario.
Happy Trading 😊
Saravanan Ragavan
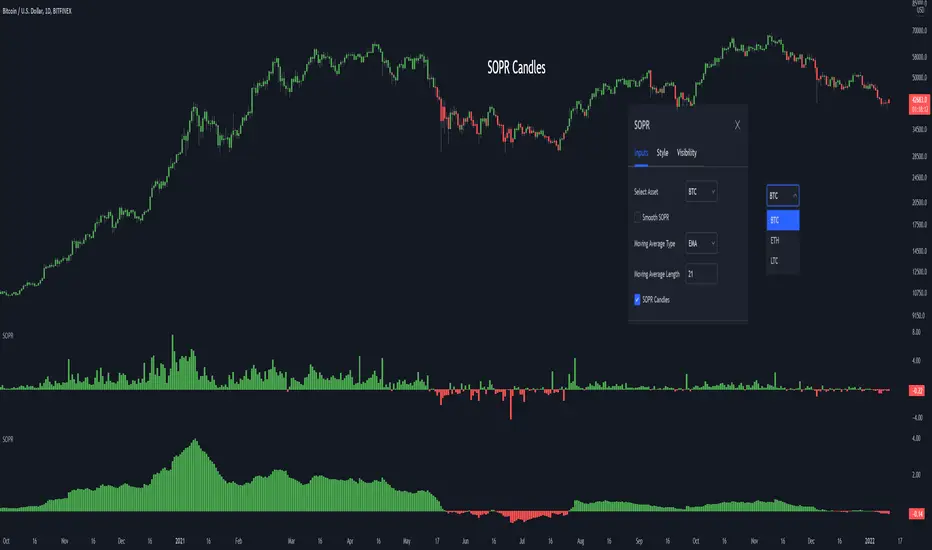
SOPR - Spent Output Profit RatioThe SOPR (Spent Output Profit Ratio) indicator provides insight into macro market sentiment, profitability and losses taken over a particular time-frame. It reflects the degree of realised profit for all coins moved on-chain.
SOPR is measured by considering only coins moved the timescale considered (daily, hourly etc), and taking the ratio between the fiat value at the time of UTXO creation, and the fiat value when the UTXO is spent.
SOPR values greater than 1 implies that the coins moved that day are, on average, selling at a profit (price sold is greater than the price paid).
SOPR value less than 1 implies that the coins moved that day are, on average, selling at a loss (price sold is less than the price paid).
You have the ability to see the SOPR of BTC, ETH and LTC. You can also smooth the SOPR using an EMA or SMA of your choice.
Thank you to both TradingView and Glassnode for adding all the on-chain data
Harmonic Trading Ratios Educational (Source Code)This table indicator was intended as educational purpose only for Harmonic Trading Ratios.
The ratios are used for Harmonic AB=CD and XAB=CD.
Ratio calculation are shown for Retracement and Projection based Primary, Primary Derived, Secondary Derived and Secondary Derived Extreme.
Primary Retracement : 0.618
Primary Projection : 1.618
Please take note that Secondary Derived Extreme is only available for Projection.
Indikator berjadual bertujuan sebagai pendidikan sahaja untuk Harmonic Trading Ratios.
Ratio digunakan untuk Harmonic AB=CD and XAB=CD.
Pengiraan ratio untuk Retracement and Projection adalah berdasarkan Primary, Primary Derived, Secondary Derived dan Secondary Derived Extreme.
Primary Retracement : 0.618
Primary Projection : 1.618
Sila ambil perhatian bahawa Secondary Derived Extreme adalah untuk Projection sahaja.
The values shown in table was based on Harmonic Trading: Volume One, Page 18 written by Scott M Carney.
Nilai yang ditunjukkan dalam jadual adalah berdasarkan buku Harmonic Trading: Volume One, Page 18 ditulis oleh Scott M Carney.
Indicator features :
1. List Harmonic Trading Ratios including calculation.
2. Show and draw individual Harmonic Trading Ratio.
3. For desktop display only, not for mobile.
Kemampuan indikator :
1. Senarai Harmonic Trading Ratios termasuk pengiraan.
2. Memapar dan melukis Harmonic Trading Ratio secara berasingan.
3. Untuk paparan desktop sahaja, bukan untuk mobile.
FAQ
1. Credits / Kredit
Scott M Carney,
Scott M Carney, Harmonic Trading: Volume One
2. Code Usage / Penggunaan Kod
Free to use for personal usage but credits are most welcomed especially for credits to Scott M Carney.
Bebas untuk kegunaan peribadi tetapi kredit adalah amat dialu-alukan terutamanya kredit kepada Scott M Carney.
Display for Bullish / Bearish Retracement
Paparan untuk Bullish / Bearish Retracement
Display for Primary Retracement and Primary Projection
Paparan untuk Primary Retracement and Primary Projection
Display for Secondary Derived Extreme Retracement and Secondary Derived Extreme Projection
Paparan untuk Secondary Derived Extreme Retracement and Secondary Derived Extreme Projection

Alt Golden Ratio by USCG_VetPine Script math based on the medium article by Philip Swift.
Idea based from Willy Woo Charts.
Disclaimer: None of this Pine Script, Title, nor Description should be used for Financial Advice. For Education Purposes Only.
Purpose: Identify a Golden Ratio Cross of the 350 Daily MA vs the 111 Daily MA with Multiplier to theorize where local valuation tops or bottoms could be approximated. NOT FINANCIAL ADVICE!
Parameters:
DMA A: short Daily Moving Average
DMA B: long Daily Moving Average
Golden Ratio: point where short Daily Moving Average crosses value assigned in parameter.
Indicators:
S2: Cross of DMA A vs DMA B in upward direction (approximate local top)
Sn: additional approximate top indicators
Sell1: first approximate local bottom
Selln: additional approximate local bottom indicators
GR: Golden-Ratio Cross of DMA A

Horizontal line for Market open price by NB(ENG)
Since meaningful movements starts based on the first bar of the market's opening time
(usually GMT + 0), this indicator is creat to be used as a tool to use it as support and resistance.
Look at the bar of just 15 minutes passed after market opened, and when the bar closed with positive candlestick then
draw horizontal line at high price, when the bar closed negative candlestick then draw horizontal line at low price.
I use diffrent colors to help visualization.
If you look these at from a distance, you can see sections that are tightly entangled and sections those are not.
This makes it possible to distinguish between strong and weak support/resistance sections.
For convenience, I put only color and transparency adjustments. No future upgrades are planned.
Thanks to ADOL_ for this great idea, and also to Bjorn Mistiaen for helping me to make the source code.
(KOR)
마켓의 오픈 시간(보통 GMT 0시)에 첫 바를 기준으로 의미 있는 움직임이 시작되기에
이를 지지와 저항으로 활용하는 도구로 쓰기 위하여 만든 지표입니다.
GMT 0시 15분 봉 마감 기준으로, 양봉이면 그 양봉의 고점을 이어 가로줄을 긋고,
음봉이면 저점을 이어 가로줄을 긋습니다. 서로 색을 달리하여 시각화를 돕습니다.
이를 멀리서 보면 촘촘히 얽힌 구간이 나오고 그렇지 않은 구간이 나옵니다.
이를 통해 지지/저항이 강한 구간과 약한 구간을 구별할 수가 있습니다.
편의를 돕기 위해 색과 투명도 조절까지만 넣어 놓았습니다.
추후 업그레이드는 예정되어 있지 않습니다.
이 대단한 아이디어를 주신 ADOL_에게 감사드리며,
소스 코드를 만들게 해주신 Bjorn Mistiaen에게도 감사를 드립니다.

SPX Excess CAPE YieldHere we are looking at the Excess CAPE yield for the SPX500 over the last 100+ years
"A higher CAPE meant a lower subsequent 10-year return, and vice versa. The R-squared was a phenomenally high 0.9 — the CAPE on its own was enough to explain 90% of stocks’ subsequent performance over a decade. The standard deviation was 1.37% — in other words, two-thirds of the time the prediction was within 1.37 percentage points of the eventual outcome: this over a quarter-century that included an equity bubble, a credit bubble, two epic bear markets, and a decade-long bull market."
assets.bwbx.io
In December of 2020 Dr. Robert Shiller the Yale Nobel Laurate suggested that an improvement on CAPE could be made by taking its inverse (the CAPE earnings yield) and subtracting the us10 year treasury yield.
"His model plainly suggests that stocks will do badly over the next 10 years, and that bonds will do even worse. This was the way Shiller put it in a research piece for Barclays Plc in October, (which can be found on SSRN Below):
In summary, investors expect a certain return in equities as compensation for investing in a riskier asset class, and as interest rates have declined, the relative expected return for equities has increased dramatically. We believe this may quantitatively help to explain investors current preference for equities over bonds, and as such the quick recoveries we are observing (with the exception of the UK), whilst still in the midst of a pandemic. In the US in particular, we are once again observing stretched valuations and high CAPE ratios compared to history."
Sources:
papers.ssrn.com
www.bloomberg.com
The standard trading view disclaimer applies to this post -- please consult your own investment advisor before making investment decisions. This post is for observation only and has no warranty etc. www.tradingview.com
Best,
JM

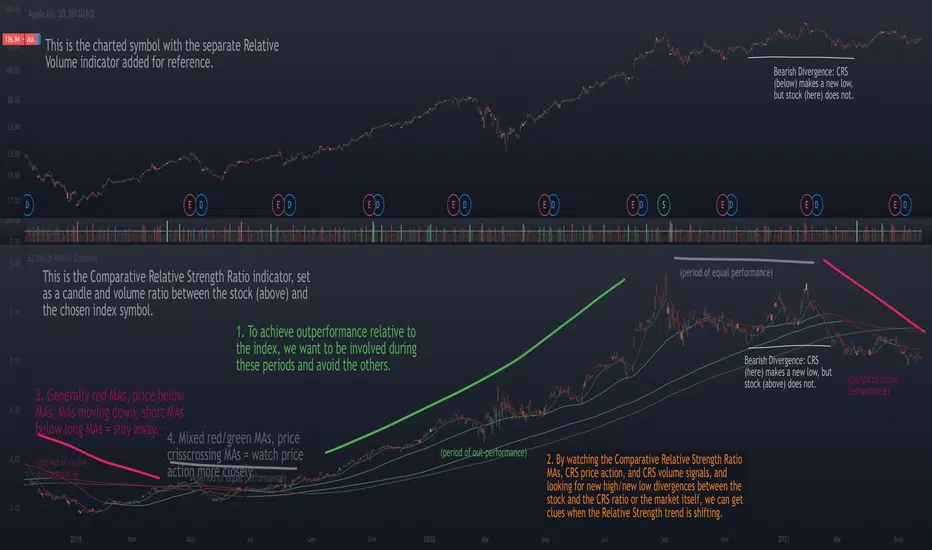
Relative Strength Ratio Chart + Relative Volume Gradient CandlesThe purpose of the Comparative Relative Strength Ratio indicator is to provide a way of looking at a relative strength ratio as a candle graph instead of only a closing price line, as well as to provide relative volume gradient coloration on the ratio-generated candles, and additionally to plot moving averages of the CRS ratio that can help display shifting trends in relative strength.
This is different from my Relative Volume Gradient Paintbars indicator, as well as my Comparison Chart with Relative Volume Gradient Paintbars indicator, in that the first looks at the charted symbol itself, the second looks at an alternate symbol, and this third indicator looks at a ratio between the charted symbol and the alternate symbol.
The idea behind this indicator is to provide additional means of evaluating relative strength, such as comparing the moving averages of the comparative relative strength ratio graph to the charted stock symbol's own MAs in order to gauge strength, comparing the price action of the ratio to that of the individual stock and its index, and comparing the volume gradient signal between the ratio, the stock, and the index.
The unique volume features allow comparing volume as a percent of the index volume, as well as stock's candle range as a percent of the range of the index. So when the volume as a percentage of the index's overall volume becomes high, this can be made to highlight the candles.
[kai]Futility RatioAn indicator that measures movement inefficiency
Inefficient movement, that is, the range market becomes a high number, the limit is reached at about 60 and a trend occurs
When the range breaks and a trend occurs, the inefficiency drops to about 40 and many trends end.
The full-scale trend goes down further and goes down to about 25, which is evaluated as an efficient movement, the limit is reached and the trend ends.
As for how to use this Inge, the direction of the trend needs to be considered in other ways.
Create a position when you reach 60
Position closed or contrarian at 40 or 25
I assume the usage
動きの非効率性を測定するインジケーターです
非効率な動きをするつまりレンジ相場は高い数字になって、60程度で限界が訪れてトレンドが発生します
レンジがブレイクしトレンドが発生すると40程度まで非効率性は下がりって多くのトレンドは終了します
本格的なトレンドはさらに下がっていって効率的な動きと評価される25程度まで下がって限界が訪れてトレンドが終了します
このインジの使い方はトレンドの方向は他の方法で考える必要がありますが
60まで上がったときにポジション作成
40又は25でポジションクローズ又は逆張り
という使い方を想定しています


Distance from the ATH priceThis indicator shows us the distance (in %) between the current price and the ATH price.
The closer the price is to the ATH the higher the percentage.
100% means we reached the ATH price.
HOW TO USE:
No special input necessary.
Markets:
It can be used to all markets.
NOTE:
Some Exchanges don't go very far back in the past and for this reason this may have impact on this Indicator.
