IMGCore - V1.0IMG Core uses five sequential stages to analyse price action and alert users to potential Trade Setups using various Price Action Concepts as detailed below:
1. Identify Higher Timeframe Market Structure and Points of Interest (HTF-POIs)
2. Calculate position size based on your risk appetite, fees and account leverage and customisable maximum trade risk
3. Alert you to risk managed trade setups at enabled HTF-POIs
4. Alert you to trade exits based on your set criteria
5. Provide Additional Alerts such as Higher Timeframe SFPs and Market Structure Breaks that act as potential early warnings that a trade setup may be forming
1. HTF POIs Available with IMG CORE:
a. HTF Market Structure Range Highs and Lows
b. HTF Order Blocks
c. HTF Breakers
d. HTF FVGs
a. Higher Timeframe Market Structure Range High and Low through Multiple Timeframe Analysis:
Market Structure can be defined using several techniques. The IMG indicators employ the Close through High/Low technique, which necessitates a candle to close through a structural level to validate a structural break and designate a new range.
Example: H12 Market Structure visualisation on a H12 Chart with annotations:
By selecting a particular Market Structure timeframe in the settings, the indicator immediately illustrates both current and historical market structures for the chosen timeframe across all subordinate timeframes, subject to the limitations of your Tradingview subscription.
Example: H12 Market Structure visualisation on a H1 Chart with annotations:
b. Higher Timeframe Order Blocks
An Order Block represents the last candle of the opposite direction preceding a Market Structure Break. For instance, a bullish Order Block is identified as the final bearish candle leading to a bullish market structure break, and vice versa for bearish Order Blocks.
Example: H12 OB visualisation on a H12 Chart with annotations:
When activated, the indicator will highlight the Higher Timeframe Order Blocks responsible for a Market Structure Break on all subordinate timeframes relative to the chosen Market Structure Timeframe.
Note: if multiple OBs exist, the indicator will display the OB closest to the new range extreme
Example: H12 OB visualisation on a H1 Chart with annotations:
c. Higher Timeframe Breakers
A Breaker Block is identified as the most recent Order Block that has been breached by price, leading to an opposite Market Structure Break. For example, a bullish Breaker Block is the last bearish Order Block that price has passed through, confirming a bullish structural break, and the inverse is true for bearish Breakers.
Example: H12 Breaker visualisation on a H12 Chart with annotations:
Once enabled, the system will display Higher Timeframe Breaker Blocks after an opposite Market Structure Break is confirmed on all subordinate timeframes.
Example: H12 Breaker visualisation on a H1 Chart with annotations:
d. Higher Timeframe Fair Value Gaps (FVGs)
A Fair Value Gap is a concept used by price action traders to identify market inefficiencies, where buying and selling are not balanced. It appears on a chart as a triple-candle pattern, with a large candle flanked by two others whose highs and lows do not overlap with the large candle, creating a gap. This gap often attracts the price towards it before the market resumes its previous direction.
Example of the indicator displaying a Higher Timeframe’s FVGs on a Lower Timeframe (LTF) chart:
-The upper chart labelled H12/H12 is the indicator displaying H12 Structure and FVGs on a H12 chart.
-The lower chart labelled H12/H1 is the indicator displaying H12 FVGs on a H1 chart
2. Risk Management and Position Sizing:
a. Automated Position Sizing:
The System will automatically calculate position size based on the account size, max leverage and risk appetite (capital risk per trade) details input in settings. Calculated trade details are included in the Tradingview Alerts as well as interactive labels on the charts.
Details include but are not limited to:
Trade Timeframe
Side: Long/Short
Type: Limit/Market
Position Size in $ and Units
Lot sizes if applicable
Trade Risk %
Take Profit Level
Entry Price
Stoploss Price
b. Maximum Trade Risk:
IMG Core has the ability to invalidate potential trade entries if it exceeds your maximum Trade Risk threshold. Trade Risk is the % price difference between entry and stoploss.
When an invalid signal is generated, the signal will not be shaded and the interactive label will display the reason for invalidation
In the example below, Max Trade Risk is set to 2% , but the trade signal had a trade risk of 5.11% , invalidating the signal with a grey triangle
3. Trade Setup Types Available with IMG CORE:
The system will alert you to potential trade setups at these HTF POIs: .
a. Higher Timeframe (HTF) Swing Failure followed by a Lower Timeframe (LTF) MSB at Range Extremes
b. Higher Timeframe (HTF) Swing Failure followed by a Higher Timeframe (HTF) MSB at enabled HTF POIs
c. Lower Timeframe (LTF) Swing Failure followed by a Lower Timeframe (LTF) MSB at enabled HTF POIs
d. Multiple LTF Entry Options once a signal is confirmed
a. HTF Swing Failure followed by a Lower Timeframe (LTF) MSB at Range Extremes
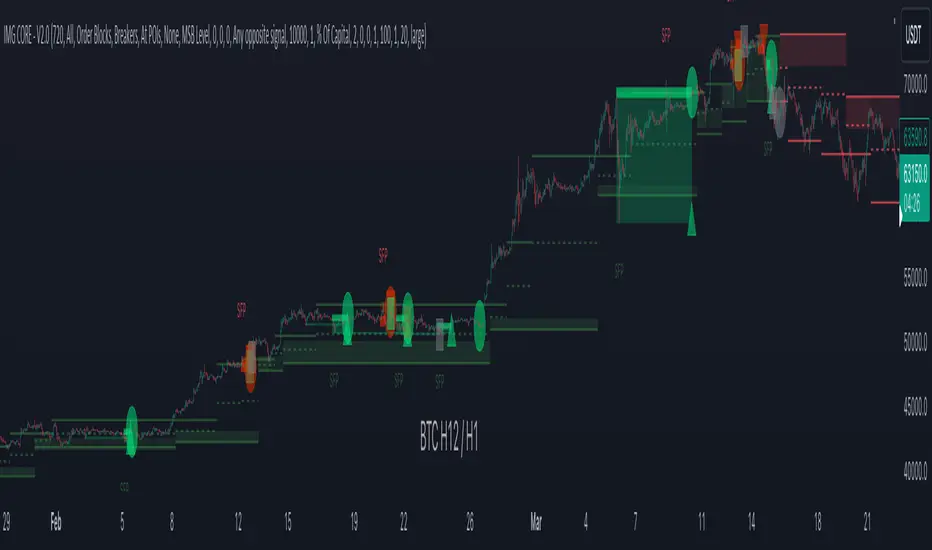
A Swing Failure Pattern (SFP) is a technical analysis concept used in trading to identify potential reversals in price trends. It occurs when the price attempts to surpass a previous high or low but fails to sustain that level, indicating a possible change in market direction. There are multiple methods to define a SFP but this indicator uses the failure to close through a Key Level. When confirmed, HTF SFPs will be displayed on-screen and an alert will fire if enabled.
Example: H12 SFPs at Range Extremes on a H1 Chart:
Alerts to Enter at Lower Timeframe MSBs
When enabled, a potential trade setup label and alert will generate when a HTF SFP is confirmed at a Range Extreme followed by a Chart Timeframe (Lower Timeframe) Market Structure Break (MSB). These signals are agnostic to current Market Structure bias and will generate at both extremes.
b. HTF Swing Failure followed by a Lower Timeframe (LTF) MSB at HTF POIs:
When enabled, a potential trade setup label and alert will generate when a HTF SFP is confirmed at an enabled Higher Timeframe POI (Order Blocks / Breakers / FVGs) followed by a Chart Timeframe (Lower Timeframe) Market Structure Break (MSB). These signals are always in line current Market Structure bias.
Example: H12 SFPs and Trade Setups at HTF POIs with Fluid Exits on a H1 Chart:
c. LTF Swing Failure followed by a LTF MSB at Range Extremes at enabled HTF POIs
The system will alert you to a lower timeframe setup if these conditions are met inside enabled HTF POIs (OBs / Breakers / FVGs):
- LTF SFP
- LTF MSB
Signals will alert you to enter a Limit Entry at the LTF MSB Level OR LTF Breaker
Example:
d. LTF Entry Options:
IMG CORE provides the following options for LTF Entries:
i. Limit Entry at Lower Timeframe MSB Levels
ii. Limit Entry at Lower Timeframe Breakers
Based on this selection, the trade setup alert will provide entry price details to set limit orders at the MSB level or LTF Breaker High.
4. Trade Exit Types Available with IMG CORE:
The system provides the following options for trade exit alerts:
i. User defined Risk to Reward (R:R)
ii. On a confirmed Opposite Signal (Fluid Exits)
Example: H12 Long Entry and Exit Signal using Fluid Exits H1 Chart:
5. IMG CORE Alerts Overview
The system provides notifications of:
1. Confirmed HTF Market Structure Breaks
2. Confirmed HTF SFPs at Range Extremes
3. Confirmed HTF SFPs at HTF POIs
4. Potential Trade Setups at Range Extremes
5. Potential Trade Setups at HTF Points of Interest (HTF-LTF and LTF-LTF)
6. Fixed R Trade Exits
7. Exit on Opposing Signals (Fluid Exits)
To enable alerts, right-click on the indicator and select “Add Alert on IMG ...”. You may customise the alert name as desired and then click 'Create' to finalise the alert setup.
General Note:
There is no system, indicator, algorithm, or strategy that can provide absolute certainty in predicting market movements. Use trading indicators as a tool to assist with trading decisions; manage your risk wisely.
Stay safe and Happy Trading!
Priceaction
IMGLite - V1.0IMG indicators use five sequential stages to analyse price and alert users to potential Trade Setups using various Price Action Concepts as detailed below:
a. Identify Higher Timeframe Market Structure and Points of Interest (HTF-POIs)
b. Calculate position size based on your risk appetite, fees and account leverage
c. Alert you to risk managed trade setups at enabled HTF-POIs
d. Alert you to trade exits based on your set criteria
e. Provide Additional Alerts such as Higher Timeframe SFPs and Market Structure Breaks that act as potential early warnings that a trade setup may be forming
a. HTF POIs Available with IMG LITE:
1. HTF Market Structure Range Highs and Lows
2. HTF Order Blocks
3. HTF Breakers
4. HTF FVGs
1. Higher Timeframe Market Structure Range High and Low through Multiple Timeframe Analysis:
Market Structure can be defined using several techniques. The IMG indicators employ the Close through High/Low technique, which necessitates a candle to close through a structural level to validate a structural break and designate a new range.
Example: H12 Market Structure visualisation on a H12 Chart with annotations:
By selecting a particular Market Structure timeframe in the settings, the indicator immediately illustrates both current and historical market structures for the chosen timeframe across all subordinate timeframes, subject to the limitations of your Tradingview subscription.
Example: H12 Market Structure visualisation on a H1 Chart with annotations:
2. Higher Timeframe Order Blocks
An Order Block represents the last candle of the opposite direction preceding a Market Structure Break. For instance, a bullish Order Block is identified as the final bearish candle leading to a bullish market structure break, and vice versa for bearish Order Blocks.
Example: H12 OB visualisation on a H12 Chart with annotations:
When activated, the indicator will highlight the Higher Timeframe Order Blocks responsible for a Market Structure Break on all subordinate timeframes relative to the chosen Market Structure Timeframe.
Note: if multiple OBs exist, the indicator will display the OB closest to the new range extreme
Example: H12 OB visualisation on a H1 Chart with annotations:
Higher Timeframe Breakers
A Breaker Block is identified as the most recent Order Block that has been breached by price, leading to an opposite Market Structure Break. For example, a bullish Breaker Block is the last bearish Order Block that price has passed through, confirming a bullish structural break, and the inverse is true for bearish Breakers.
Example: H12 Breaker visualisation on a H12 Chart with annotations:
Once enabled, the system will display Higher Timeframe Breaker Blocks after an opposite Market Structure Break is confirmed on all subordinate timeframes.
Example: H12 Breaker visualisation on a H1 Chart with annotations:
Higher Timeframe Fair Value Gaps (FVGs)
A Fair Value Gap is a concept used by price action traders to identify market inefficiencies, where buying and selling are not balanced. It appears on a chart as a triple-candle pattern, with a large candle flanked by two others whose highs and lows do not overlap with the large candle, creating a gap. This gap often attracts the price towards it before the market resumes its previous direction.
Example of the indicator displaying a Higher Timeframe’s FVGs on a Lower Timeframe (LTF) chart:
-The upper chart labelled H12/H12 is the indicator displaying H12 Structure and FVGs on a H12 chart.
-The lower chart labelled H12/H1 is the indicator displaying H12 FVGs on a H1 chart
b. Risk Management and Position Sizing:
The System will automatically calculate position size based on the account size, max leverage and risk appetite details input in settings. Calculated trade details are included in the Tradingview Alerts as well as interactive labels on the charts.
Details include but are not limited to:
Trade Timeframe
Side: Long/Short
Type: Limit/Market
Position Size in $ and Units
Lot sizes if applicable
Trade Risk %
Take Profit Level
Entry Price
Stoploss Price
c. Trade Setup Types Available with IMG LITE:
The system will alert you to potential trade setups at these HTF POIs: .
1. Higher Timeframe (HTF) Swing Failure followed by a Lower Timeframe (LTF) MSB at Range Extremes
2. Lower Timeframe (LTF) Swing Failure followed by a Lower Timeframe (LTF) MSB at enabled HTF POIs
1. HTF Swing Failure followed by a Lower Timeframe (LTF) MSB at Range Extremes
A Swing Failure Pattern (SFP) is a technical analysis concept used in trading to identify potential reversals in price trends. It occurs when the price attempts to surpass a previous high or low but fails to sustain that level, indicating a possible change in market direction. There are multiple methods to define a SFP but this indicator uses the failure to close through a Key Level. When confirmed, HTF SFPs will be displayed on-screen and an alert will fire if enabled.
Example: H12 SFPs at Range Extremes on a H1 Chart:
Alerts to Enter at Lower Timeframe MSBs
When enabled, a potential trade setup label and alert will generate when a HTF SFP is confirmed at a Range Extreme followed by a Chart Timeframe (Lower Timeframe) Market Structure Break (MSB). These signals are agnostic to current Market Structure bias and will generate at both extremes.
Signals will alert you to enter a Limit Entry at the Lower Timeframe MSB Level
2. LTF Swing Failure followed by a LTF MSB at Range Extremes at enabled HTF POIs
The system will alert you to a lower timeframe setup if these conditions are met inside enabled HTF POIs (OBs / Breakers / FVGs):
- LTF SFP
- LTF MSB
Signals will alert you to enter a Limit Entry at the Lower Timeframe MSB Level
Example:
d. Trade Exit Types Available with IMG Lite:
Exit alerts will trigger at user defined R:R
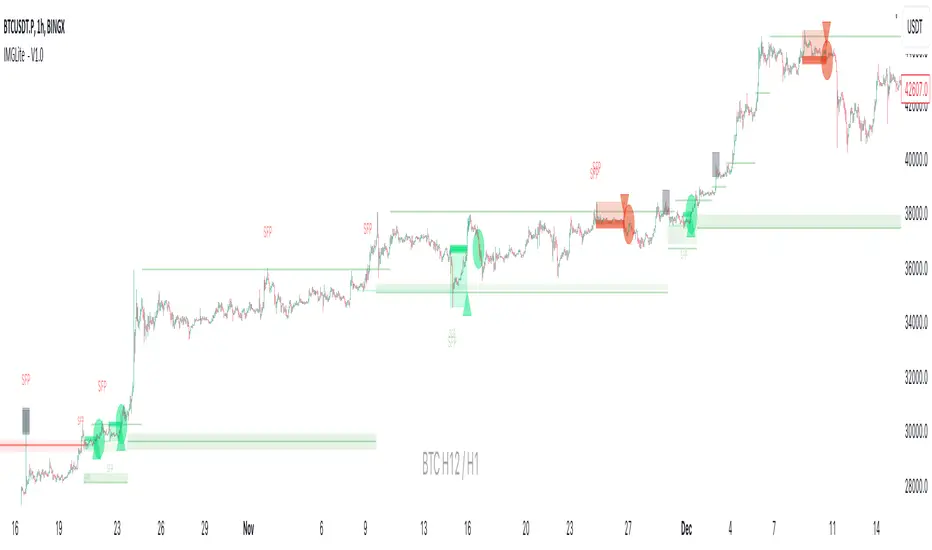
Example: H12 SFPs and Potential Trade Setups with Exits at fixed 2R on a H1 Chart:
e. IMG LITE Alerts Overview
Higher Timeframe Market Structure Breaks (HTF MSBs)
The system provides notifications of confirmed Market Structure Breaks based on the selected Higher Timeframe Market Structure Timeframe. For instance, selecting a weekly structure will trigger an alert when weekly price closes through a weekly structural level, and the same logic applies to other timeframes like D, H12, H4, H1 etc.
The system provides notifications of:
1. Confirmed HTF Market Structure Breaks
2. Confirmed HTF SFPs at Range Extremes
3. Potential Trade Setups (defined above)
4. Fixed R Trade Exits
To enable alerts, right-click on the indicator and select “Add Alert on IMG ...”. You may customise the alert name as desired and then click 'Create' to finalise the alert setup.
General Note:
There is no system, indicator, algorithm, or strategy that can provide absolute certainty in predicting market movements. Use trading indicators as a tool to assist with trading decisions; manage your risk wisely.
Stay safe and Happy Trading!
Bit Rocket Grid Bot Screener 1.0DESCRIPTION
A grid bot is an automated trading bot that is designed to execute buy and sell orders based on a pre-defined grid of prices. Grid bots operate within a specified price range, placing trades at set intervals above and below the current market price. The key idea behind a grid bot is to take advantage of price fluctuations and market volatility, not looking for trends or breakouts.
The optimal trading pair for a grid bot is one that exhibits frequent oscillations within a predictable range while demonstrating a slight upward trend. In simpler terms, it's a pair that consistently fluctuates within the same range.
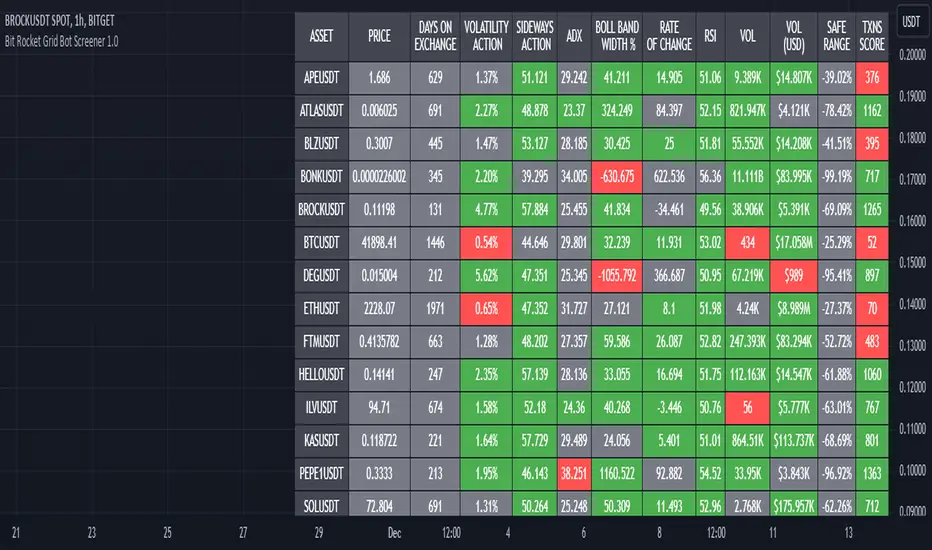
The Grid Bot Screener serves as a valuable tool for identifying the most suitable trading pairs, by showing the indicators that matter the most for sideways Grid Bot trading. Most screeners look for trends, breakouts and use indicators that are used for assisting the trader with when to buy and sell. This indicator assists in the selection of pairs that are likely to yield the best results for high volatility sideways trading.
USAGE
This screener looks at volatility, sideways action, ADX, and other indicators that are most helpful when determining the amount and potential volatility, sideways action, and transactions for up to twenty pairs at a time.
Each indicator has a threshold that the user can set themselves, this way the user is in control when comparing or hunting for the optimal pairs.
User selects up to twenty pairs, sets thresholds if different than defaults, then sets length (how far back to look). Once this is set the user can quickly look and compare the results.
KEY INDICATORS
VOLATILITY ACTION - Percentage of Price Action Volatility; Temporal Volatility Trends; Elevated price action signifies accelerated price fluctuations, disregarding directional cues.
SIDEWAYS ACTION - The higher the value, the greater the horizontal movement; a robust trend, which is not our objective, provides no directional insight.
Values exceeding 45 indicate pronounced sideways activity, while lower values approaching zero signify a vigorous trend.
These values do not assist in determining the trend direction.
Higher values imply a more sideways orientation, whereas lower values indicate a more pronounced trend.
ADX - Does not indicate trend direction; instead measures trend strength.
An indicator for price range
Lower values signal a weak trend
Higher values denote a robust trend
Strategy: Look for values of 25 or lower which indicate a ranging or neutral trend.
TXNS SCORE – Transaction Activity.
TXNS indicator represents grid performance and serves as a direct measure of trading activity. TXNS accumulates the number of buy and sell actions, reflecting the user-defined grid percentage.
Elevated transaction numbers signify increased activity, leading to enhanced bot profitability.
NOTE: For an accurate representation of the actual number of transactions, use the Bit Rocket Transactions indicator on the 30min time frame.
CONFIRMATION INDICATORS
While the key indicators are generally reliable on their own, it's also valuable to assess how well the asset is performing and its historical trajectory. The confirmation indicators provide valuable insights into an asset's performance and direction, reinforcing the assessments made through the key indicators, again these indicators on their own are not enough they must be used in conjunction with the key indicators.
VOL - Trading Activity: For assets engaged in sideways trading, sufficient volume is necessary, but it doesn't need to be as high as you might expect.
VOL(USD) - USD-Based Activity: A high USD volume signifies strong market interest.
ROC - Rate of Change Percentage: This metric calculates the percentage change in price over a specified date range. Shows trend direction using price percentage.
• Avoid extremely high or extremely low values.
o Excessively high values may indicate overbought conditions with potential for a price correction.
o Very low values could imply waning interest and diminished asset value.
o Conversely, high values might indicate asset strength, while low values could suggest that the asset has reached a bottom and is unlikely to decrease further.
BOLLINGER BAND WIDTH PERCENT - Average MACD Percentage Width, percent is used with Bollinger bands to allow for comparison with other assets.
RSI - Buying and Selling Pressure Strength: When assessing RSI, look for a balance between buying and selling pressure while still maintaining high volatility and sideways strength. Key RSI levels to consider:
• 40-60: Neutral range, indicating equilibrium and stability.
• Above 70: Approaching overbought conditions.
• Below 30: Nearing oversold conditions.
These confirmation indicators provide valuable insights into an asset's performance and direction, reinforcing the assessments made through the key indicators.
ADDITIONAL INDICATORS
DAYS ON EXCHANGE – This metric reveals how long the crypto pair has been listed on the exchange. It serves multiple purposes, such as assessing the data's historical depth and indicating whether the crypto might be relatively new. Keep in mind that while the asset could exist for a while, it might not have been available on the exchange for an extended period.
PRICE – This merely states the current price, making it suitable for those focusing on price action, it is provided for informational value only.
SAFE RANGE – This percentage indicates the price movement range from the highest to the lowest within a specified data range. Use this to determine the upper and lower levels for setting up your grid range.
PivottrendHi all!
This script is based on the concept of "higher highs and higher lows" and "lower highs and lower lows". Bullish/bearish trend changes when a previous pivot (low in bullish trend and high in bearish trend) is broken (or has equal value). Some settings are customizable by the user:
Timeframe
- You can choose what timeframe the pivots are found on
Left length
- The left length used for the pivots found
Right length
- The right length used for the pivots found
Show labels
- Choose if you want to display buy and sell labels
Show pivots
- Choose if you want to display the pivots found
Show MSS
- Choose if you want to display a line when price breaks a previous pivot
The "look and feel" is inspired by the script "SuperTrend" by KivancOzbilgic ().
Best of trading luck!

Breakout Detector (Previous MTF High Low Levels) [LuxAlgo]The Breakout Detector (Previous MTF High Low Levels) indicator highlights breakouts of previous high/low levels from a higher timeframe.
The indicator is able to: display take-profit/stop-loss levels based on a user selected Win/Loss ratio, detect false breakouts, and display a dashboard with various useful statistics.
Do note that previous high/low levels are subject to backpainting, that is they are drawn retrospectively in their corresponding location. Other elements in the script are not subject to backpainting.
🔶 USAGE
Breakouts occur when the price closes above a previous Higher Timeframe (HTF) High or below a previous HTF Low.
On the advent of a breakout, the closing price acts as an entry level at which a Take Profit (TP) and Stop Loss (SL) are placed. When a TP or SL level is reached, the SL/TP box border is highlighted.
When there is a breakout in the opposite direction of an active breakout, previous breakout levels stop being updated. Not reaching an SL/TP level will result in a partial loss/win,
which will result in the box being highlighted with a dotted border (default). This can also be set as a dashed or solid border.
Detection of False Breakouts (default on) can be helpful to avoid false positives, these can also be indicative of potential trend reversals.
This indicator contains visualization when a new HTF interval begins (thick vertical grey line) and a dashboard for reviewing the breakout results (both defaults enabled; and can be disabled).
As seen in the example above, the active, open breakout is colored green/red.
You can enable the setting ' Cancel TP/SL at the end of HTF ', which will stop updating previous TP/SL levels on the occurrence of a new HTF interval.
🔶 DETAILS
🔹 Principles
Every time a new timeframe period starts, the previous high and low are detected of the higher timeframe. On that bar only there won't be a breakout detection.
A breakout is confirmed when the close price breaks the previous HTF high/low
A breakout in the same direction as the active breakout is ignored.
A breakout in the opposite direction stops previous breakout levels from being updated.
Take Profit/Stop Loss, partially or not, will be highlighted in an easily interpretable manner.
🔹 Set Higher Timeframe
There are 2 options for choosing a higher timeframe:
• Choose a specific higher timeframe (in this example, Weekly higher TF on a 4h chart)
• Choose a multiple of the current timeframe (in this example, 75 minutes TF on a 15 min chart - 15 x 5)
Do mind, that when using this option, non-standard TFs can give less desired timeframe changes.
🔹 Setting Win/Loss Levels
The Stop Loss (SL) / Take Profit (TP) setting has 2 options:
W%:L% : A fixed percentage is chosen, for TP and SL.
W:L : In this case L (Loss-part) is set through Loss Settings , W (Win-part) is calculated by multiplying L , for example W : L = 2 : 1, W will be twice as large as the L .
🔹 Loss Settings
The last drawing at the right is still active (colored green/red)
The Loss part can be:
A multiple of the Average True Range (ATR) of the last 200 bars.
A multiple of the Range Cumulative Mean (RCM).
The Latest Swing (with Length setting)
Range Cumulative Mean is the sum of the Candle Range (high - low) divided by its bar index.
🔹 False Breakouts
A False Breakout is confirmed when the price of the bar immediately after the breakout bar returns above/below the breakout level.
🔹 Dashboard
🔶 ALERTS
This publication provides several alerts
Bullish/Bearish Breakout: A new Breakout.
Bullish/Bearish False Breakout: False Breakout detected, 1 bar after the Breakout.
Bullish/Bearish TP: When the TP/profit level has been reached.
Bullish/Bearish Fail: When the SL/stop-loss level has been reached.
Note that when a new Breakout causes the previous Breakout to stop being updated, only an alert is provided of the new Breakout.
🔶 SETTINGS
🔹 Set Higher Timeframe
Option : HTF/Mult
HTF : When HTF is chosen as Option , set the Higher Timeframe (higher than current TF)
Mult : When Mult is chosen as Option , set the multiple of current TF (for example 3, curr. TF 15min -> 45min)
🔹 Set Win/Loss Level
SL/TP : W:L or W%:L%: Set the Win/Loss Ratio (Take Profit/Stop Loss)
• W : L : Set the Ratio of Win (TP) against Loss (SL) . The L level is set at Loss Settings
• W% : L% : Set a fixed percentage of breakout price as SL/TP
🔹 Loss Settings
When W : L is chosen as SL/TP Option, this sets the Loss part (L)
Base :
• RCM : Range Cumulative Mean
• ATR : Average True Range of last 200 bars
• Last Swing : Last Swing Low when bullish breakout, last Swing High when bearish breakout
Multiple : x times RCM/ATR
Swing Length : Sets the 'left' period ('right' period is always 1)
Colours : colour of TP/SL box and border
Borders : Style border when breakout levels stop being updated, but TP/SL is not reached. (Default dotted dot , other option is dashed dsh or solid sol )
🔹 Extra
Show Timeframe Change : Show a grey vertical line when a new Higher Timeframe interval begins
Detect False Outbreak
Cancel TP/SL at end of HTF
🔹 Show Dashboard
Location: Location of the dashboard (Top Right or Bottom Right/Left)
Size: Text size (Tiny, Small, Normal)
See USAGE/DETAILS for more information

Flux Charts MTF Supply and Demand Zones (Premium)Indicator Overview
The Multi-Timeframe Supply & Demand Zones indicator by Flux Charts displays supply and demand zones on multiple timeframes with two different zone detection methods. These zones are commonly known as areas where there are lots of buyers/sellers present in the market.
Adaptive Detection Method
AMEX:SPY 5m timeframe, October 8 2023
Indicator Settings: (Timeframe: Chart & 15m, Method: Adaptive, Zone Multiplier: 1)
Many times supply and demand scripts try and precisely define conditions that qualify for supply and demand zones. People, however, when locating supply and demand zones manually generally do not take a quantitative approach, rather looking for qualities in price action that have generalized qualities and trends. The adaptive algorithm uniqueness comes from adapting the human approach to work computationally. It generalizes the qualities of supply and demand zones and locates areas in the chart with an acceptable similarity. Specifically, it looks for consolidated areas within the chart that are preceded by a rise or fall in price. The rise or fall length has to be a certain ratio to the consolidation length. If the criteria are met it will draw the zone, if a zone already exists at that price level it will ignore it or merge them if they are different timeframes. This results in a much more consistent ability to identify areas of supply and demand.
Basic Detection Method
The basic detection method looks for areas where price made drastic movements within a small period of time, which could indicate a high level of buyers/sellers at the spot. Thus, these zones are formed and can be used as areas of trading where money is going in/out of the markets.
Multi-Timeframe (MTF) S&D
Flux Charts supply and demand script utilizes MTF. This allows for displaying zones from different timeframes on one chart. Utilizing higher timeframes is a common practice in trading, and it can be easy to forget about key levels & zones on higher timeframes which could cause reversals/bounces.
Here is an example of a 15 minute supply zone formed on the NASDAQ, and with this indicator, you can also see this same 15 minute supply zone while being on a 5 minute candlestick chart, since you have the 15 minute zones enabled in the settings. This indicator offers supply & demand zones on multiple timeframes including the 5 minute, 15 minute, 30 minute, 1 hour, and 4 hour.
Settings
Method:
Choose between the Supply & Demand zones detection (Basic / Adaptive)
Zone Retests:
Choose how retests should be considered. You can choose between a high/low candle wick entering a zone, or a candle closing inside of a zone to be considered a valid retest.
Zone Invalidation:
Choose how zones are invalidated. You can choose between a high/low candle wick exiting a zone, or a candle closing outside of a zone to be considered a zone invalidation.
Zone multiplier:
Adjust zone size (1 is recommended)
Timeframe:
Choose the timeframes you would like Supply & Demand zones to be displayed from.
Zone Appearance:
Adjust the colors of Supply/Demand zones
Enable/Disable the center dashed line in zones
Display Labels:
Choose to toggle on/off retest & break labels
Notifications:
Choose what alerts you would like to receive. You can choose to have new zone formations, zone breaks, and zone retests.

NIFTY POSITION ScannerTracking the real-time intraday position of NIFTY stocks is the utility of this price action based scanner. The number of stocks in this scanner is 40 due to TradingView's script limit.
The script takes present day's price range of the stocks (stocks of the Index being tracked included in this screener) into account, to hint strength or weakness in the underlying Index (for example: NIFTY here).
The day's price range of a stock is gauged on a scale of 0-100, where 0 is Day's price low and 100 is day's price high.
If a stock is in 90-100 price range section the cell with title "90" illuminates hinting the stock is trading near day's high.
Likewise, if a stock is in 0-10 price range section the cell with title "10" illuminates hinting that the stock is trading near day's low.
The price range of 10-25 is represented in the cell titled "25"
The price range of 75-90 is represented in the cell titled "75"
Only one cell from the day's range illuminates at a time for a stock, signaling the present position of that stock in the Day's range at that instant.
The script works best above 10 second time frame.
Idea: If majority of the heavy weight stocks of the Index being tracked are trading near Day's high the underlying Index must be going strong at that very instant and Vice versa.
Disclaimer: Only for studying Index movement ideas intraday, trading is not advised.
Also check out the other scripts by me.
-- Dr. Vats

Volumetric Toolkit [LuxAlgo]The Volumetric Toolkit is a complete and comprehensive set of tools that display price action-related analysis methods from volume data.
A total of 4 features are included within the toolkit. Symbols that do not include volume data will not be supported by the script.
🔶 USAGE
The volumetric toolkit puts a heavy focus on price action, returning support/resistance levels, ranges, volume divergences...etc.
The main premise between each feature is that volume has a direct relationship with market participants level of interest over a specific symbol, and that this interest is not constant over time.
Each individual feature is detailed below.
🔹 Ranges Of Interest
The Ranges Of Interest construct a range from a surge of high liquidity in the market. This range is constructed from the price high and price low of the candle with the associated significant liquidity.
The returned extremities can be used as support and resistance, with breakouts often being accompanied by significant liquidity as well, suggesting potential trend continuations.
The length setting associated with this feature determines how sensitive the range detection algorithm is to volume, with higher values requiring more significant volume in order to display a new range.
🔹 Impulses
Impulses highlight times when volume makes a new higher high while the price makes a new higher high or lower low, suggesting increased market participation.
When this occurs when the price makes a new higher high the impulse is considered bullish (green), if the price makes a new lower low the impulse is bearish (red).
Impulses occurring within an established trend opposite to it (e.g a bearish impulse on an uptrend) might be indicative of reversals.
The length setting works similarly to the previously described ranges of interest, with higher values requiring longer-term volume higher high and price higher high/lower low, highlighting more significant impulse and potentially longer-term reversals.
🔹 Levels Of Interest
Levels of interest display price levels of significant trading activity, contrary to the range of interest only the closing price is taken into account, also volume peaks are used to detect significant trading activity.
Note that this feature is subject to backpainting, that is lines are set retrospectively.
Users can determine the amount of most recent levels to display on the chart. These can be used as classical support/resistances.
🔹 Volume Divergence
We define volume divergence as a decreased market participation while a trend is still developing.
More precisely volume divergences are highlighted if volume makes a lower high while price is making a new higher high/lower low.
This can be indicative of a lack of further participation in the current trend, indicating a potential reversal.
Using higher length values will return longer-term divergences.
Note that this feature is subject to backpainting, that is lines are set retrospectively.
🔶 SETTINGS
🔹 Ranges Of Interest
Show Ranges Of Interest: Display Ranges Of Interest.
Length: Ranges Of Interest sensitivity to volume.
🔹 Impulses
Show Impulses: Display Ranges Of Interest.
Length: Impulses sensitivity to volume.
🔹 Levels Of Interest
Show: Determine if Levels Of Interest are displayed, and how many from the most recent.
Length: Level detection sensitivity to volume.
🔹 Volume Divergences
Show Divergences: Determine if Volume Divergences are displayed.
Length: Period for the detection of price tops/bottoms and volume peaks.

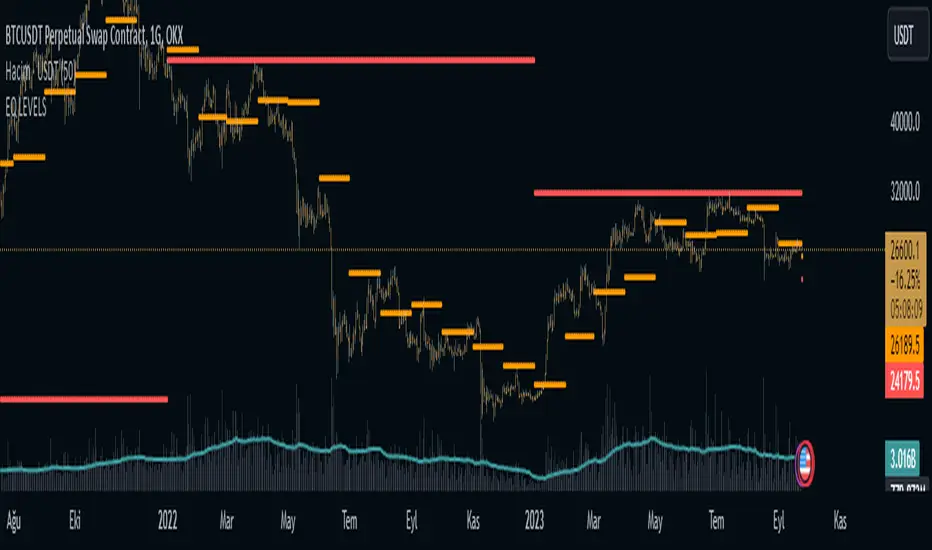
EQ LEVELS / EquilibriumWhat is it, How to use it, How to adjust the settings? What Calculates EQ Level?
What is it?
EQ, Equilibrium, In the money market, the term "equilibrium" or "equilibrium" refers to the point at which supply and demand are equalised. At this point, money supply and money demand meet each other and interest rates stabilise at a certain level. Equilibrium in the money market reflects the overall financial balance in the economy
According to What Calculates the EQ Level?
Normally, there may be many different alternatives to this, but I have printed the result on the screen by adding the highest and lowest levels of the prices and averaging them to think of a simple solution.
How to use it?
I have added 4 timeframes for both long-term investors and traders to use. If you want to use which timeframe, you can select the timeframe you want from the settings and see it on the chart. For those who want to trade, my suggestion is to follow the daily eq levels and of course look at the weekly eq levels. The weekly eq level can give you an idea of what kind of price range the next day may be in.
How to Make Settings?
When you first add the indicator to the chart, it draws a line. You change it to a circle or plus in the settings, it will look like the picture I shared. I also share open source code and can make changes in the code.
Nedir?, Nasıl Kullanılır?, Ayarları Nasıl Yapılır? EQ Seviyesini Neye Göre Hesaplar?
Nedir?:
EQ yani Equilibrium, Para piyasasında "denge" veya "equilibrium" terimi, arz ve talebin eşitlendiği noktayı ifade eder. Bu noktada, para arzı ile para talebi birbirini karşılar ve faiz oranları belirli bir seviyede dengelenir. Para piyasasındaki denge, ekonomideki genel finansal dengeyi yansıtır
EQ Seviyesini Neye Göre Hesaplar?
Normalde bunun farlı bir çok alternatifi olabilir ama ben biraz basit bir çözüm düşünmek için fiyatların en yüksek ve en düşük seviyelerini toplayarak ve ortalamasını alarak çıka sonucu ekrana yazdırdım.
Nasıl Kullanılır?
Hem uzun vadeli yatırım yapanlar hem de trade yapanların kullanabilmesi için 4 zaman dilimi ekledim. Hangi zaman dilimini kullanmak istiyorsanız ayarlardan istediniz zaman dilimini seçip onu grafikte görebilirsiniz. Trade yapmak isteyenler için önerim günlük eq seviyelerini takip etmeleri ve tabiki haftalık eq seviyelerine bakın. Haftalık eq seviyesi size bir sonra ki günün nasıl bir fiyat aralığı içerisinde olabileceği konusunda fikir verebilir.
Ayarları Nasıl Yapılır?
Grafiğe indikatörü ilk eklediğiniz de çizgi çizdirir. Siz ayarlardan onu daire veya artı olarak değiştirin benim paylaştığım resimde ki gibi görünecektir. Ayrıca açık kaynak kodlu paylaşıyorum isteyen kod içerisinde değişiklikler yapabilir.
World Class SMC [WinWorld]This indicator uses valid pullbacks in order to draw market structure with strict accordance to TradingHub strategy.
Features
Our indicator uses a number of price concepts, such as:
IDM
BoS & ChoCh ( also their sweeps )
Automatic resolving of ChoCh-IDM and IDM-BoS conflicts
Orderblocks (IDM, Extreme)
True Fair Value Gaps (FVG)
True PDH/PDL
SCOB pattern
One of the core features is the ability to choose a time point, from which the market structure will be drawn. This feature alone allows you to test your most desired hypotheses about the market movements within a few clicks, so no more guesses and "what if"s, because you get the opportunity to test everything yourself and right now.
Settings
Let's review the settings themselves:
Extended Structure: allows you to choose between drawing market structure for a whole timeline or from specific time point only;
Build OB by sweeps: allows you to only draw orderblocks from candle, which took liquidity from previous candle by sweep;
Structure colours & text: allows you to customise visuals representations of market structure elements on your chart;
Structure visuals: allows you to choose which elements of market structure you want / don't want to see on your chart;
Show trend: allows you to choose the way market structure trend will be displayed on your chart: divider or background colouring ;
Alerts for each and every event , whether it is a new BoS, ChoCh, orderblock and etc.
Usage Examples
IDM Orderblock ( OB-IDM )
Basic demonstration
When price reaches OB-IDM, you will be able to receive an alert. After that, check if the candle, that reached OB-IDM, closed inside or above ( bearish scenario )/ below ( bullish scenario ) OB-IDM's boundaries. If conditions above were met, go on LTF and look for an entry.
Extreme Orderblock ( OB-EXT )
Basic demonstration
Similar to OB-IDM situation: When price reaches OB-EXT, you will be able to receive an alert. After that, check if the candle, that reached OB-EXT, closed inside or above ( bearish scenario )/ below ( bullish scenario ) OB-EXT's boundaries. If conditions above were met, go on LTF and look for an entry.
Sweep PDH/PDL
Basic demonstration
* PDH — Previous Day High
* PDL — Previous Day Low
When you received PDH sweep alert and current trend is bearish, go on LTF to find entry point. ( bullish scenario: PDL sweep and current trend is bullish )
Sweep ChoCh
Basic demonstration
If you get alert of sweeped ChoCh, it usually means that price grabbed the liquidity from extremum points and is ready to continue going with the trend. Go on LTF to find an entry.

Reversal Confirmations [QuantVue]The Reversal Confirmation Indicator is based on price action and looks to provide opportunities when price gets stretched.
The indicator works by finding the highest and lowest points over the user selected lookback period.
If price closes below the low of the highest bar or closes above the high of the lowest bar a possible reversion to the mean may occur and the indicator will plot a triangle and fire an alert.
This indicator works a reversion to the mean or to potentially time entries in trending markets.
Fully customizable settings:
🔹Lookback Period
🔹Colors
🔹Show / hide upper & lower channels
🔹Show / hide the mean
Give this indicator a BOOST and COMMENT your thoughts!
We hope you enjoy.
Cheers!

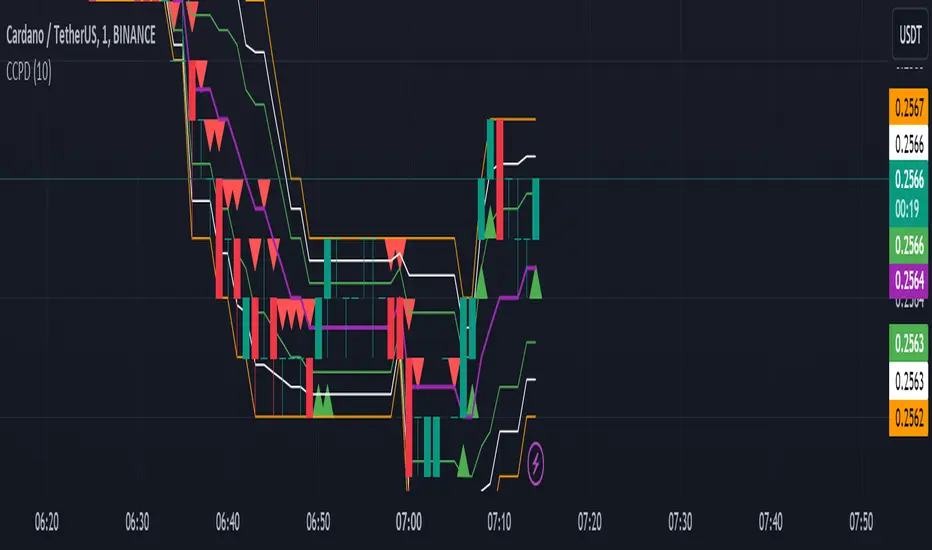
CCPD Candle Color Price DetectorThe "CCPD Candle Color Price Detector" is a custom indicator developed for TradingView, a popular platform for technical analysis and trading. This indicator assists traders in identifying potential trend reversals and assessing market sentiment based on candlestick color changes and key price levels.
This indicator operates as follows:
Color Change Detection: It primarily focuses on the color of candlesticks (green for bullish and red for bearish). When a candlestick closes higher than it opens, it is considered green (bullish), and when it closes lower, it is red (bearish).
High and Low Analysis: The indicator calculates the highest high and lowest low over a user-defined number of bars (specified by the 'Bars for High/Low' input parameter). This helps identify recent price extremes.
Midpoint Calculation: It then computes the midpoint between the highest high and lowest low, effectively determining a central reference point within the specified period.
Signal Generation: Buy and sell signals are generated based on the relationship between the current candlestick's close price, the midpoint, and the candlestick color. Buy signals occur when a green candle closes above the midpoint, suggesting potential bullish momentum. Conversely, sell signals trigger when a red candle closes below the midpoint, indicating possible bearish pressure.
Visualization: The indicator visualizes the highest high, lowest low, midpoint, and additional lines to aid in understanding the price action and potential reversal points.
Alerts: It provides alerts for buy and sell signals, allowing traders to receive notifications when potential trading opportunities arise.
Usage:
Traders can utilize the "CCPD Candle Color Price Detector" in the following ways:
Trend Reversal Identification: This indicator can help traders spot potential trend reversals by signaling when candlestick colors change and close near the midpoint. Buy and sell signals offer entry points for trades based on these reversals.
Confirmation Tool: It can be used in conjunction with other technical analysis tools to confirm trading decisions. For example, a buy signal from this indicator, coupled with a bullish trendline break or a bounce from a key support level, may provide a stronger bullish signal.
Risk Management: By understanding potential reversal points and using stop-loss orders, traders can better manage their risk and protect their capital when entering positions based on the indicator's signals.
Customization: The indicator allows users to adjust the number of bars for high/low calculations, making it adaptable to different trading strategies and timeframes.
In summary, the "CCPD Candle Color Price Detector" is a versatile indicator that can aid traders in spotting potential trend changes, enhancing trading decisions, and managing risk effectively. However, like any trading tool, it should be used in conjunction with other analysis methods and risk management strategies for optimal results.
Incomplete Session Candle - Incomplete Timeframe Candle Marker The "Incomplete Session Candle - Incomplete Timeframe Candle Marker" is an advanced tool tailored for technical analysts who understand the importance of accurate timeframes in their charting. While the indicator is not limited to the Indian market, its genesis is rooted in the nuances of trading sessions like those in India, which span 375 minutes from 9:15 AM to 3:30 PM.
Key Features:
Detects if the current timeframe is intraday (minutes or hours).
Calculates the expected duration of the candle for the chosen timeframe.
Highlights candles that don't achieve their expected session duration by placing a cross shape above the bar.
Compatible across various intraday timeframes, aiding traders in spotting discrepancies promptly.
Why We Made This: Not Just for India:
While we looked at the Indian market, this indicator works everywhere. Regular timeframes like 30 minutes, 1 hour, and 2 hours often end with incomplete candles, especially at the end of the trading day. For example:
A 30-minute timeframe makes 13 candles, but the last one is only 15 minutes long.
A 1-hour timeframe shows 7 candles, but the last one is just the last 15 minutes.
By switching to different timeframes like 25 minutes, 75 minutes, and 125 minutes, you get more complete information for better trading decisions. Learn more about this in our article: "Power of 25, 75, and 125-Minute Timeframes in the Indian Market", recognized by Trading View's Editors' Pick.
Benefits:
The indicator extends its benefits even to users without access to certain timeframes. It accommodates traders using a 1-hour timeframe (pertaining to Indian traders). By employing this indicator, traders consistently remain mindful of incomplete candles within their chosen timeframe
For those who utilize concepts like RBR, RBD, DBR, and DBD, this indicator is paramount. An incomplete candle can skew analysis, leading to potential misinterpretations of base or leg candles.
Final thoughts:
In markets like the Indian stock market, adopting such a tool is not just beneficial, but necessary. Whether you have access to unconventional timeframes or are using traditional ones, recognizing and accounting for the limitations of incomplete candles is critical & it's important to know if your candles fit the timeframe properly. This indicator gives you a better view of the market, which helps you make smarter trades.
Lastly, Thank you for your support! Your likes & comments. If you want to give any feedback then you can give in comment section.
Let's conquer the markets together!

Reversal Candles UG [5ema]The indicator can be find 8 reversal candlestick patterns of bullish or bearish.
-----
How to build?
Based on available reversal patterns that was be share by a group trader.
With name: T1, T1S, T2, T2S, T3, T3S, T3 Pro, T3 Max.
Ex1 - T1 Bull Candles and T3 Bull Candles:
Ex2 - T2 Bull Candles:
Ex2 - T1S Bull Candles:
-----
How to use?
Combine with other indicators like MA, EMA, RSI, Support, Resistance,... to set up a trading strategy.
Make a Alert to get a notification when a reversal candles appear.
-----
This indicator is for reference only, you need your own method and strategy.
If you have any questions, please let me know in the comments.

OrderBlock [kyleAlgo]The principle of this indicator
ATR (Average True Range) Setting: The code uses ATR to help calculate the Supertrend indicator.
Supertrend Trend Direction: Identify bullish and bearish trends with the Supertrend method.
Order Block Recognition: This part of the code recognizes and creates order blocks, visualizing them as boxes on the chart. If the number of blocks exceeds the maximum limit, old blocks will be deleted.
Function to prevent overlapping: check whether the new order block overlaps with the existing order block through the isOverlapping function.
Order block color setting: The code sets the color according to whether the block is bullish or bearish, and whether it breaks above or below. Afterwards the color of the existing order blocks will be updated.
Sensitivity settings: Through the input settings of factor and atrPeriod, the sensitivity of Supertrend and the detection of order blocks can be affected.
Visualization: Use TradingView's box.new function to draw and visualize order blocks on the chart.
Practicality:
Support and Resistance Levels: Order blocks may represent areas of support and resistance in the market. By visualizing these areas, traders can better understand when price reversals are likely to occur.
Trading Signals: Traders may be able to identify trading signals based on the color changes of blocks and price breakouts. For example, if the price breaks above a bullish block, this could be a signal to buy.
Risk Management: By using ATR to adjust the sensitivity of Supertrend, the symbol helps traders to adjust their strategies according to market volatility. This can be used as a risk management tool to help identify stop loss and take profit points.
Multi-timeframe analysis: Although the code itself does not implement multi-timeframe analysis directly, it can be done by applying this indicator on different timeframes. This helps to analyze the market from different angles.
Flexibility and Customization: Through sensitivity settings, traders can customize the indicator according to their needs and trading style.
Reduced screen clutter: By removing overlapping order blocks and limiting the maximum number of order blocks, this code helps reduce clutter on charts, allowing traders to analyze the market more clearly.
Overall, this "Pine Script" can be a powerful analytical tool for trend traders and those looking to improve their trading decisions by visualizing key market areas. It can be used alone or combined with other indicators and trading systems for enhanced functionality.

PDHL levels with INTRADAY Auto FIBThe present script includes Previous day High/low levels and once the PDH or PDL breaks the present bar's background changes color according to the direction of price breakout.
It's helpful when working on lower timeframe charts with small screen space, so that the user can know that the PDHL has been taken out in one glance at the chart instead of scrolling all around to find out whether the PDH or PDL are broken or not.
The high and low of day before yesterday are also plotted for reference.
The intraday fib levels get drawn taking present day's high and low into account, useful to mark support/retest levels.
The color of the intraday AUTO FIB high and low lines also change from gray to respective assigned colors once the present day price crosses PDH or PDL this is helpful while viewing charts on mobile app.
Disclaimer: Only for studying price movement ideas, trading is not advised.

FastlaneIt will show a Marking (dot) above/below the candle where the Volume is 500000 and is up more than 5%.

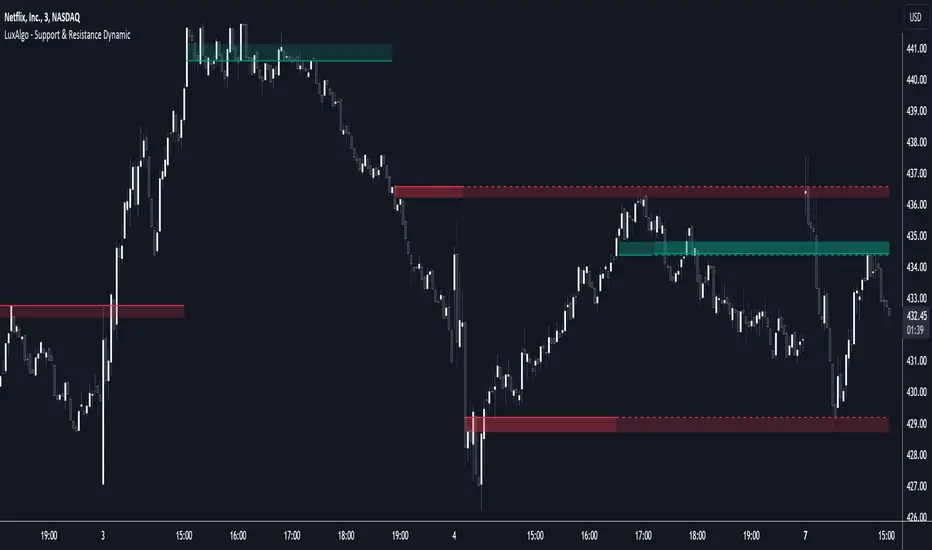
Support & Resistance Dynamic [LuxAlgo]The Support & Resistance Dynamic indicator aims to return real-time predictive support and resistance zones that are relevant to a detected trend. This makes this indicator similar to our previously published Predictive Ranges indicator.
Users can additionally extend the most recent historical support and resistance zones.
🔶 USAGE
Hypothetical resistance levels in an up-trend or supports in a down-trend would tend to be broken more easily, as such the indicator primary objective is to return reliable real-time support and resistance levels by taking this into account.
When the market is up-trending the indicator will only return support zones, while a down-trending market will cause the indicator to only return resistance zones.
If the price significantly breaks a support/resistance, rendering it unreliable, it can be a sign of a potential reversal.
Users can return support/resistance levels/zones for shorter-term trends by reducing the Multiplicative Factor setting.
🔹 Extension
Users can extend past estimated support/resistance levels, the amount of extended levels is determined by the users. Certain levels can stay relevant in the future, and can also aid in measuring the significance of a breakout, with further past levels being reached being indicative of more significant trends.
🔶 DETAILS
To determine if the price is up-trending or down-trending in order to show either support or resistance, the same method used in the predictive ranges script is used. A central tendency is estimated, if price significantly deviates from it upward an uptrend is detected, else a significant deviation downward would indicate a downtrend.
The central tendency estimate is used for the construction of the support and resistance levels.
🔶 SETTINGS
Multiplicative Factor: Determines the frequency at which new supports/resistances are returned, with lower values returning more frequent levels/zones.
ATR Length: ATR averaging length used as deviation threshold for the central tendency estimate.
Extend Last: Determines the amount of most recent historical supports/resistances to extend to the latest bar.
TradeMaster ProTrading effectively requires a range of techniques, experience, and expertise. From technical analysis to market fundamentals, traders must navigate multiple factors, including market sentiment and economic conditions. However, traders often find themselves overwhelmed by market noise, making it challenging to filter out distractions and make informed decisions. To address this, we present a powerful indicator package designed to assist traders on their journey to success.
The TradeMaster indicator package encompasses a variety of trading strategies, including the SMC (Supply, Demand, and Price Action) approach, along with many other techniques. By leveraging concepts such as price action trading, support and resistance analysis, supply and demand dynamics, these indicators can empower traders to analyze entry and exit positions with precision. Unlike other forms of technical analysis that produce values or plots based on historical price data, Price Action brings you the facts straight from the source - the current price movements.
The indicator package consists of three powerful indicators that can be used individually or together to maximize trading effectiveness.
⭐ About the Pro Indicator
The Pro indicator is the cornerstone of the package, offering a comprehensive range of functions. It's strength lies in our unique structure calculation, which is based on real price action data, capturing every ticks from small intraday fluctuations to the significant high timeframe movements. The Pro Indicator reflects our personal use and deep comprehension of Smart Money Concepts. It provides streamlined tools for tracking algorithmic trends with modern visualizations, without unnecessary clutter.
In the ever-evolving trading landscape, mainstream methods and strategies can quickly become outdated as they are widely adopted. Liquidity is constantly sought after, and the best source for this is exploring and exploiting trading strategies that are widely accepted and applied. Currently, one of these strategies is the SMC (Supply, Demand, and Price Action).
It's no coincidence that our educational materials incorporate concepts such as liquidity grabs (LG) and Smart Money Traps (SMT). As the application of SMC gains popularity among retail traders, trading with this approach becomes more challenging. Therefore, the recent focus has been on reforming the SMC methodology, as it is the only method that relies on real price movements and will always work when applied correctly.
▸ What does proper application of SMC entail?
Many SMC traders associate their key areas of interest with the market structure, which is generally considered acceptable. However, depending solely on a single foundation can lead to significant deviations, which may cause notable impacts on trading results. Moreover, if the basis for the market structure calculation is inaccurate, the consequences can be even more severe. It's akin to risking money on a lottery ticket, believing it will be a winner.
Our methodology is different, and it may ensure longevity in the financial markets. The structure remains crucial, but it is not the sole foundation of everything; instead, it serves as a validation tool. Each calculation, such as order blocks (OB), Fair Value Gaps (FVG), liquidity grabs (LG), range analysis, and more, is independent and unique, separate from the structure. However, validation must ultimately come from the structure itself.
We employ individual and high-quality filters: before a function calculation is validated by the structure, it must undergo rigorous testing based on its own set of validation conditions. This approach aims to enhance robustness and accuracy, providing traders with a reliable framework for making informed trading decisions.
▸ An example for structure validation: Order Block with "Swing Sensitivity"
These order blocks will only be displayed and utilized by the script if there is a swing structure validation with a valid break. In other words, the presence of a confirmed swing Change of Character (ChoCh) or Break of Structure (BoS) is essential for the Order Block to be considered valid and relevant.
This approach ensures that the order blocks are aligned with the overall market structure and are not based on isolated or unreliable price movements. Whether it's Fair Value Gaps (FVG), Liquidity Grabs (LG), Range calculations, or other functionalities, the same underlying principle holds true. The background structure calculation serves as a validation mechanism for the data and insights generated by these functions, ensuring they adhere to the specific criteria and rules established within our methodology. By incorporating this robust validation process, traders can have confidence in the reliability and accuracy of the information provided by the indicator, allowing them to make informed trading decisions based on validated data and analysis.
👉 Usage - the general approach:
Determine your trading style using the Pro Indicator and build your basic strategy. This indicator helps you understand your trading style, whether it's swing trading, scalping or another approach. By analyzing the Pro Indicator, you gain valuable information about potential market trends, entry and exit points, and overall market sentiment.
👉 Example of usage:
In the following chart, you'll notice how we've utilized the indicator to formulate a strategic trading approach. We've employed Order Blocks equipped with volume parameters to identify crucial market zones. Simultaneously, we've leveraged swing/internal market structures to gain insights into potential long and short-term market turnarounds. Lastly, we've examined trend line liquidity zones to pinpoint probable impulses and breakouts within ongoing trends.
Now we can see how the price descended to the order block with the highest volume, which we had previously marked as our point of interest for an entry. As the price closed below the median Order Block, we noted its mitigation. After an internal CHoCH, it's directing us towards the main Order Block as a target.
👉 Smart Money Concepts Functions
Market Structure: identifies and marks key structural changes in the market, in order to visually highlight shifts in market trends and patterns. This feature is designed to alert you of significant changes in the market's behavior, signaling a potential shift from accumulation to distribution phase, or vice versa. It helps traders adapt their strategies based on evolving market dynamics.
Order Blocks: pinpoints crucial zones where large institutional investors ("smart money") have shown strong buying or selling interest recently. Order blocks can serve as a tool for identifying key levels for potential trade entries or exits.
FVGs (Fair Value Gaps): detects discrepancies between the perceived market value and actual market price, revealing potential areas for price correction. With its mitigation settings, you can fine-tune the FVG detection according to the magnitude of value misalignment you consider significant.
Liquidity Grabs: helps track "smart money" footprints by identifying levels where large institutional traders may have induced liquidity traps. Understanding these traps can aid in avoiding false market moves and optimizing trade entries.
Automatic Fibonacci Tool: Simplifying the task of identifying key Fibonacci retracement and extension levels, this tool ties Fibonacci levels to the structure for you. It aids in recognizing significant support and resistance levels, providing a clearer understanding of potential price movements.
The Smart Money Concepts trading strategy - combined with these dynamic features - becomes a powerful analytical asset for any trader, providing in-depth insights into market dynamics, trends, and potential opportunities.
👉 Algorithmic trend and dynamic support and resistance
Trend Rainbow: This proprietary feature uses our unique TRMA** method to define short-term, medium-term, and long-term market trends. It incorporates state-of-the-art visualization techniques to render the trend information in an intuitive, easily interpretable manner. It's a 21st-century tool designed for the modern trader who values both precision and simplicity.
Multi-Timeframe Moving Averages: This feature allows traders to simultaneously monitor moving averages across multiple timeframes, providing a comprehensive perspective on market trends. It helps identify dynamic support and resistance zones, key levels where price movements are likely to slow down or reverse. This function not only aids in planning potential trade entries and exits, but also calculates the precise percentage distance to these levels. Can be as well crucial for risk management, enabling traders to set stop losses and profit targets based on solid, data-driven analysis. The Multi-Timeframe Moving Averages function is a versatile tool that combines strategic planning and risk control into a single, easy-to-use feature.
👉 Unlock the Hidden Market Dynamics
Market Sessions: This feature - by default - provides a clear representation of the four major global trading sessions. Each session is distinctly marked on your trading chart, helping you visualize the specific time periods when these markets are most active. Recognizing these sessions is critical for understanding market dynamics, as the opening and closing of major markets can lead to significant price movements. Whether you're a day trader looking to exploit intra-day volatility or a long-term investor wanting to understand broader market trends, the Market Sessions feature can be a useful tool in your trading toolkit.
Divergence Functions: allow the use of unique indicators along with our proprietary ones to detect potential price reversals. As each asset has a different market maker, divergences can vary greatly across different charts and timeframes. With our Divergence Ranking Table, you can quickly determine which divergences have the highest success rates and which are the least successful on a given chart. This feature allows you to adapt your strategies to the most effective signals, enhancing your trading decisions and boosting your potential profits.
Volume Profile with delta: This feature may give traders an edge by providing an in-depth view of market activity. It illustrates the amount of trading volume at different price levels, combined with the 'delta', which is the difference between buying and selling volume. This information allows you to see areas of high trading activity and understand whether the volume is pushing the price up or down. This real-time insight into the market's supply and demand can be instrumental in identifying key support and resistance levels, predicting potential reversals, and recognizing where the market is likely to move. Similarly to Fibonacci tool, Volume Profile can be tied to the current market structure.
👉 Improve Trading Decisions
Range: This innovative feature assists traders in determining discount, premium, and equilibrium zones. It provides a unique way of visualizing price areas where a security could be overbought or oversold (premium or discount zones), and where the price is expected to be fair and balanced (equilibrium zone). Distance from current price is displayed in percentage terms, which can assist traders with crucial data for risk management and strategic planning. The Range function helps you identify the most favorable price zones for entries and set your stop-loss and take-profit levels more accurately.
Previous OHLC: This functionality offers the capability to display the previous Open, High, Low, Close values. It is primarily set on the daily timeframe and serves as an important reference for traders. Having an overview of these key levels from the previous day gives you a solid foundation on which to base today's trading decisions. Recognizing these levels can help you predict potential turning points in the market, providing an advantage in your trading strategy.
Smart Money Zones: our secret weapon for swing traders. Similarly to order blocks, these zones can accurately identify crucial areas of strong buying or selling interest by large institutional investors. However while Order Blocks focus on recent price action, Smart Money Zones take the whole chart into consideration, resulting in more established support and demand zones.
The summary graph combines six unique indicators (Momentum, Trend Strength, Volume, Volatility, Asset Strength, and Sentiment) along with Structure and Sessions. These indicators use our TRMA** method to provide a comprehensive overview of market dynamics. By consolidating these indicators into a single graph, traders can gain valuable insights into the overall market landscape.
** TRMA (Trend Rainbow Moving Averages) is a complex but customizable moving average matrix calculation that is designed to measure market trend direction, strength and shifting.
⭐ Conclusion
We hold the view that the true path to success is the synergy between the trader and the tool, contrary to the common belief that the tool itself is the sole determinant of profitability. The actual scenario is more nuanced than such an oversimplification. Our aim is to offer useful features that meet the needs of the 21st century and that we actually use.
🛑 Risk Notice:
Everything provided by trademasterindicator – from scripts, tools, and articles to educational materials – is intended solely for educational and informational purposes. Past performance does not assure future returns.

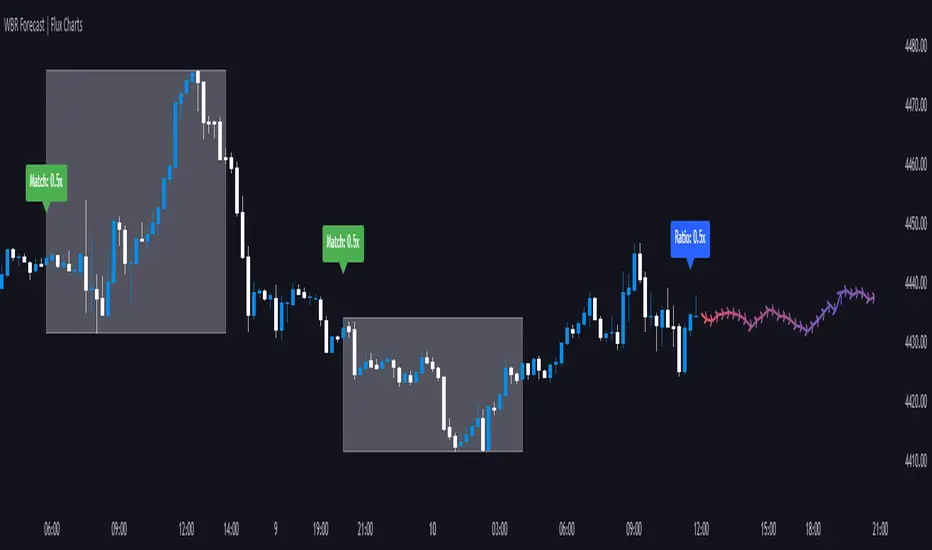
Wick-to-Body Ratio Trend Forecast | Flux ChartsThe Wick-to-Body Ratio Trend Forecast Indicator aims to forecast potential movements following the last closed candle using the wick-to-body ratio. The script identifies those candles within the loopback period with a ratio matching that of the last closed candle and provides an analysis of their trends.
➡️ USAGE
Wick-to-body ratios can be used in many strategies. The most common use in stock trading is to discern bullish or bearish sentiment. This indicator extends candle ratios, revealing previous patterns that follow a candle with a similar ratio. The most basic use of this indicator is the single forecast line.
➡️ FORECASTING SYSTEM
This line displays a compilation of the averages of all the previous trends resulting from those historical candles with a matching ratio. It shows the average movements of the trends as well as the 'strength' of the trend. The 'strength' of the trend is a gradient that is blue when the trend deviates more from the average and red when it deviates less.
Chart: AMEX:SPY 30 min; Indicator Settings: Loopback 700, Previous Trends ON
The color-coded deviation is visible in this image of the indicator with the default settings (except for Forecast Lines > Previous Trends ), and the trend line grows bluer as the past patterns deviate more.
➡️ ADAPTIVE ACCEPTABLE RANGE
The algorithm looks back at every candle within the loopback period to find candles that match the last closed candle. The algorithm adaptively changes the acceptable range to which a candle can differ from the ratio of the last closed candle. The algorithm will never have more than 15 historical points used, as it will lower its sensitivity before it reaches that point.
Chart: BITSTAMP:BTCUSD 5 min; Indicator Settings: Loopback 700
Here is the BTC chart on 7/6/23 with default settings except for the loopback period at 700.
Chart: BITSTAMP:BTCUSD 5 min; Indicator Settings: Loopback 200
Here is the exact same chart with a loopback period of 200. While the first ratio for both is the same, a new ratio is revealed for the chart with a loopback of only 200 because the adaptive range is adjusted in the algorithm to find an acceptable number of reference points. Note the table in the top right however, while the algorithm adapts the acceptable range between the current ratio and historical ones to find reference points, there is a threshold at which candles will be considered too inaccurate to be considered. This prevents meaningless associations between candles due to a particularly rare ratio. This threshold can be adjusted in the settings through "Default Accuracy".
Days Higher Than Current PriceThe "Days Higher Than Current Price" indicator is a color-coded tool that provides insights into the historical price performance of an underlying asset. By analyzing the number of bars prior to the selected day that had higher closing prices, this indicator visually represents the comparative strength or weakness of the current price level.
The "Days Higher" indicator utilizes a color-coded scheme to indicate the number of days in the asset's price history where the closing prices were higher than the current day's price. The color spectrum ranges from red to blue, representing varying levels of historical price strength.
Color Coding:
The color coding scheme of the indicator offers a quick and intuitive understanding of the price performance:
Red: Represents a higher number of days in the asset's price history where the closing prices were higher than the current day's price. This suggests a weaker price trend or a potential reversal and indicates relative price weakness.
Blue: Represents a lower number of days in the asset's price history where the closing prices were higher than the current day's price. This indicates a strong trend of higher prices and suggests relative price strength.
Orange & Green: Correspond to different numbers of days where the closing prices were higher than the current day's price. The specific color gradations between red and blue reflect increasing or decreasing historical price strength.
Methodology:
The "Days Higher" indicator examines each bar in the asset's price history leading up to the selected day. It counts the number of bars where the closing prices were higher than the current day's price.
The indicator then assigns a specific color to the price chart based on the count of such days, providing a visual representation of historical price strength relative to the current price level.
Utility:
The "Days Higher" indicator offers traders and investors a unique perspective on the historical price performance of an asset. By assessing the color-coded chart, market participants can quickly gauge the presence of strong or weak historical price trends.
This information can be used to identify potential support or resistance levels, assess the overall strength of a trend, or evaluate the likelihood of a price reversal. Traders may incorporate this indicator into their analysis to make more informed trading decisions based on the historical price strength indicated by the color-coded chart.
It is important to note that this tool should be used in conjunction with other technical analysis tools and indicators to validate signals and make well-rounded trading decisions.
Example Charts:
-Indices-
-Stocks-
-Cryptos-
-Multi-Timeframe-

Liquidity Sweeps and RaidsThis basic script calculates and plots runs on liquidity levels through Raids and Sweeps. When the price violates the 3 fractal level, a raid or sweep occurs. You can use it to automate markup, understand liquidity levels, and reduce human error in your analysis. Additionally, you can set up an alarm to notify you when new sweeps or raids occur. Combine it with your current strategy or try any price action theory you prefer. Essentially, the price always seeks liquidity, so when some of it is taken, it makes sense to look for a reaction and potential reversal. Stay ahead by capitalizing on liquidity insights for potential reversals. Cheers, Cancamurria.

K's Pivot PointsPivot points are a popular technical analysis tool used by traders to identify potential levels of support and resistance in a given timeframe. Pivot points are derived from previous price action and are used to estimate potential price levels where an asset may experience a reversal, breakout, or significant price movement.
The calculation of pivot points involves a simple formula that takes into account the high, low, and close prices from the previous trading session or a specific period. The most commonly used pivot point calculation method is the "Standard" or "Classic" method. Here's the formula:
Pivot Point (P) = (High + Low + Close) / 3
In addition to the pivot point itself, several support and resistance levels are calculated based on the pivot point value.
K's Pivot Points try to enhance them by incorporating multiple elements and by applying a re-integration strategy to validate two events:
* Found_Support: This event represents a basing market that is bound to recover or at least shape a bounce.
* Found_Resistance: This event represents a toppish market that is bound to consolidate or at least shape a pause.
K's Pivot Points are calculated following these steps:
1. Calculate the highest of highs for the previous 24 periods (preferably hours).
2. Calculate the lowest of lows for the previous 24 periods (preferably hours).
3. Calculate a 24-period (preferably hours) moving average of the close price.
4. Calculate K's Pivot Point as the average between the three previous step.
5. To find the support, use this formula: Support = (Lowest K's pivot point of the last 12 periods * 2) - Step 1
6. To find the resistance, use this formula: Resistance = (Highest K's pivot point of the last 12 periods * 2) - Step 2
The re-integration strategy to find support and resistance areas is as follows:
* A support has been found if the market breaks the support and shapes a close above it afterwards.
* A resistance has been found if the market surpasses the resistance and shapes a close below it afterwards.
The lookback period (whether 24 and 12) can be modified but the default versions work well.
