RKs Notepad++ Pine Script V5█ OVERVIEW
After reading all the new names and renames that Pine Script V5 brought to us, I knew that my old Notepad++ User Defined Language (UDL) would need a big update, so I decided to do a complete remake using the same Dark color scheme theme of the Pine Editor.
Then, I create a Notepad++ Theme and the Auto-Completion file with the Parameter hints for every built-in function to make everything look nicer
█ IMPORTANT
This is not an indicator!!
These are 3 XML files to copy and paste inside the Notepad++ folder.
You can use any Notepad Software to create the XML files.
The main Notepad++ folder is normally on %AppData%\Notepad++\
To avoid mistakes, always make a Backup of your files before anything.
█ INSTALLATION
Just follow these steps:
1. open a New Document File;
2. Copy everything between ↓↓↓ and ↑↑↑ symbols to this new document;
3. Remove the "//" of every single line;
4. Save each document with the correct name in the right folder;
5. Restart the Notepad++
█ NOTES:
If you have some problem installing, ask me, and I will try to help you.
But, in any case, here is the link to these files on my GitHub:
PLUS

OBV Divergence +This study Plots Divergences for OBV along with 2 MA's
Choose between standard type of OBV and OBV Accumulation / Distribution thanks to spacetrader which seems to be a truer reading
Divergence Alerts are provided so that you dont have to stare at your screen all day

OBV AverageThis study calculates the OBV and enables the ability to get the SMA of an OBV with a dynamic value of lookback set.

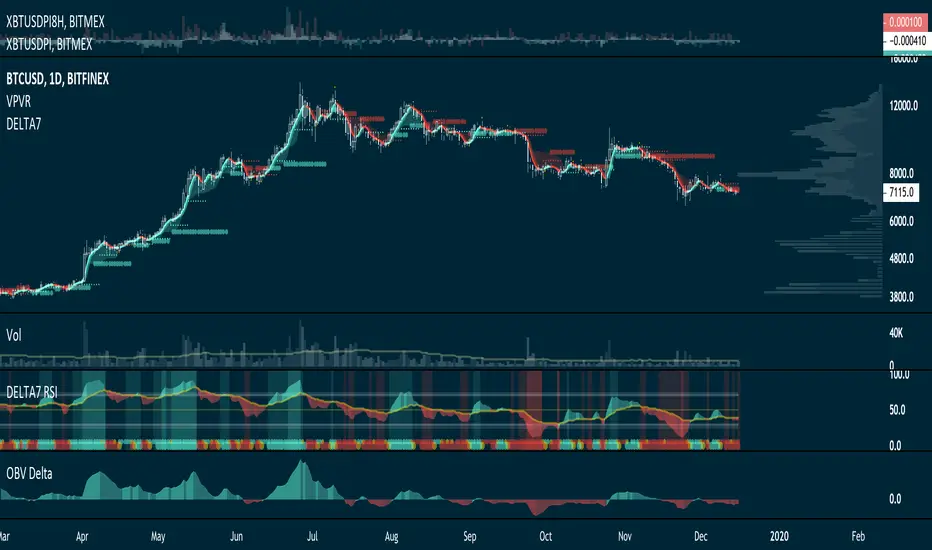
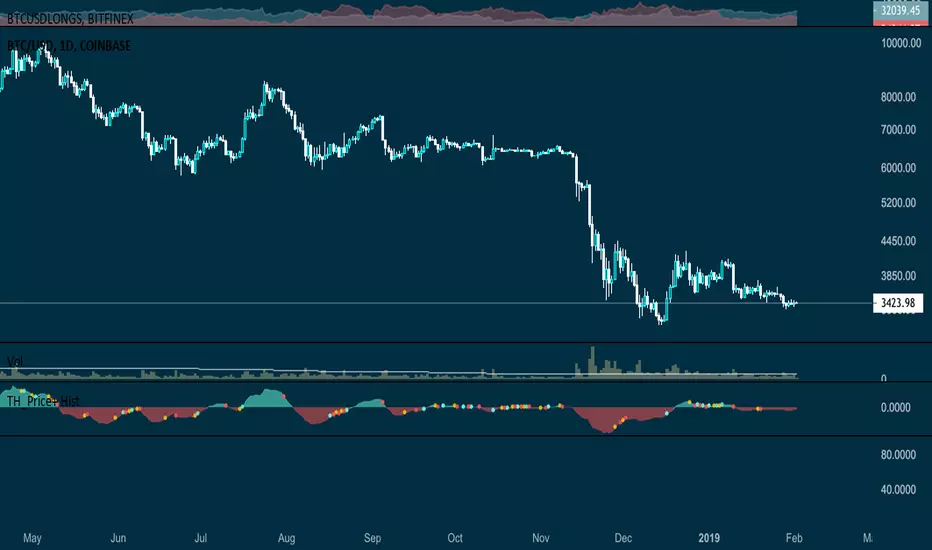
TH_Price+ HistogramPrice plotted into centralized oscillator normalized via 7/14 moving averages. The Histogram reveal longer trends while flags warn for early entry/exits. This script has been backtested with astonishing results particularly on 4H and Daily timeframes.
You can use this in combination with Hull+ or Delta Map (Premium), RSI+ or RSI Delta (Premium) and also OBV+ Histogram for stronger confirmations.
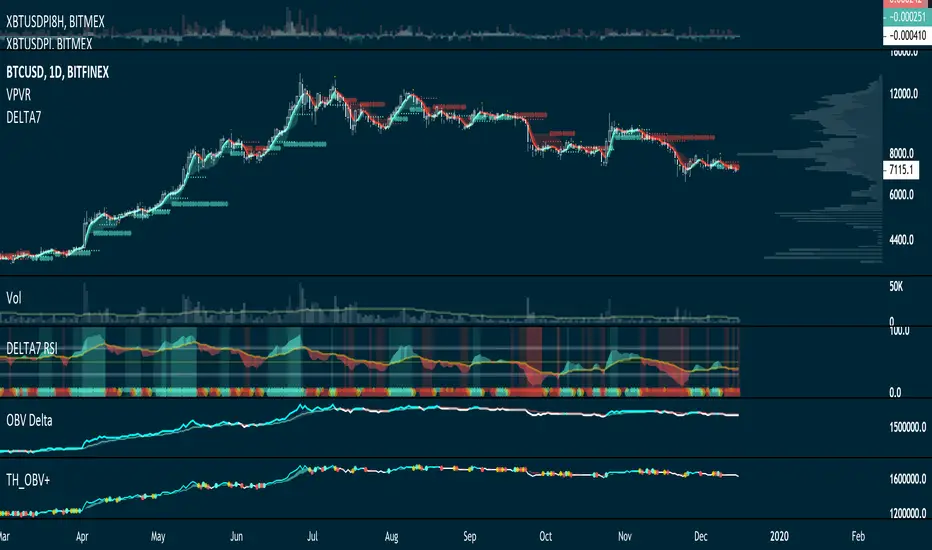
TH_OBV+ HistogramHi there!
This is an Histogram version of the OBV+ ( )
With this one, you will be also spot divergences and better time the market. Information is visually more clear and with the added benefit of less space required in your charts
Have fun!

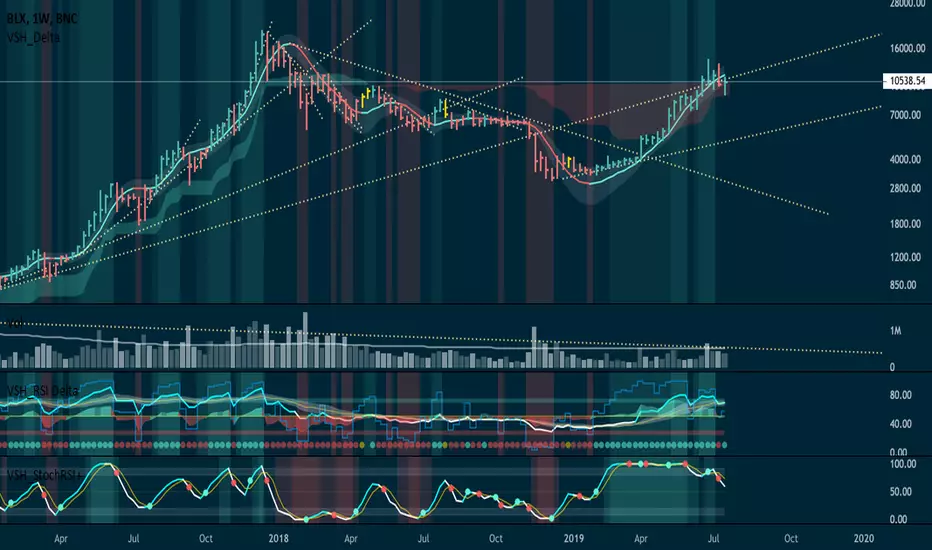
StochRSI+StochRSI+ is a Stoch RSI study enhanced with some background highlights and flags to enhance the visual reading of standard oscillator.
Default Settings:
RSI: 13
Stoch RSI: 13
%K: 3
%D: 3
Oversold: 20
Extended Oversold: 7
Overbought: 80
Extended Overbought: 93
Activate Highlights and/or Flags for:
- Stoch RSI Oversold/Overbought. (Default: Active)
- Stoch RSI Extended Oversold/Overbought. (Default: Active)
- %K crosses %D. (Default: Inactive)
MFI+MFI+ is a MFI study enhanced with a linear regression moving average.
Default Settings:
MFI: 13
Linear Regression of MFI: 34
Activate Vertical Bar Highlights and/or Signal Flags for:
- MFI Oversold/Overbought. (Default: Highlight Bar)
- MFI Extended Oversold/Overbought. (Default: Highlight Bar)
- MFI crossing its Linear Regression. (Default: Signal Flag)
Users can also do extra tuning in Style Section of Format options.
To user this indicator we need to observe the market's behaviour and identify which settings are fit for the timeframe and type market you trading.
Recommended suggested settings
RSI: 13/14
Linear Regression of RSI: 34/21
The market behaves differently when the pacing changes, volatility change and, when it trends or when it ranges. Develop an understanding of it with the help of this study.
Avoid risking more than 1% per trade. Be responsible for always making a priority about protecting capital and managing risk.
OBV+OBV+ is a OBV study enhanced with a linear regression moving average.
Default Settings:
Linear Regression of OBV: 34
Activate Vertical Bar Highlights and/or Signal Flags for:
- RSI crossing its Linear Regression . (Default: Both On)
Users can also do extra tuning in Style Section of Format options.
To use this indicator we need to observe the market's behaviour and identify which settings are fit for the timeframe and type market trading.
Recommended suggested settings
Linear Regression of OBV: 34/21
The market behaves differently when the pacing changes, volatility changes and when it trends or when it ranges. Develop an understanding of it with the help of this study.
Avoid risking more than 1% per trade. Be responsible for always making a priority about protecting capital and managing risk.
RSI+RSI+ is an augmented version of standard Relative Strength Index (RSI) enhanced with a EMA cloud and some momentum background highlights.
Includes 7 Color Themes (4 dark, 3 light).

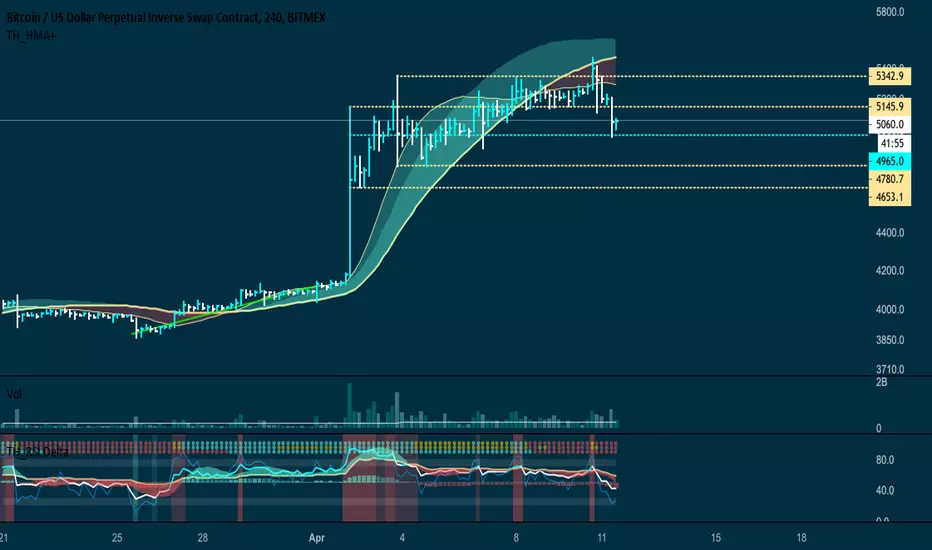
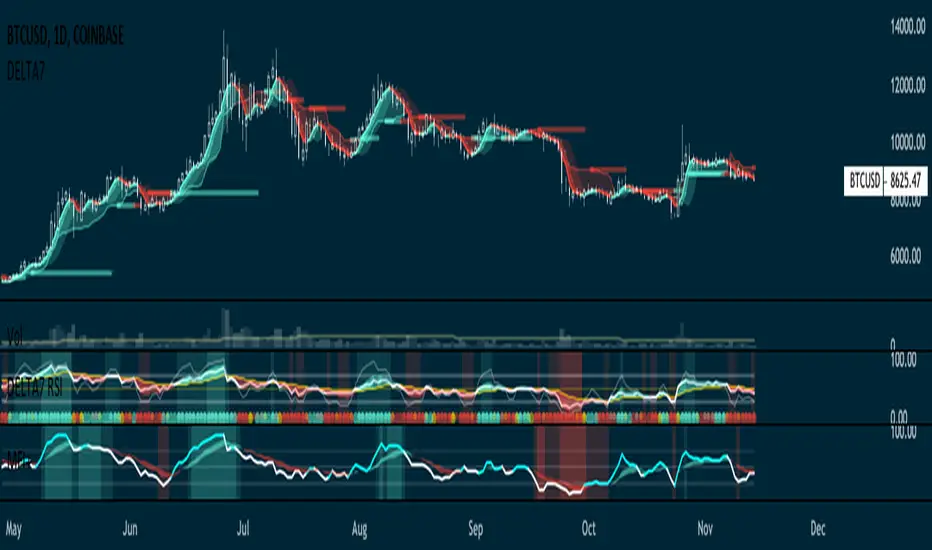
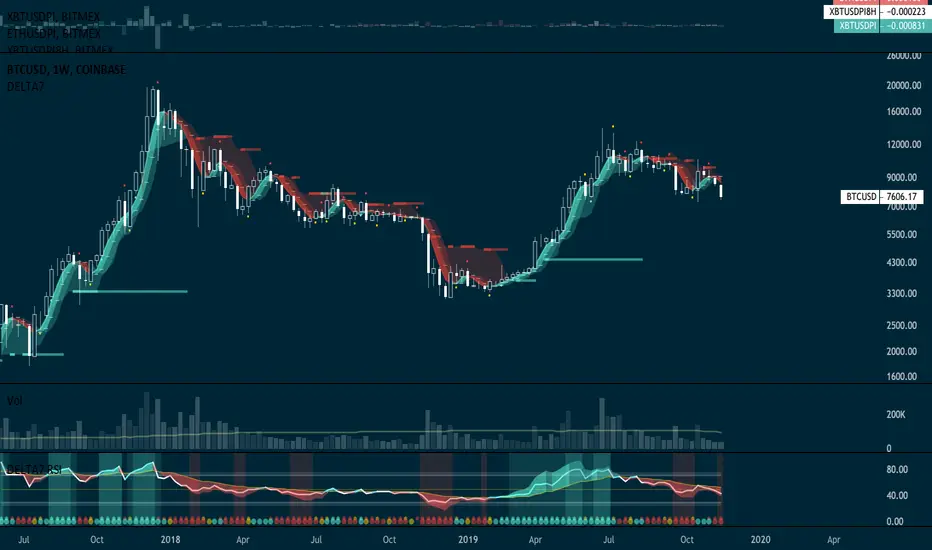
RSI 𝝙RSI 𝝙 is a full study system of several RSI analysis that can be used on different timeframes and adapt strategy to trending markets or trading ranges.
Identify better divergences/convergences, alerts for *potential* entry, flat and exit signals. Adapt personal strategy according to the market pace, behaviour and timeframe.
Default Settings:
RSI: 13
Linear Regression of RSI: 34
Signal RSI: 5
Long RSI: 55
RSI 𝝙 Histogram: Delta between RSI and Long RSI based on Signal RS 0.31% Length.
Activate Vertical Bar Highlights and/or Signal Flags for:
- RSI Oversold/Overbought. (Default: Highlight Bar)
- Signal RSI Oversold/Overbought. (Default: Highlight Bar)
- RSI crossing its Linear Regression . (Default: Signal Flag)
- RSI crossing its Long RSI . (Default: Off)
- Signal RSI crossing its RSI . (Default: Off)
- Signal RSI crossing its Long RSI . (Default: Off)
- RSI 𝝙 Histogram crossing baseline. (Default: Off)
Users can also do extra tunning in Style Section of Format options.
Typical use case for Daily timeframe:
RSI cross its Linear Regression produce a close signal of the on-going trend. RSI 𝝙 Histogram crossing could also provide early an signal or a confirmation. Then look RSI or RSI 𝝙 Histogram is forming a Divergence. If divergence is confirmed after candle close you can look into Signal RSI crossing RSI/Long RSI or RSI breaking the support/resistance horizontal/trendlines OR if you are more conservative wait until RSI cross Long RSI . The different markets will show slightly diff behaviours but with this indicator, we can capture its essence independently of timeframe.
RSI being above/bellow Long RSI establishes the relatively long-term bias in trending markets. This is also valid for Weekly and Monthly timeframes.
This is just a guideline suggestion. The reality is users of this indicator need to observe the market's behaviour and identify which signals will provide more reliable entries, exits and/or remain until next signals before the next round of trades.
The market behaves differently when pacing changes, volatility changes, when it trends or when it ranges. Develop an understanding of it with the help of this study.
Avoid risking more than 1% per trade. Be responsible for always making a priority about protecting capital and risk management. Develop emotional control and use this RSI study to develop a more complete trading system without any need for extra indicators other than Price and Volume .
👆active signals:
RSI crossing Linear Regression
RSI crossing Long RSI
👆active signals:
Signal RSI Long RSI
👆active signals:
RSI crossing Linear Regression
Also note that RSI 𝝙 Histogram divergences/convergences flag very often significant momentum changes. This important information is extremely useful when also looking to volume anomalies and help deciding to close a position (or enter next) before flash crash occur where a signal might come slightly late on higher timeframes.
Commodity Channel Index Plus (CCI+)Same CCI you love, but with a candle highlighter, control over Overbought & Oversold Line placement, and Alert Conditions for Overbought & Oversold and Recoveries, built right in.
Set the Overbought/Oversold Lines anywhere you want... use them to create CCI+ Alerts.

RSI Plus (RSI+)Same RSI you love, but with a candle highlighter, control over Overbought & Oversold Line placement, and Alert Conditions for Overbought & Oversold, built right in.
Set the Overbought/Oversold Lines anywhere you want... use them to create RSI+ Alerts.

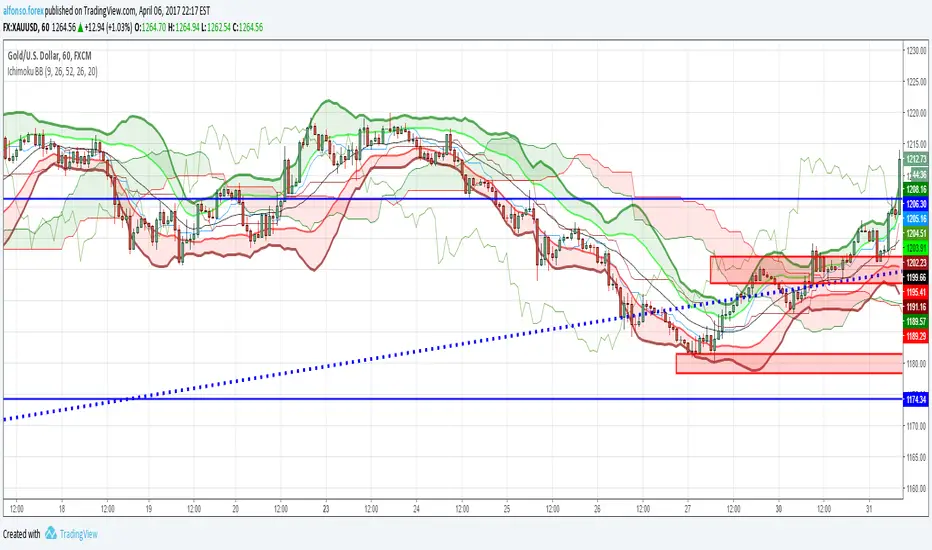
Ichimoku And DD Bollinger BandsIchimoku System Plus Double Bolliner Bands
Made in Mexico City with Love.