Yit's SMA'sThis is the first update to my original SMA indicators I've added the following:
10 Week SMA
40 Week SMA
3 Month SMA
18 Month SMA
I wanted to add more based on these being common indicators various types of trading uses.
There will probably be more in the future.
Utilitas Pine

ScalpMaster – Breaker BlocksIdeal for scalpers📈and intraday traders who rely on breaker-block reactions and market-structure shifts to refine entries and exits.
Add it to your chart, enable alerts for Signal UP and Signal DN, and combine with your own bias or higher-timeframe analysis.
✅ Automatic breaker-block detection (+BB / –BB)
✅ Real-time signal UP / signal DN
✅ Market-structure swing and PD Array visualization
✅ Optional take-profit targets (R:R zones)
✅ Alert conditions for every signal event
✅ Works on any timeframe & asset


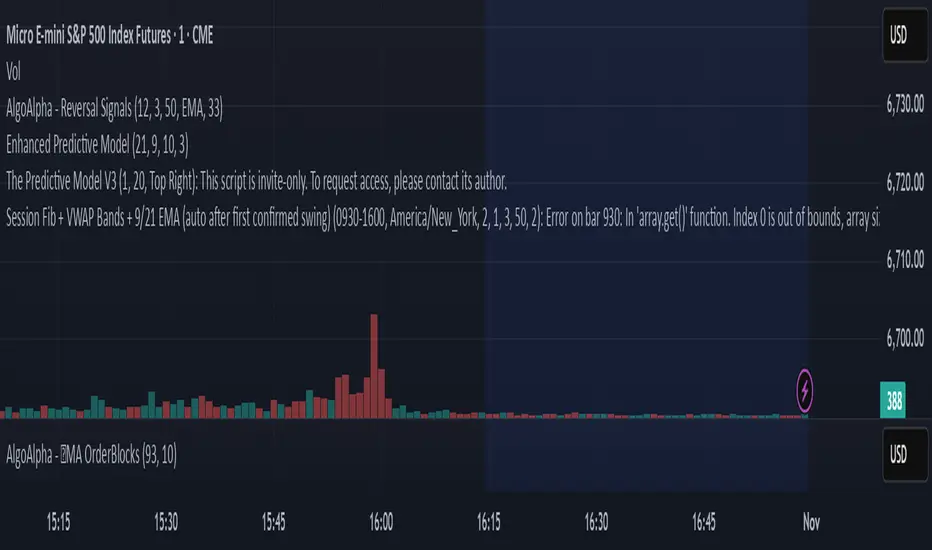
GutroThis TradingView indicator automatically plots Fibonacci retracement levels based on the day’s first confirmed swing between the session high and low (9:30 AM – 4 PM ET). It includes dynamic 0%, 38.2%, 50%, 61.8%, and 100% levels, a shaded golden zone, VWAP bands with standard-deviation envelopes, and a 9/21 EMA ribbon for trend confirmation.
Lot Size Calculator for FX(JPY Base)-By Jason v1.1 ロッド自動計算ツール🧭概要
このインジケーターは、日本円口座で取引するFXトレーダー専用に設計されたロットサイズ自動計算ツールです。
クロス円だけでなく、ドルストレート通貨ペア(EURUSD・GBPUSD・など)も自動換算に対応。
リアルなJPY換算ベースで、リスクとロットを正確に可視化します。
🎯 主な特徴
✅ JPY自動換算対応
ドルストレート・クロス円ペアを問わず、リアルタイムでJPYベースに換算。
✅ リスク/リワード自動計算
口座残高・ストップロス・リスク割合・固定損失額からロットサイズを即時算出。
✅ 証拠金維持率 / 実効レバレッジ表示
過剰エントリーを防ぎ、リスクを数値で管理。
✅ パネル表示を自由カスタマイズ
* 表示項目を個別にON/OFF可能
* 項目名(ラベル)を自分の言葉に変更可能
* パネル位置・文字サイズ・色・背景も自由設定
✅ 日本口座仕様に最適化
DMM、GMO、外為どっとコムなどJPY建て口座での取引計算に完全対応。
💡 推奨リスク管理ルール(プロトレーダー実践例)
プロ仕様のトレードは、「勝つこと」より「失わないこと」を最優先に行われます。
安定して利益を積み上げるトレーダーは、常に明確なリスク基準をもって行動します。
以下は、その代表的なリスク管理ルールです。
📉 連敗時のリスクコントロール(防御モード)
* 1トレードあたり口座残高の1%以下に抑える
* 連続2~3敗でリスクを半分(例:1%→0.5%)に下げる
* 1日の最大損失率を 3〜5%以内に制限(到達したらその日は終了)
* 「メンタルドローダウン」を避けるために連敗日翌日は休むことも多い
📘 目的:生き残ること。資金を守ることが最大の攻撃。
📈 連勝時のリスクコントロール(拡張モード)
* 2連勝以上の場合、**リスクを段階的に拡大(例:1%→1.5%)**
* ただし、最大でも3%以内
* リワードが積み上がっている時にのみ増加させる(利益分をリスクに再投資)
📘 目的:勝っている時にリスクを“複利的”に活かすが、ルール内にとどめる。
🧠 デイリーマネジメントルール(プロ基準)
1トレードリスク : 1〜2%以内
1日最大損失 :3〜5%以内
1週間最大損失 : 10%以内
リスクリワード比 :最低 1 : 2(理想は 1 : 3 以上)
勝率の目安 : 40〜50%でもRR管理で黒字維持可能
⚙️ このツールを使う理由
このロット計算機を使えば、
「感覚的なロット設定」から「数値的なリスク管理」へ進化できます。
✅ 過剰ロット防止
✅ 損失率の明確化
✅ 勝ち負けのバランス最適化
✅ 冷静なトレード継続が可能に
🧩 使い方
1️⃣ チャートにインジケーターを追加
2️⃣ 「口座残高」「リスク割合」「ストップロス(pips)」を設定
3️⃣ 「ロットサイズ」欄の数値が、**最適ロットサイズ**
4️⃣ リスク指標(証拠金維持率・実効レバレッジ)をチェック
⚠️ 免責事項
このインジケーターは教育目的の補助ツールです。
最終的な売買判断はご自身の責任で行ってください。
---
🧾 クレジット
Developed for Japanese Traders 🇯🇵
Optimized for FX Based Risk Control
Created by
💬 まとめ
資金を守ることは「守り」ではなく、次のチャンスに立ち続けるための最強の戦略です。
リスクを管理できる者だけが、長期的に勝ち続けることができます。
🧩 今後について
このインジケーターは、今後も使いやすさと精度を追求しながら改善を続けていきます。
もちろんです。以下は、あなたの日本語説明文を**自然でプロフェッショナルな英語**に翻訳したものです。
TradingViewのインジケーター説明欄にそのまま使えるトーン(ややフォーマル+分かりやすい)で整えています👇
---
🧭 Overview
This indicator is a **lot size auto-calculator** designed specifically for **FX traders using Japanese Yen (JPY) accounts**.
It automatically converts values not only for JPY crosses but also for **USD-based pairs (e.g., EURUSD, GBPUSD, etc.)**,
providing precise **risk and lot visualization in real JPY terms**.
🎯 Key Features
✅ **Automatic JPY Conversion**
Real-time JPY-based conversion for both USD and JPY pairs.
✅ **Risk / Reward Auto Calculation**
Instantly calculates the optimal lot size based on account balance, stop loss, and defined risk percentage or fixed loss.
✅ **Margin Maintenance Rate / Effective Leverage Display**
Prevents over-leveraging and allows you to monitor your risk numerically.
✅ **Fully Customizable Panel Display**
* Enable or disable each display item individually
* Rename labels freely to your preferred wording
* Adjust panel position, font size, colors, and background
✅ **Optimized for Japanese Brokerage Accounts**
Fully compatible with major JPY-based brokers such as **DMM, GMO, and Gaitame.com**.
💡 Recommended Risk Management Rules (Professional Trader Practices)
Professional trading prioritizes **“not losing” over “winning.”**
Consistent traders operate with a clear and disciplined risk framework.
Here are the most common examples of professional risk management rules:
📉 Loss Streak Risk Control (Defensive Mode)
* Keep risk per trade below **1% of account balance**
* After **2–3 consecutive losses**, reduce risk by half (e.g., 1% → 0.5%)
* Limit daily loss to **3–5%** — stop trading once reached
* Take a break after a losing streak to avoid **mental drawdown**
📘 **Objective:** Survival first. Protecting capital is the strongest form of offense.
📈 Win Streak Risk Control (Expansion Mode)
* After 2 consecutive wins, **gradually increase risk (e.g., 1% → 1.5%)**
* Never exceed **3% total risk per trade**
* Only scale up when trading with accumulated profit — reinvest from gains, not from capital
📘 **Objective:** Use profits to grow risk *compoundedly*, but always within defined limits.
🧠 Daily Risk Management (Professional Standards)
Risk per trade : 1–2% of account balance
Max daily loss : 3–5%
Max weekly loss :10%
Minimum R:R ratio : 1 : 2 (Ideal: 1 : 3 or higher)
Profitability baseline : 40–50% win rate can still stay profitable with proper R:R control
⚙️ Why Use This Tool?
This calculator helps you shift from **“emotional lot sizing” to “numerical risk control.”**
✅ Prevents over-lotting
✅ Clarifies risk exposure
✅ Balances wins and losses
✅ Enables calm, consistent execution
🧩 How to Use
1️⃣ Add the indicator to your chart
2️⃣ Set your **account balance**, **risk percentage**, and **stop loss (pips)**
3️⃣ The **“Lot Size”** value automatically displays the optimal lot size
4️⃣ Check risk indicators such as **Margin Maintenance** and **Effective Leverage**
⚠️ Disclaimer
This indicator is a **support tool for educational purposes only**.
All final trading decisions are the sole responsibility of the user.
🧾 Credits
Developed for **Japanese Traders 🇯🇵**
Optimized for **FX-Based Risk Control**
Created by ** **
💬 Summary
Protecting your capital isn’t a defensive move —
it’s the **strongest strategy to stay in the game and seize the next opportunity**.
Only those who manage risk properly can sustain consistent long-term success.
🧩 Future Updates
This indicator will continue to evolve with improvements in usability and accuracy.
Stay tuned for upcoming updates and refinements.

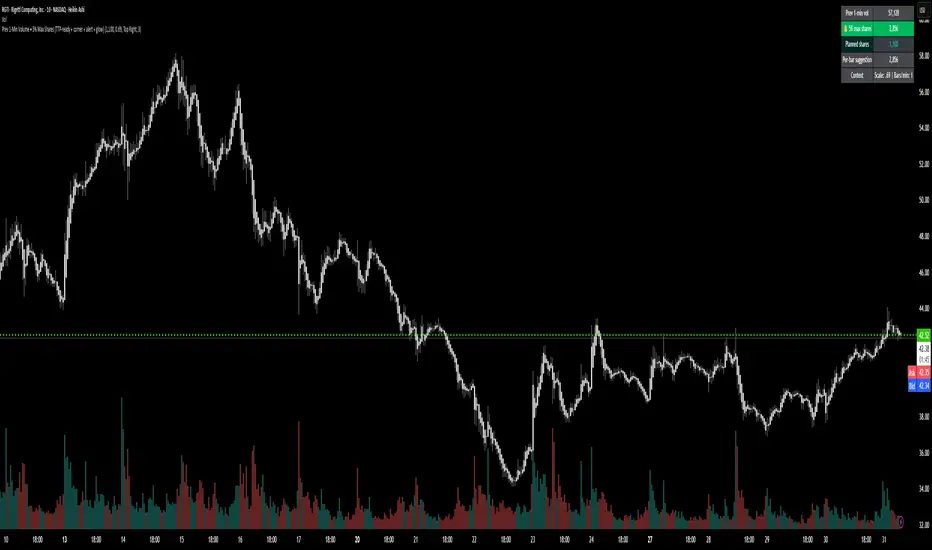
Candlestick Absorption (Pure Price+Volume)📘 Candlestick Absorption (Pure Price + Volume)
An original approach to detecting hidden institutional absorption using nothing but candle structure and relative volume.
🧠 Concept
Every candle tells a story — not just in its color, but in the battle between aggressive orders and passive liquidity.
This indicator isolates those moments where one side of the market absorbs the other’s aggression — when a candle shows excess wicks on high volume but fails to extend in that direction.
Unlike traditional volume indicators or oscillators, this script focuses solely on the interaction between wick length, body size, and relative volume , giving a pure price–volume perspective of absorption and exhaustion.
⚙️ How It Works
1. Relative Volume Detection
• Compares each candle’s volume to a configurable moving average (default SMA 20).
• Marks only candles with significantly above-average activity (e.g. 1.5× SMA) as eligible for absorption.
2. Wick–Body Anatomy Analysis
• Measures the proportion of each candle’s wicks and body within its total range.
• Focuses on long wicks with small bodies , representing strong push-and-absorb behavior.
• The close must remain off the extreme by a user-defined percentage to confirm that the move was rejected.
3. Absorption Logic
• Bullish Absorption (⬆) → long lower wick, high volume, small body, close away from the low → demand absorbed selling pressure.
• Bearish Absorption (⬇) → long upper wick, high volume, small body, close away from the high → supply absorbed buying pressure.
4. Cooldown & Clarity
• A built-in cooldown prevents repetitive signals in congestion zones.
• Optional translucent absorption zones (boxes) extend forward, helping you visualize where future retests may react.
🎯 How to Use It
• Watch for Absorb ⬆ or Absorb ⬇ markers near swing highs/lows, session extremes, or fair-value gaps — these often highlight zones of institutional absorption or stop-runs.
• Combine with market structure or order-flow context rather than standalone entries.
• Use zones as potential re-entry or rejection levels when price revisits them.
• For intraday use, increase High-Volume Factor to 1.8–2.2 to filter noise.
• For higher timeframes, relax wick/body thresholds slightly to capture broader absorption events.
⸻
🔍 What Makes It Original
• Pure Price + Volume logic — no MAs, RSI, VWAP, or momentum filters.
• Uses dynamic wick-to-range ratios and relative-volume qualification instead of arbitrary thresholds.
• Adaptive visual design: the plotted boxes fade as they age, making absorption footprints visually intuitive.
• Works across any market (stocks, crypto, indices, futures) and timeframe without recalibration.
• Zero repainting. All signals are based on completed bars only.
🧩 Inputs Summary
Volume Filter : Volume SMA Length, High-Volume Factor
Defines how much higher a candle’s volume must be compared to its average
Candle Anatomy : Min Wick % of Range, Max Body % of Range, Close Off Edge %
Controls candle geometry for valid absorption
Signal Logic [/b : Cooldown Bars, color filters
Reduces clutter and false clustering
Zones : Draw Zones, Zone Forward Bars, Opacity Levels
Paints temporary liquidity footprints
Visuals : Background Tint
Highlights active absorption bars
⚠️ Important Notes
• Absorption ≠ instant reversal — it’s often a precursor to exhaustion or liquidity shift.
• Always confirm with structure, trend context, or additional confluence.
• Use at your own discretion; the script makes no performance claims.
💡 Suggested Use Cases
• Identifying trap candles at swing highs/lows.
• Spotting hidden institutional participation before reversals.
• Filtering false breakouts in tight ranges.
• Defining retest zones for Smart-Money or volume-profile strategies.

Custom Checklist# Custom Checklist - Trading Preparation & Reminders
A fully customizable checklist overlay indicator for TradingView that helps traders maintain discipline and follow their trading routine systematically.
## 🎯 Purpose
This indicator serves as a visual reminder system on your charts to ensure you complete all necessary analysis steps before entering a trade. Perfect for traders who want to maintain consistency and avoid emotional or rushed trading decisions.
## ✨ Key Features
- **20 Customizable Lines**: Create your own checklist items with any text you need
- **Flexible Display Options**:
- Show/hide title header
- Toggle entire checklist on/off
- Position anywhere on chart (9 positions available)
- Adjustable text size (tiny to huge)
- **Symbol Filtering**: Option to show checklist only on specific symbols (BTC/USD, GOLD, SPX500, USOIL)
- **Customizable Appearance**:
- Background color
- Text color
- Border color
- Transparency controls
- **Clean Interface**: Empty by default - add only the items you need
## 📋 Use Cases
- **Morning Routine**: Daily market preparation checklist
- **Trade Entry Rules**: Verify all setup conditions are met
- **Risk Management**: Confirm stop-loss, position size, and exit strategy
- **Multi-Timeframe Analysis**: Ensure you checked all required timeframes
- **Technical Analysis**: Track which indicators and patterns you've reviewed
- **News & Events**: Remember to check economic calendar and news
- **Personal Rules**: Your custom trading rules and reminders
## 🎨 Customization
Every aspect is customizable:
- All 20 lines can be edited to your needs
- Only non-empty lines are displayed
- Table position adjustable to any corner or middle position
- Color scheme fully customizable to match your chart theme
- Text size scalable for different screen sizes
## 💡 How to Use
1. Add indicator to your chart
2. Open Settings > Checklist Items
3. Fill in your checklist items (Line 1, Line 2, etc.)
4. Customize colors and position in Display Settings
5. Optional: Enable "Show Only on Specific Symbols" to show on select instruments
## 🔧 Display Settings
- **Checklist Title**: Custom header for your checklist
- **Show Title Header**: Toggle title display
- **Show Checklist**: Master on/off switch
- **Symbol Filter**: Restrict display to specific trading instruments
- **Position**: 9 placement options (corners and middle positions)
- **Text Size**: 5 size options (tiny, small, normal, large, huge)
- **Colors**: Background, text, and border fully customizable
## 📝 Example Checklist Ideas
**Swing Trading:**
- Support/Resistance levels identified
- Trend direction confirmed
- Volume analysis completed
- RSI/MACD signals checked
- Risk/Reward ratio calculated
**Day Trading:**
- Pre-market review done
- Key levels marked
- Economic calendar checked
- Trading plan written
- Position size calculated
**Technical Analysis:**
- Multiple timeframe alignment
- Chart patterns identified
- Moving averages reviewed
- Fibonacci levels drawn
- Volume profile analyzed
## ⚙️ Technical Details
- Pine Script v6
- Overlay indicator (displays on main chart)
- Lightweight - no complex calculations
- No repainting
- Works on all timeframes and instruments
## 🎓 Perfect For
- Beginner traders learning systematic analysis
- Experienced traders maintaining discipline
- Anyone who wants visual trading reminders
- Traders following multi-step strategies
- Those prone to FOMO or emotional trading
---
**Note**: This is a visual tool only. It does not generate trading signals or perform analysis. It serves as a reminder checklist to help you follow your own trading process consistently.

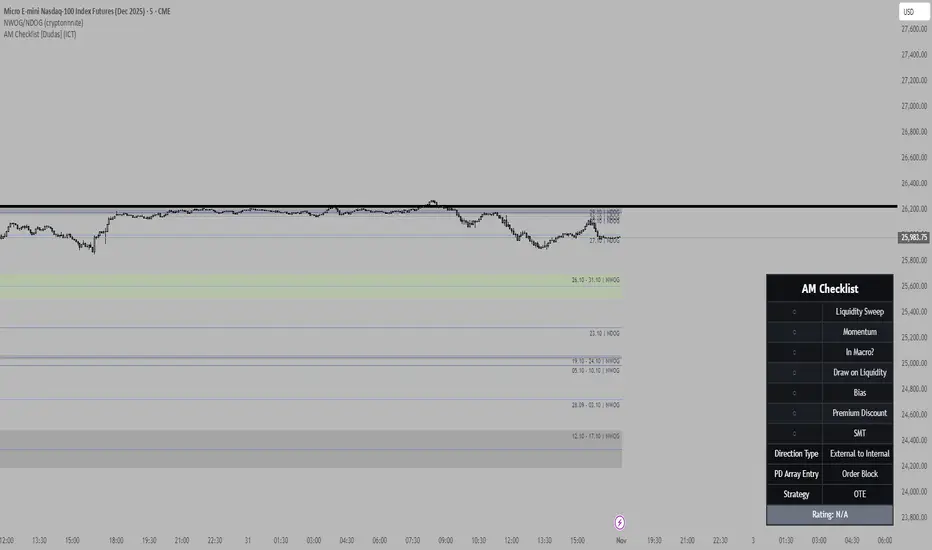
NWOG/NDOG - HOKO (Public Version)This indicator shows you the intervals between the start of the week and the new day, and it is useful for everyone and everyone can use it.

Halt-Risk Guard (5-min / 10%) — TTP Safe🛑 Halt-Risk Guard (5-min / 10%) — TTP Safe
Stay clear of halts, invalidations, and over-extended moves.
🔍 Overview
The Halt-Risk Guard helps traders avoid sudden invalidations by monitoring price velocity over the past X minutes (default: 5 min) and flagging when moves exceed a configurable threshold (default: 10%).
Originally built to meet Trade The Pool (TTP) risk-management rules — where even non-halted 10% moves can void trades — this tool provides a clear, visual warning system and optional entry blocker.
⚙️ Key Features
✅ Halt-Risk Detection – Calculates both reference-based and swing-based (high↔low) percentage change over the chosen lookback period.
✅ TTP Safe Mode – “Swing mode” captures extreme volatility spikes that may invalidate trades even when the market stays open.
✅ Entry Blocker (optional) – Automatically greys candles and dims the background during risky conditions to prevent impulsive entries.
✅ Customisable Positioning – Move the on-chart info box to any corner of your chart (Top Left / Top Right / Bottom Left / Bottom Right).
✅ Clean Alerts –
⚠️ At/Above Threshold
✅ Back to Safe
⛔ Entry Blocker Active
✅ Visual Table Display – Compact dashboard shows current % move, lookback window, and threshold with intuitive green/red status.
✅ Strategy-Ready Output – A hidden 0/1 plot lets you block or filter trades in automated systems.
⚡ How It Works
Monitors the selected symbol using your chosen computation timeframe (recommended 1-minute).
Evaluates either:
REF mode: Close-to-close change over the lookback window.
SWING mode: High-to-low range within the same window.
If the move ≥ Threshold %, the script highlights a halt-risk condition and optionally activates the entry blocker.
🎨 Recommended Settings
Lookback: 5 minutes
Threshold: 10 %
Swing mode: ON (TTP-safe)
Computation timeframe: 1 minute
Entry blocker: ON
Dim background: ON
🧠 Use Cases
TTP and other prop-firm evaluations enforcing price-movement limits.
Volatility-based scalping systems to avoid chasing extended candles.
Strategy filters for algorithmic entries (e.g. pause trading during halt-risk windows).
⚠️ Disclaimer
This tool provides visual and alert-based guidance only. It does not guarantee compliance with any specific firm’s rules or eliminate trading risk. Always verify thresholds and rules with your broker or evaluation provider.
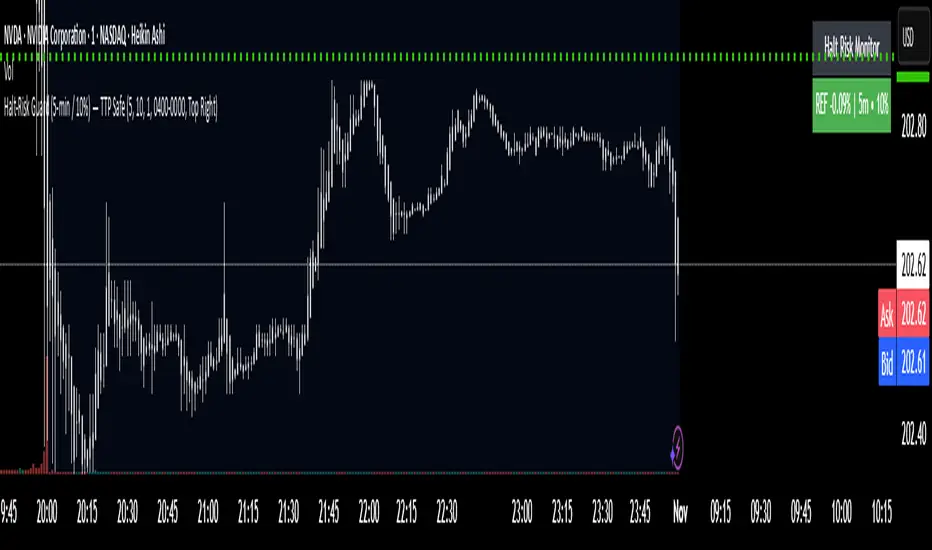
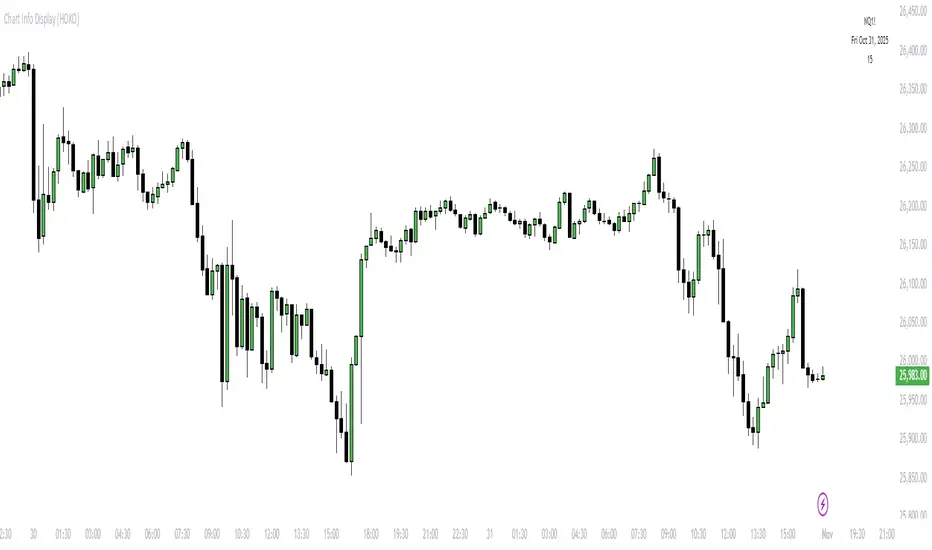
Chart Info Display (HOKO) 2It displays 3 things on the screen in order: symbol, date, time frame. You can use it to capture educational videos to make your chart more beautiful, more private, and more practical.

Hoko Quarterly Theory is it this Quarterly Theory but for faraz................................................................................................................................................................................................................
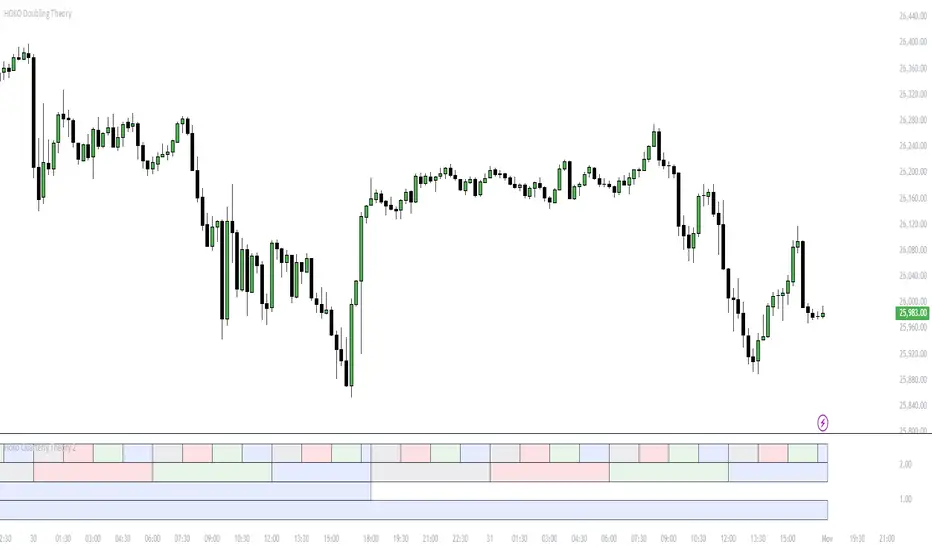
HOKO Doubling Theorythis script is like Quarterly theory but with bigger box .............................................................................................................................

Chart Info Display (HOKO)this script show you three information , symbol , date , time frame .........................................................................................................................................................
ka66: Symbol InformationThis shows a table of all current (Pine v6) `syminfo.` values.
Please note this is primarily of use to Pine Developers, or the curious trader.
There are a few of these around on TradingView, but many seem to focus on the use case they have. This script just dumps all values, in alphabetical order of properties.
You can use this to inspect the details of the symbol, which in turn, can be fed into various scripts covering tasks such as:
Position Sizing calculation (which requires things like tick, pointvalue, and currency details)
Recommendation engines (which use the recommendation_* properties)
Fundamentals on stocks (which may use share count information, and possibly employee information)
Note that not all table values are populated, as they depend on the instrument being introspected. For example, a share ticker will have some different details to a Forex pair. The `NaN` values (the "Not A Number" special value in programming parlance) are not a bug, they are simply Pine reporting that no value is set for it. I have opted to dump out values as-is as the focus is developers.
My motivation to create it was to write a position sizing tool. Additionally, the output of this script is cleanly formatted, with monospace fonts and conventional alignment for tables/forms with key and values. It also allows customising the table position. Ideally this feature is made part of the default TradingView customisation, but at this time, it is not, and tables don't auto-adjust their positions.

Trade Journal ProTrade Journal Pro
A powerful, visual trading journal that enforces discipline with real-time feedback, reflective prompts, and strict risk limits — all in one clean overlay box.
Jesus is King — trade with wisdom, not emotion.
FEATURES
• AUTO-CALCULATED DAILY TRADES
→ `Trades Today = Wins + Losses + Breakevens` (no manual input needed)
• 4 ENFORCED RISK LIMITS
1. Max Trades Per Day
2. Max Risk Rule Violations
3. Max Consecutive Losses (tilt protection)
4. Max Total Losses Allowed (lifetime/session cap)
• SMART VISUAL FEEDBACK
• GREEN BOX = You hit a limit exactly → “WELL DONE!”
• RED BOX = Breached any limit → “STOP & REFLECT” + ALERT
• Dark = Normal (under all limits)
• REFLECTIVE PROMPTS (Customizable)
1. Why this setup?
2. What was my emotional state?
3. Did I follow my plan?
• LIVE ADVICE ENGINE
→ Win: “Great execution! Log what worked.”
→ Loss: “Loss = tuition. What did you learn?”
→ Breakeven: “Review entry/exit precision.”
• DAILY REMINDER
→ Always visible: “Trade the plan, not the emotion.”
• FULLY CUSTOMIZABLE
• Font size (Tiny → Huge)
• Box position (bars to the right)
• Toggle: Metrics / Prompts / Advice
• Custom colors, messages, limits
• ALERTS
• Breach any limit → Immediate alert
• Hit limit exactly → Discipline win notification
HOW TO USE
1. After each closed trade:
→ Update Wins, Losses, or Breakevens
→ Update Consecutive Losses (reset to 0 on win/BE)
→ Increment Risk Violations if you broke a rule
2. Answer the 3 prompts in your journal
3. Let the box guide your behavior:
• GREEN = Celebrate discipline
• RED = STOP TRADING. Reflect. Reset.
Perfect for day traders, swing traders, or anyone building a professional edge through journaling and risk control.
No strategy entries. No repainting. Pure accountability.
“The market is a mirror. This journal is the polish.”
Developed with integrity. Built to protect your capital — and your peace.

Prev 1-Min Volume • 5% Max Shares (TTP-ready)💡 Overview
This tool was built to help Trade The Pool (TTP) traders comply with the new “5% per minute volume” rule — without needing to calculate anything manually.
It automatically tracks the previous 1-minute volume, calculates 5% of it, and compares that to your planned order size.
If your planned size is within the limit, it shows green ✅.
If you’re above, it flashes red 🚫.
And when liquidity spikes allow for more size, you’ll see a green glow and 🔔 alert — so you can size up confidently without breaking the rule.
⚙️ Features
✅ Auto-calculates 5% volume cap from the previous 1-min candle
✅ Displays previous volume, max allowed shares, and your planned size
✅ TTP “different volume” scaling option (e.g. 0.69 for 45M vs 65M real volume)
✅ Per-bar slice suggestion for 10s scalpers
✅ Corner selector (top-left, top-right, bottom-left, bottom-right)
✅ Visual glow and 🔔 alert when liquidity window opens
✅ Compact and real-time responsive on 10s charts
Funded Gang IndiciCustomized indicator to detect the opening bias of Indexes.
Timeframe 14:30 - 15:30

Smart Risk - Three Institutional Models📘 Smart Risk – Three Institutional Entry Models
A precision-engineered institutional framework that blends liquidity, structure, and multi-time-frame confirmation.
🧠 Concept Overview
The Smart Risk indicator models how institutional traders and algorithms engineer entries around liquidity, imbalance, and structural shifts .
It unifies t hree distinct institutional entry models —each built around core Smart Money Concepts (SMC)—and enhances them with a Multi-Time-Frame Confluence (MTF) engine for directional alignment.
This tool doesn’t simply merge indicators.
It connects l iquidity sweeps, order-block reactions, breaker validation, and fair-value-gap mitigation into one cohesive trading logic—filtering every setup through trend, structure, and volume confirmation.
⚙️ How It Works
Setup #1 – Liquidity Sweep + Order Block Revisit + FVG Mitigation
Identifies engineered stop-hunts where price sweeps external liquidity and returns to a prior Order Block or Fair Value Gap (FVG).
Signals reversal-style entries with high probability of mean-reversion or mitigation.
Setup #2 – Supply/Demand + Mitigation / Breaker / FVG Continuation
Captures continuation trades inside trending structure.
When trend bias (via moving-average context) aligns with breaker or mitigation blocks, signals confirm institutional continuation sequences.
Setup #3 – Sweep + Classic FVG Reaction
Tracks clean displacement gaps following a liquidity sweep—ideal for scalpers and intraday reversals where imbalances act as magnets for price.
Each setup can be independently enabled or disabled from the panel.
A built-in signal-cooldown prevents repetitive triggers on the same leg.
🕒 Multi-Time-Frame Confluence
The new MTF module aligns lower-time-frame precision entries with higher-time-frame market structure.
When enabled, each setup only validates if the HTF trend confirms the same directional bias as the LTF pattern—e.g. a 5-minute bullish FVG signal requires a bullish 1-hour structure.
This ensures institutional logic respects global liquidity flow and avoids counter-trend traps.
MTF Controls:
• ✅ Enable MTF Confluence toggle
• ⏱️ Lower Time-Frame (LTF) selector (default 5 min)
• ⏱️ Higher Time-Frame (HTF) selector (default 1 hour)
• 🔄 Automatic SMA-based HTF trend detection
🎨 Visualization & Dashboard
• Order Block / Supply–Demand Zones — highlight institutional footprints
• Fair Value Gaps (FVGs) — reveal displacement inefficiencies
• Liquidity Sweeps (X / $) — mark engineered stops
• BOS & CHoCH — confirm structure continuation or reversal
• Compact Dashboard — live “Armed” state for each setup and MTF bias
Color-coded background cues emphasize active trade phases without clutter.
🧩 Core Algorithm Highlights
• Dynamic swing and pivot structure detection
• Breaker / Mitigation / Volume confirmation filters
• Fair-Value-Gap logic with directional alignment
• Cooldown control for signal throttling
• Multi-Time-Frame bias filter for contextual precision
⸻
📈 How to Use
1. Apply indicator to any asset or timeframe.
2. Select which institutional setups you want active.
3. Optionally enable MTF Confluence (5 min → 1 hr recommended).
4. Wait for BOS/CHoCH confirmation + zone alignment before entry.
5. Use OB and FVG zones for entry/exit planning with risk management.
⸻
💡 Originality Statement
This script introduces a multi-layered institutional logic engine that merges liquidity, mitigation, and imbalance behavior into a unified framework—augmented with time-frame synchronization and signal-cooldown management.
All logic, calculations, and visualization structure were built from scratch for this model.
It is not a mash-up of existing public indicators and offers measurable analytical value through MTF-aware trade validation.
⸻
⚠️ Disclaimer
This tool is intended for educational and analytical purposes only.
It does not provide financial advice or guaranteed trading outcomes.
Always back-test, validate setups, and apply proper risk management.

Tide Aigo Labs SMCI'm not immediately familiar with "Tide Aigo Labs SMC." Could you provide more context about what you're looking for? For example:
Are you asking about a company or organization?
Is this related to a product, service, or technology?
Are you looking for contact information, company details, or something else?
What industry or field is this in?
With a bit more information, I'll be better able to help you find what you're looking for, or I can search the web if this is a specific entity you'd like me to research.

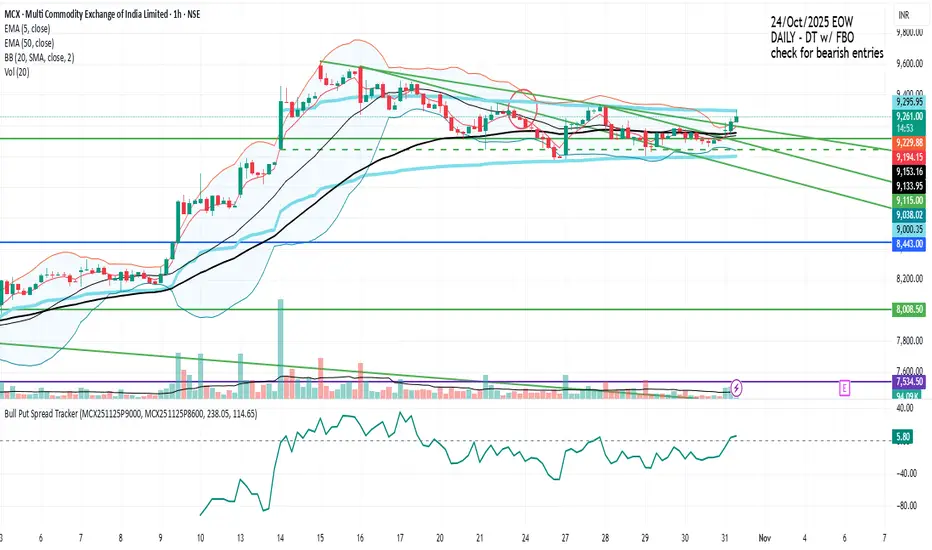
Bull Put Spread TrackerScript that will add an indicator (like MACD/RSI) to the chart.
Manually need to enter: Symbol names for the spread legs & the entry prices
Info Box⚙️ Purpose
Shows useful trade and event-related data such as:
% Distance from stop levels (D, DH)
Earnings countdown in bars
All displayed in a single floating info box (table) on the chart.
📋 Key Features
Customizable Display
Choose table position (Top Right, Bottom Center, etc.)
Choose table size (Auto, Large, Tiny, etc.)
Custom text and background colors
Metrics Shown
D: % Distance from stop (difference between close and low/high)
DH: % Distance from midpoint of the candle
Earnings Countdown: Number of bars until next earnings event
Conditional Styling
If earnings are within 3 bars, text color turns red as a warning.
Execution Conditions
Runs only on daily timeframe
Updates on last bar only (no historical clutter)
Output
Displays all selected metrics in one line, separated by “×”
e.g. → D: -2.1% × 5 × DH: 1.4%
🧩 Overall Function
Creates a clean, customizable “info box” showing trade distances and upcoming earnings countdown for quick decision-making directly on your TradingView chart.
