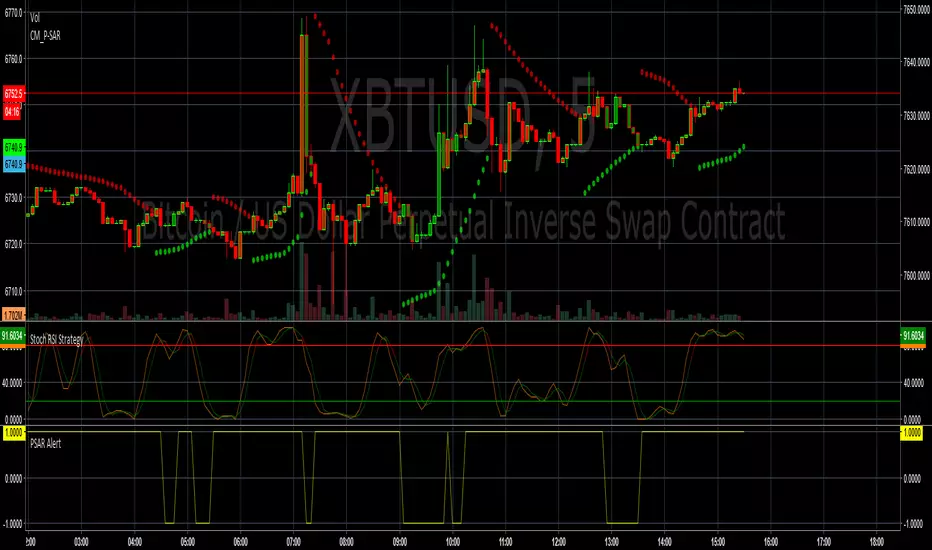
PSAR + SRSI AlertBUY- Will Buy If PSAR is green.
SELL- Will Sell if PSAR is red OR SRSI becomes overbought.
PM for Use.
Stop dan Berbalik Parabolik / Parabolic Stop and Reverse (PSAR)
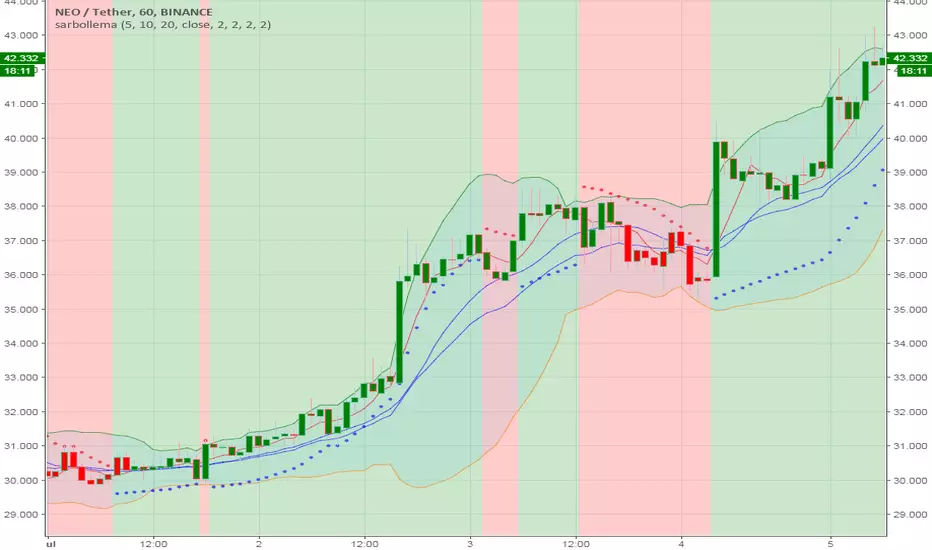
sarbollemav1same as the older version just added support and resistance level to make life more easy
alerts inside for 2 buy points =sar cross and the other based on ema over ma


sarbollemaThere is two buy points one based on ema cross MA= long short alert
sar up or down= long1 short1
color change by change of sar
and bollinger to have fun
PSARbackgroundThis is a visual representation of the 'Parabolic SAR' indicator through the color of the background.
이 지표는 배경 색을 통해 PSAR 지표를 시각적으로 나타낸 것입니다.
For access, please press the button"agree" and leave a comment below.
사용권한을 원하시는분은 밑에 "동의" 버튼을 눌러주시고 아래 코멘트에 글을 남겨주세요

PSARbackground
This is a visual representation of the 'Parabolic SAR' indicator through the color of the background.
이 지표는 배경 색을 통해 PSAR 지표를 시각적으로 나타낸 것입니다.
How to get invited? => link ↓

Double Bands, 3MA and 2SARMoving Averages (5,20,50), Double BollHello
Made an indicator set that includes
Moving Averages 5EMA, 20EMA, 50SMA, 200SMA
Fill between 5-20 MA and 20-50MA
Double Bollinger Bands
Parabolic SAR x2
Multiple indicators for the cost of 1
Shinkansen SAR ScalperRed = Last 8 Candle Support
Green = Last 8 Candle Resistant
Blue line is Parabolic SAR
I'm glad if you happy to using this indicator and take more profit from scalp :D

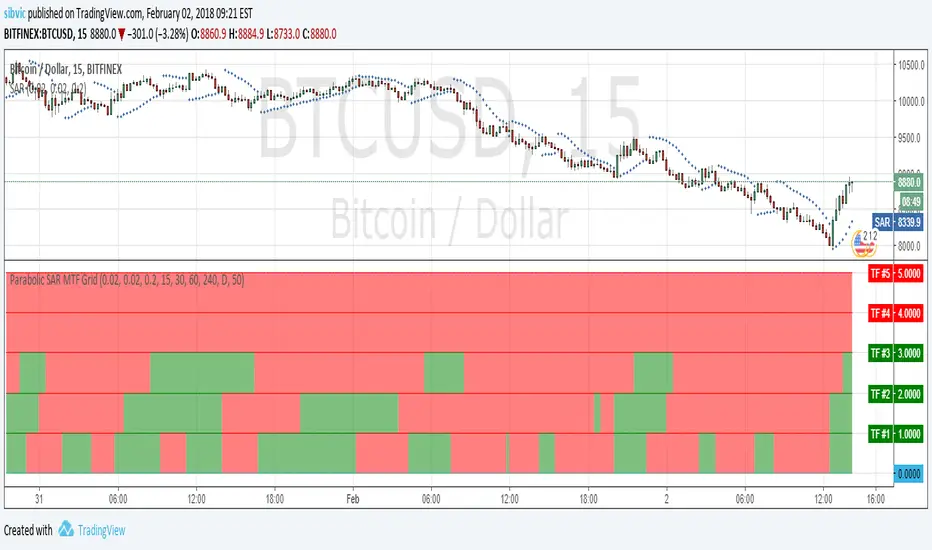
Parabolic SAR MTF GridShow a grid with Parabolic SAR in 5 timeframes. Shows an alert when the Parabolic SAR show the same direction for all 5 timeframes.
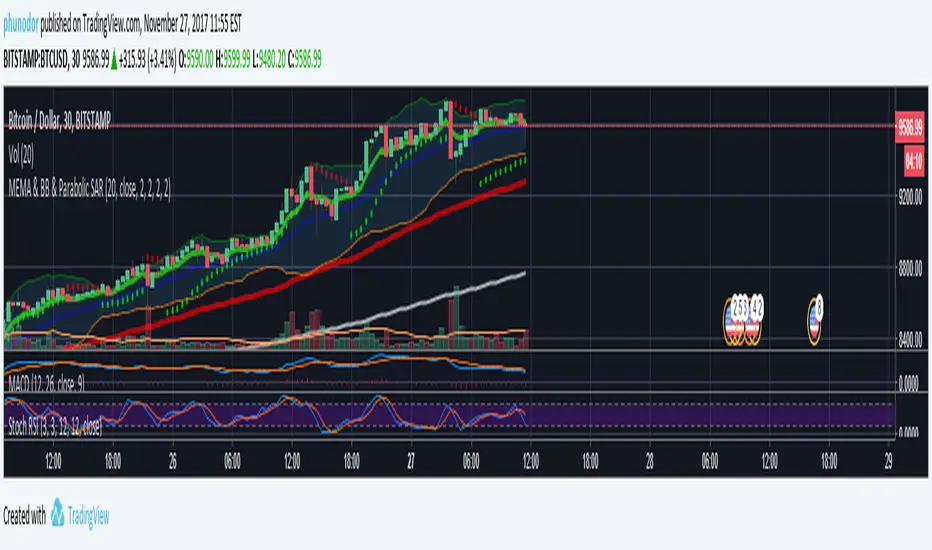
MEMA & BB & Parabolic SARMultiple Exponential Moving Average : 7, 77, 231
Bollinger Bands
Parabolic SAR
Crypto-Adjusted Parabolic Stop and Reverse (CAPSAR)Finally, a more accurate PSAR is here!
This PSAR will show up , and stick around when a majority of the Crypto-Currencies in the index below conform in the same direction.
The CAPSAR can be applied to any Crypto-currency and ANY time-frame!
This Crypto-Index makes up over 90% of the Crypto-Currency market cap (total global Crypto investment).
Bitcoin
Ethereum
Bitcoin Cash
Ripple
Litecoin
Nemcoin
Thick Blue lines beneath the price indicate a change in direction, and momentum up.
Thick Red lines above the price indicate a change in direction, and momentum down.
This indicators holds three editable parameters:
1. "Start" - The starting value for the Acceleration Factor (.02 is the Default).
2. "Increment" = The increment in which the Acceleration Factor will move (.02 is Default).
3. "Max" - The maximum value of the Acceleration Factor (.20 is the Default)

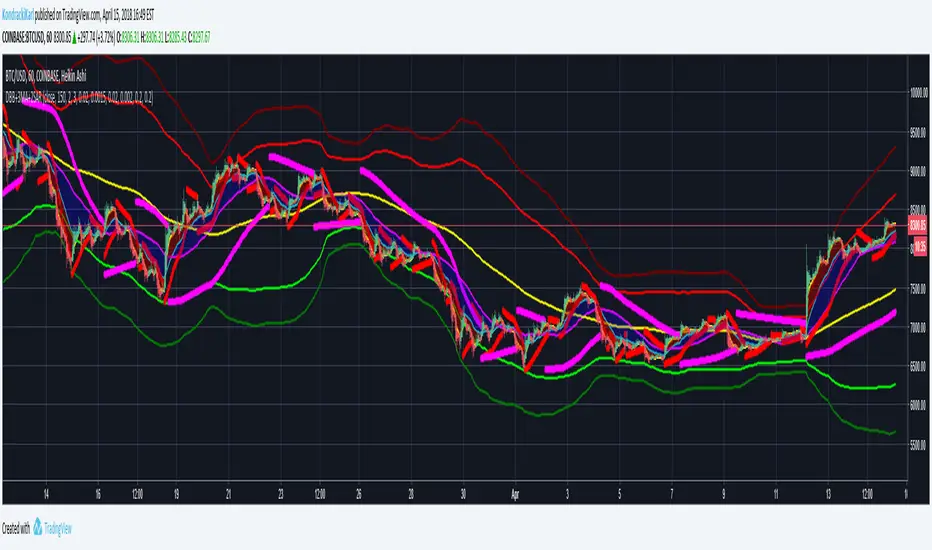
Magic Circles V3Magic Circles indicator uses an ATR based trend indicator in conjunction with a Parabolic SAR indicator for creating signals. Blue is neutral. Green is buy and red is sell. A hollow green circle followed by a regular green indicates a strong buy while a hollow red circle followed by a regular red one indicates a strong sell signal. This version gives you the option to choose your own magic number. Default is 1.618 also known as the golden ratio. The indicator works best at trending markets.
Version 3 comes with ADX filtering to avoid misleading signals and set on by default. Also you can now see the support / resistance levels. Another option added is showing the current trend direction.
ADX is Average Directional Index and founded by Welles Wilder. Wilder published his work in his book titled New Concepts in Technical Trading Systems (1978).

Magic Circles V2Thanks for your feedback in regard to the Magic Circles indicator. As a common question, Magic Circles indicator uses an ATR based trend indicator in conjunction with a Parabolic SAR indicator for creating signals. Blue is neutral. Green is buy and red is sell. A hollow green circle followed by a regular green indicates a strong buy while a hollow red circle followed by a regular red one indicates a strong sell signal. This version gives you the option to choose your own magic number. Default is 1.618 also known as the golden ratio. The indicator works best at trending markets.

SMACH Indicator v1.0SMACH Indicator uses 3 signals from MACD, STOCHASTIC and PARABOLIC SAR.
Histogram represents trend direction. If it is greater than 2 or lesser than -2 trend is consolidated and you can trade.
I'm the author of this simple indicator. Feel free to use it as you want.
Follow me on Trading View if you want to be updated on more ideas. Thanks!

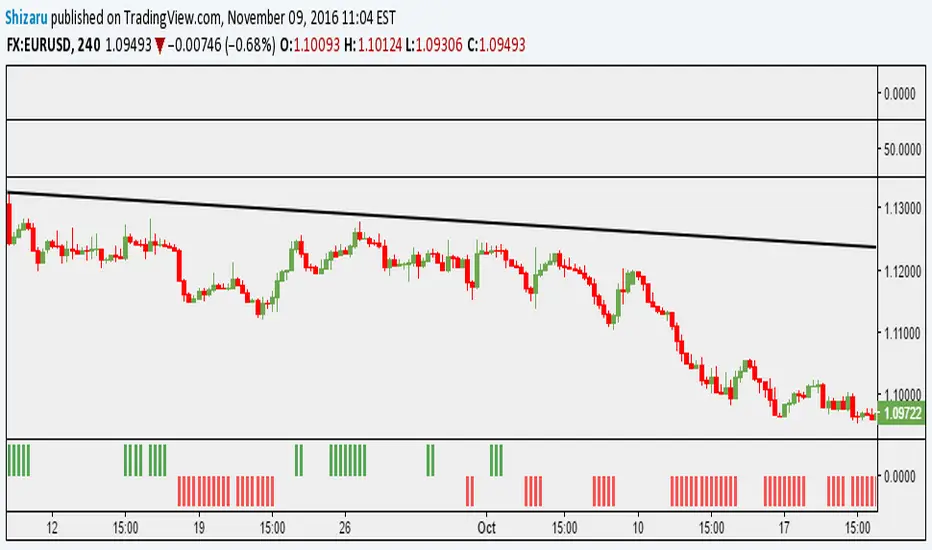
Simple Buy/Sell IndicatorThe original script was posted on ProRealCode by user Doctrading.
This little and simple code allows you to draw an indicator, which show you when buy or sell conditions are met.
For "buy" conditions, I did just set :
close > MM200
close > Parabolic SAR
MACD > 0
RSI7 > 50
For "sell" conditions : the opposite.
Of course, you can set what you want, in order to test your strategies.
Of course, to be profitable, you must also set your trading rules (entry, stop loss, trailing stop, take profit, etc.)
It's only an indicator, which doesn't show entry or exit rules.
Parabolic GlitterThis indicator overlays a series of Parabolic Stop And Reverses (SARs) to continuously illustrate trends as they form in addition to a range of good possible levels at which to place stop orders.
The Initial Start argument gives the minimum value for the SAR function's "Start" argument. The Increment/Start Ratio argument gives the ratio of the SAR function's "Increment" and "Start" arguments (i.e. SAR default is Start = 0.02, Increment = 0.02, therefore Increment/Start Ratio = 1). The same logic applies to the Max/Start Ratio Argument (i.e. SAR default is Start = 0.02, Max = 0.2, therefore Max/Start Ratio = 10).
The Adaptive Coloring argument determines whether the plotting points are red in downtrends and green in uptrends, or if all the plotted points are given the same color (defaults to silver).

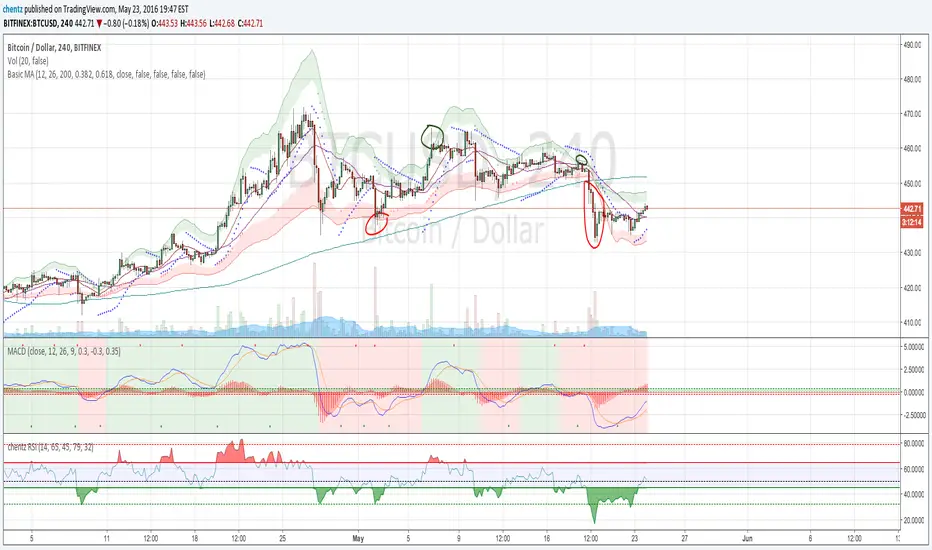
Basic MAAll-in-one basic indicators:
- MA Fast (12)
- MA Medium (26)
- MA Slow (200)
- Parabolic SAR www.investopedia.com
- Dynamic Fibonnaci channel with 2 channels - www.forexstrategiesresources.com
Parabolic StopParbolic Stop is a mix between the indicator Parabolic SAR, Volatility Stop and an SMA.
The goal of this indicator is to place your stop loss in an optimized spot. You can also combine the indicator switch from different timeframes to get buy or sell signal.
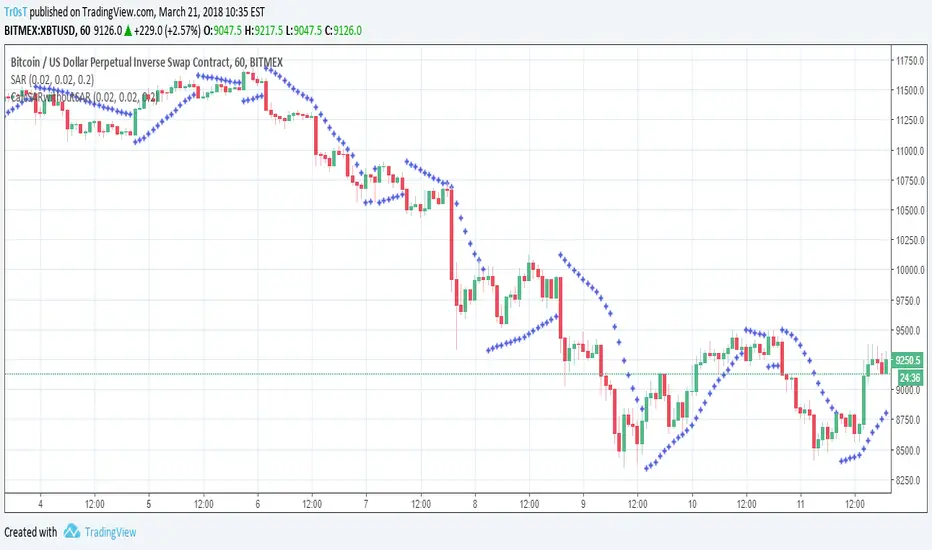
CM_Parabolic SAREnhanced Parabolic Sar
Simply Enhances Default Parabolic SAR by creating Two Color Options, One for UpTrend, Other for DownTrend
Ability To Turn On/Off The Up Trending Parabolic SAR, And The Down Trending Parabolic SAR
Great Indicator For Trailing Stops.
