Uptrick: Volume Weighted BandsIntroduction
This indicator, Uptrick: Volume Weighted Bands, overlays dynamic, volume-informed trend channels directly on the chart. By fusing price and volume data through volume-weighted and exponential moving averages, the script forms a core trend line with adaptive bandwidth controlled by volatility. It is designed to help traders identify trend direction, breakout entries, and extended conditions that may warrant take-profits or pullback re-entries.
Overview
The Volume Weighted Bands system is built around a trend line calculated by averaging a Volume Weighted Moving Average (VWMA) and an Exponential Moving Average (EMA), both over a configurable lookback period. This hybrid trend baseline is then smoothed further and expanded into dynamic upper and lower bands using an Average True Range (ATR) multiplier. These bands adapt with market volatility and shift color based on prevailing price action, helping traders quickly identify bullish, bearish, or neutral conditions.
Originality and Unique Features
This script introduces originality by blending both price and volume in the core trend calculation, a technique that is more responsive than traditional moving average bands. Its multi-mode visualization (cloud, single-band, or line-only), combined with selective buy/sell signals, makes it flexible for discretionary and algorithmic strategies alike. Optional modules for take-profit signals based on z-score deviation and RSI slope, as well as buy-back detection logic with cooldown filters, offer practical tools for managing trades beyond simple entries.
Explanation of Inputs
Every user input in this script is included to give the trader control over behavior and visual presentation:
Trend Length (len): Defines the lookback window for both the VWMA and EMA, controlling the sensitivity of the core trend baseline. A lower value makes the bands more reactive, while a higher value smooths out short-term noise.
Extra Smoothing (smoothLen): Applies an additional EMA to the blended VWMA/EMA average. This second-level smoothing ensures the central trend line reacts gradually to shifts in price.
Band Width (ATR Multiplier) (bandMult): Multiplies the ATR to create the width of the upper and lower bands around the trend line. Larger values widen the bands, capturing more volatility, while smaller values narrow them.
ATR Length (atrLen): Sets the length of the ATR used in calculating band width and signal offsets. Longer values produce smoother band boundaries.
Show Buy/Sell Signals (showSignals): Toggles the primary crossover/crossunder entry signals, which are labeled when the close crosses the upper or lower band.
Visual Mode (visualMode): Allows selection between three display modes:
--> Cloud: Shows both bands and the central trend line with a shaded background.
--> Single Band: Displays only the active (upper or lower) band depending on trend state, with gradient fill to price.
--> Line Only: Shows only the trend line for a minimal visual profile.
Take Profit Signals (enableTP): Enables a z-score-based profit-taking signal system. Signals occur when price deviates significantly from the trend line and RSI confirms exhaustion.
TP Z-Score Threshold (tpThreshold): Sets the z-score deviation required to trigger a take-profit signal. Higher values reduce the frequency of signals, focusing on more extreme moves.
Re-Entries (enableBuyBack): Enables logic to signal when price reverts into the band after an initial breakout, suggesting a possible re-entry or pullback setup.
Buy Back Cooldown (bars) (buyBackCooldown): Defines a minimum bar count before a new buy-back signal is allowed, preventing rapid retriggering in choppy conditions.
Buy Offset and Sell Offset: Hidden inputs used to vertically adjust the placement of the Buy ("𝓤𝓹") and Sell ("𝓓𝓸𝔀𝓷") labels relative to the bands. These use ATR units to maintain proportionality across different instruments and timeframes.
Take-Profit Signal Module
The take-profit module uses a z-score of the distance between price and the trend line to detect extended conditions. In bullish trends, a signal appears when price is well above the band and RSI indicates exhaustion; the opposite applies for bearish conditions. A boolean flag is used to prevent retriggering until RSI resets. These signals are plotted with minimalist “X” markers near recent highs or lows, based on whether the market is extended upward or downward.
Re-Entry Logic
The re-entry system identifies instances where price momentarily dips or spikes into the opposite band but closes back inside, implying a continuation of the prevailing trend. This module can be particularly useful for traders managing entries after brief pullbacks. A built-in cooldown period helps filter out noise and prevents signal overloading during fast markets. Visual markers are shown as upward or downward arrows near the relevant candle wicks.
How to Use This Indicator
The basic usage of this indicator follows a directional, signal-driven approach. When a buy signal appears, it suggests entering a long position. The recommended stop loss placement is below the lower band, allowing for some breathing space to accommodate natural volatility. As the position progresses, take partial profits—typically 10% to 15% of the position—each time a take-profit signal (marked with an "X") is shown on the chart.
An optional feature is the buy-back signal, which can be used to re-enter after partial exits or missed entries. Utilizing this can help reduce losses during false breakouts or trend reversals by scaling in more gradually. However, it also means that in strong, clean trends, the full position may not be captured from the start, potentially reducing the total return. It is up to the trader to decide whether to enter fully on the initial signal or incrementally using buy-backs.
When a sell signal appears, the strategy advises fully exiting any long positions and immediately switching to a short position. The short trade follows the same logic: place your stop loss above the upper band with some margin, and again, take partial profits at each take-profit signal.
Visual Presentation and Signal Labels
All signals are plotted with clean, minimal labels that avoid clutter, and are color-coded using a custom palette designed to remain clear across light and dark chart themes. Bullish trends are marked in teal and bearish trends in magenta. Candles and wicks are also colored accordingly to align price action with the detected trend state. Buy and sell entries are marked with "𝓤𝓹" and "𝓓𝓸𝔀𝓷" labels.
Summary
In summary, the Uptrick: Volume Weighted Bands indicator provides a versatile, visually adaptive trend and volatility tool that can serve multiple styles of trading. Through its integration of price, volume, and volatility, along with modular take-profit and buy-back signaling, it aims to provide actionable structure across a range of market conditions.
Disclaimer
This indicator is for educational purposes only. Trading involves risk, and past performance does not guarantee future results. Always test strategies before applying them in live markets.
Indikator dan strategi

Camarilla Pivot Plays (Lite) [BruzX]█ OVERVIEW
This indicator implements the Camarilla Pivot Points levels and a system for suggesting particular plays. It only 3rd, 4th, and 6th levels, as these are the only ones used by the system. It also optionally shows the Central Pivot Range, which is in fact between S2 and R2. In total, there are 12 possible plays, grouped into two groups of six. The algorithm evaluates in real-time which plays fulfil their precondition and shows the candidate plays. The user must then decide if and when to take the play.
█ CREDITS
The Camarilla pivot plays are defined in a strategy developed by Thor Young, and the whole system is explained in his book "A Complete Day Trading System". This description is self-sufficient for effective use.
█ FEATURES
Display the 3rd, 4th and 6th Camarilla pivot levels
Works for stocks, futures, indices, forex and crypto
Automatically switches between RTH and ETH data based on criteria defined by the system.
Option to force RTH/ETH data and force a close price to be used in the calculation.
Preconditions for the plays can be toggled on/off
Works correctly on both RTH and ETH charts
Well-documented options tooltips
Well-documented and high-quality open-source code for those who are interested
█ HOW TO USE
The defaults work well; at a minimum, just add the indicator and watch the plays being called. For US futures, you will probably want to chat the "Timezone for sessions" to New York and the regular session times to 09:30 - 16:00. The following diagram shows its key features.
By default, the indicator draws plays 1 days back; this can be changed up to 20 days. The labels can be shifted left/right using the "label offset" option to avoid overlapping with other labels in this indicator or those of another indicator.
An information box at the top-right of the chart shows:
The data currently in use for the main pivots. This can switch in the pre-market if the H/L range exceeds the previous day's H/L, and if it does, you will see that switch at the time that it happens
Whether the current day's pivots are in a higher or lower range compared to the previous day's.
The width of the pivots compared to the previous day
The current candidate plays fulfilling preconditions. You then need to watch the price action to decide whether to take the play.
The resistance pivots are all drawn in the same colour (red by default), as are the support pivots (green by default). You can change the resistance and support colours, but it is not possible to have different colours for different levels of the same kind.
█ CONCEPTS
The indicator is focused around daily Camarilla pivots and evaluates the preconditions for 12 possible plays: 6 when in a higher range, 6 when in a lower range. The plays are labelled by two letters—the first indicates the range, the second indicates the play—as shown in this diagram:
The pivots can be calculated using only RTH (Regular Trading Hours) data, or ETH (Extended Trading Hours) data, which includes the pre-market and post-market. The indicator implements logic to automatically choose the correct data, based on the rules defined by the strategy. This is user-overridable. With the default options, ETH will be used when the H/L range in the previous day's post-market or current day's pre-market exceeds that of the previous day's regular market. In auto mode, the chosen pivots are considered the main pivots for that day and are the ones used for play evaluation. The "other" pivots can also be shown—"other" here meaning using ETH data when the main pivots use RTH data, and vice versa.
The plays must fulfil a set of preconditions. There are preconditions for valid region and range, price sweeps into levels, correct pivot width, opening position, price action, and whether neutral range plays and premarket plays are enabled. When all the preconditions are fulfilled, the play will be shown as a candidate.
█ NOTE FOR FUTURES
Futures don't officially have a pre-market or post-market like equities. Let's take ES on CME as an example. It trades from 18:00 ET Sunday to 17:00 Friday (ET), with a daily pause between 17:00 and 18:00 ET. However, most of the trading activity is done between 09:30 and 16:00, which you can tell from the volume spikes at those times, and this coincides with NYSE/NASDAQ regular hours. So we define a pseudo-pre-market from 18:00 the previous day to 09:30 on the current day, then a pseudo-regular market from 08:30 to 16:00, then a pseudo-post-market from 16:00 to 17:00. The indicator then works exactly the same as with equities—all the options behave the same, just with different session times defined for the pre-, regular, and post-market, with "RTH" meaning just the regular market and "ETH" meaning all three.
█ LIMITATIONS
The pivots are very close to those shown in DAS Trader Pro. They are not to-the-cent exact, but within a few cents. The reasons are:
TradingView provides free real-time data from CBOE One, not full exchange data (you can pay for this though, and it's not expensive), and
the close/high/low are taken from the intraday timeframe you are currently viewing, not daily data—which are very close, but often not exactly the same. For example, the high on the daily timeframe may differ slightly from the daily high you'll see on an intraday timeframe.
Despite these caveats, occasionally large spikes will be seem in one platform and not the other (even with paid data), or the spikes will reach significantly difference prices. Where these spikes create the daily high or low, this can cause significantly different pivots levels. The more traded the stock is, the less the difference tends to be. Highly traded stocks are usually within a few cents (but even they occasionally have large differences in spikes). There is nothing that can be done about this.
The 6th Camarilla level does not have a standard definition and may not match the level shown on other platforms. It does match the definition used by DAS Trader Pro.
Replay mode for stocks does not work correctly. This is due to some important Pine Script variables provided by the TradingView platform and used by the script not being assigned correct values in replay mode. Futures do not use these variables, so they should work in replay mode.
The indicator is an intraday indicator (despite also being able to show weekly and monthly pivots on an intraday chart). It deactivates on a daily timeframe and higher. Sub-minute timeframes are also not supported.
The indicator was developed and tested for US/European stocks, US futures and EURUSD forex and BTCUSD. It should work as intended for stocks and futures in different countries, and for all forex and crypto, but this is tested as much as the security it was developed for.
█ DISCLAIMER
This indicator is provided for information only and should not be used in isolation without a good understand of the system and without considering other factors. You should not take trades using real money based solely on what this indicator says. Any trades you take are entirely at your own risk.

Market Structure Pivots TrendThis indicator identifies and visualizes key market structure by plotting confirmed, non-repainting pivot points. It goes beyond simple markers by classifying the pivots, extending dynamic support/resistance lines, and providing a visual representation of the current trend state.
Key Features:
Non-Repainting Pivot Detection:
Uses a standard lookback method (left and right bars) to identify historical pivot points.
Note on Confirmation: Pivots are only confirmed after the Pivot Right Bars input has passed. This is essential for ensuring the signal is non-repainting, but it introduces an inherent lag.
Automatically classifies the sequence of pivots according to Dow Theory: Higher Highs (HH), Higher Lows (HL), Lower Highs (LH), and Lower Lows (LL).
Pivot Classification Filter:
Price Tolerance Filter: A user-defined percentage tolerance filters out insignificant market noise. A pivot is only classified as 'Higher' or 'Lower' if its price exceeds the previous one by more than the set tolerance, leading to more robust signals.
Equal Pivot Detection: The tolerance also enables the detection of Equal Highs (EH) and Equal Lows (EL), highlighting consolidation zones.
Dynamic Support & Resistance Lines:
When enabled, the indicator extends a horizontal line from the most recent confirmed pivot high and low.
These lines update in real-time, providing clear S/R levels.
Lines automatically terminate if the price decisively breaks through them or if a new pivot of the same type is formed.
Trend State Visualization:
A built-in state machine analyzes the sequence of pivots and breaks to determine the current market trend (Uptrend, Downtrend, or Neutral).
Plots a dynamic step-line based on recent highs/lows to visually represent the current trend state.
Full Customization & Alerts:
Display Options: Choose between simple triangles or detailed text labels that show the pivot type, price, and the absolute or relative change from the previous pivot of the same type.
Visual Styling: Full control over colors for all six pivot types (HH, LH, EH, LL, HL, EL) and line styles.
Comprehensive Alerts: Set up alerts for every new pivot formation (e.g., HH, LL), for S/R line breaks, and for changes in the overall trend state (Up, Down, Neutral).
DISCLAIMER
For Informational/Educational Use Only: This indicator is provided for informational and educational purposes only. It does not constitute financial, investment, or trading advice, nor is it a recommendation to buy or sell any asset.
Use at Your Own Risk: All trading decisions you make based on the information or signals generated by this indicator are made solely at your own risk.
No Guarantee of Performance: Past performance is not an indicator of future results. The author makes no guarantee regarding the accuracy of the signals or future profitability.
No Liability: The author shall not be held liable for any financial losses or damages incurred directly or indirectly from the use of this indicator.
Signals Are Not Recommendations: The alerts and visual signals (e.g., crossovers) generated by this tool are not direct recommendations to buy or sell. They are technical observations for your own analysis and consideration.

Smart Money Volume Tools | Lyro RSSmart Money Volume Tools | Lyro RS
Overview
The Smart Money Volume Tools (SMVT) is a multi-dimensional volume-based analysis suite designed to visualize the interplay between price action, moving averages, and smart money behavior.
By integrating dynamic moving averages, volume normalization, and multi-timeframe intelligence, SMVT helps traders identify when institutional (smart money) or retail participants are influencing price movements — all in a single, adaptive display.
Unlike traditional oscillators or trend tools, SMVT dynamically adjusts its sensitivity and thresholds based on volume z-scores and normalized momentum, revealing true intent behind price shifts rather than reacting to them.
🔹 Key Features
4 Core Analytical Modes:
Trail Mode – Identifies directional bias using dynamic volume-weighted trails based on adaptive ATR multipliers.
Volume Mode – Displays normalized volume strength vs. price trend, highlighting volume-driven expansions.
Smart Money Volume Mode – Detects institutional buying/selling spikes from lower timeframes using volume z-score outliers.
Retail Money Volume Mode – Contrasts retail-driven impulses to visualize crowd behavior and exhaustion points.
Dynamic Volume Normalization: Converts volume impulses into a 0–100 range using a sigmoid function for smoother interpretation.
Multi-Timeframe Intelligence: Automatically reads lower timeframe volume data to distinguish smart vs. retail activity.
Adaptive Color Systems: Multiple palette modes ( Classic , Mystic , Accented , Royal ) or full custom color control.
Signal Table Overlay: Built-in real-time module summary showing status for Trail , Volume , Smart Money , and Retail Money — right on your chart.
🔹 How It Works
Volume Strength Calculation:
Calculates relative volume strength using a moving average baseline, then normalizes the result via a sigmoid function — mapping activity into a clean 0–100 range.
Smart Money Detection:
Scans lower timeframe data for extreme volume z-scores ( z > 2 ) to pinpoint institutional accumulation or distribution zones.
Trail Logic:
Uses adaptive upper and lower trails based on ATR and volume intensity to track volatility-adjusted trend direction.
Color Logic:
Trail, candle, and fill colors change dynamically according to the active signal type and selected palette — making directional bias instantly visible.
🔹 Practical Use
Swing Confirmation (Trail Mode): Confirms sustained bullish or bearish momentum supported by volume, ideal for trailing positions and managing exits.
Volume Expansion (Volume Mode): Highlights key moments when institutional liquidity pushes price before visible breakout confirmation.
Smart vs. Retail Divergence: Identify conflicts between retail activity and smart money to detect exhaustion or reversal points early.
Table Overlay Utility: Instantly see all active signals across modules in one compact, on-chart interface.
🔹 Customization
Custom color palettes or manual bullish/bearish color selection.
Adjustable EMA lengths and Volume SMA period .
Selectable lower timeframe source for Smart Money analysis.
Flexible table position & size controls — choose between Top, Middle, Bottom and Tiny to Huge.
Switch freely between Trail , Volume , Smart Money , and Retail Money modes.
Credits
Thank you to @AlgoAlpha for the smart money and retail activity source code.
⚠️Disclaimer
This indicator is a tool for technical analysis and does not provide guaranteed results. It should be used in conjunction with other analysis methods and proper risk management practices. The creators of this indicator are not responsible for any financial decisions made based on its signals.

AG Pro Dynamic ChannelsAG Pro Dynamic Channels V2
Discover a new lens through which to view market structure with the AG Pro Dynamic Channels V2. This advanced indicator moves beyond simple trendlines, automatically identifying, classifying, and drawing eight distinct types of support and resistance channels directly on your chart.
Built on a sophisticated pivot-point detection engine, this script intelligently distinguishes between Major and Minor price structures, as well as Internal and External channels. This provides a comprehensive and multi-dimensional map of the market's flow, helping you identify trend continuations, corrections, and potential reversals.
The indicator is complete with a powerful, fully customizable alert system designed to notify you of the two most critical events: channel breakouts and price reactions.
Key Features
Fully Automatic Channels: The script automatically analyzes price action to find pivot highs and lows, using them to construct relevant channels without any manual drawing required.
8-Channel Classification: Gain deep market insight by viewing eight distinct channel types:
Major External (Up/Down)
Major Internal (Up/Down)
Minor External (Up/Down)
Minor Internal (Up/Down)
Advanced Pivot Engine: The core logic classifies pivots into categories like Higher Highs (MHH/mHH), Lower Lows (MLL/mLL), Higher Lows (MHL/mHL), and Lower Highs (MLH/mLH) to determine the precise start and end points for each channel.
Deep Customization: Take full control of your chart's appearance. You can individually toggle the visibility, color, line style (solid, dashed, dotted), and line width for all eight channel types.
Chart Clarity: A "Delete Previous" option is available for each channel type, allowing you to keep your chart clean and focused on only the most current and relevant market structures.
Comprehensive Alert System
Never miss a key price interaction. The AG Pro Dynamic Channels V2 features a robust, built-in alert module.
Dual-Alert Conditions: Get notifications for two distinct events:
Break Alert: Triggers when price confirms a close outside of a channel, signaling a potential breakout.
React Alert: Triggers when price touches or interacts with a channel line before closing back inside, signaling a test or rejection.
16 Unique Alerts: You have full control to enable or disable "Break" and "React" alerts for all 8 channel types individually, giving you 16 unique alert conditions to monitor.
Professional Alert Messages: The embedded alert sender provides detailed messages that include the asset, timeframe, and the specific event, such as "Break Major External Up Channel" or "React Minor Internal Down Channel".
Alert Configuration: Easily set your global Alert Name, Message Frequency (e.g., Once Per Bar, Once Per Bar Close), and Alert Time Zone from the script's settings.
How to Use
Trend Identification: Use the Major External Channels (drawn from MHH and MLL pivots) to identify the primary, long-term trend direction.
Pullback & Entry Zones: Use the Internal Channels (drawn from MHL and MLH pivots) to spot corrections and potential entry zones within an established trend.
Breakout Trading: Set Break Alerts on Major channels to be notified of significant, structure-shifting moves.
Short-Term & Counter-Trend: Utilize the Minor Channels to identify shorter-term price swings and potential reversal points.

Crypto Futures Basis Tracker (Annualized)🧩 What is Basis Arbitrage
Basis arbitrage is a market-neutral trading strategy that exploits the price difference between a cryptocurrency’s spot and its futures markets.
When futures trade above spot (called contango), traders can buy spot and short futures, locking in a potential yield.
When futures trade below spot (backwardation), the reverse applies — short spot and go long futures.
The yield earned (or cost paid) by holding this position until expiry is called the basis. Expressing it as an annualized percentage allows comparison across different contract maturities.
⚙️ How the Indicator Works
This tool calculates the annualized basis for up to 10 cryptocurrency futures against a chosen spot price.
You select one spot symbol (e.g., BITSTAMP:BTCUSD) and up to 10 futures symbols (e.g., DERIBIT:BTCUSD07X2025, DERIBIT:BTCUSD14X2025, etc.).
The script automatically computes the days-to-expiry (DTE) and the annualized basis for each future.
A table displays for each contract: symbol, expiry date, DTE, last price, and annualized basis (%) — making it easy to compare the forward curve across maturities.
⚠️ Risks and Limitations
While basis arbitrage is often considered low-risk, it’s not risk-free:
Funding and financing costs can erode returns, especially when borrowing or using leverage.
Exchange or counterparty risk — if one leg of the trade fails (e.g., exchange default, margin liquidation), the hedge breaks.
Execution and timing risk — the basis can tighten or invert before both legs are opened.
Liquidity differences — thin futures may have large bid-ask spreads or slippage.
Use this indicator for analysis and monitoring, not as an automated trading signal.
Disclaimer: Please remember that past performance may not be indicative of future results. Due to various factors, including changing market conditions, the strategy may no longer perform as well as in historical backtesting. This post and the script don't provide any financial advice.

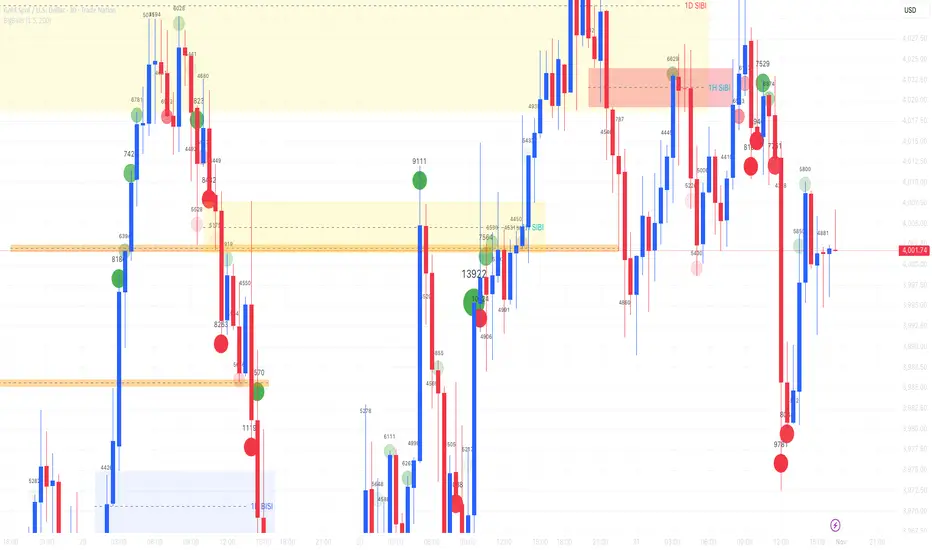
Order Blocks Zones with Signals█ OVERVIEW
“Order Blocks Zones with Signals” is a technical analysis tool that automatically identifies Order Blocks (OB) and optionally Fair Value Gaps (FVG) on the chart.
The script visualizes these zones as colored rectangles, offering full customization of style, transparency, and signal display.
It also generates entry and exit signals (Break & Exit) that can serve as confirmations in strategies based on price action and market structure.
Thanks to flexible candle size filters and rich visual options, the indicator maintains chart clarity and readability.
█ CONCEPTS
Order Blocks (OB) are key zones on the chart where significant price movements previously occurred — areas where large market participants (institutions, so-called smart money) initiated or closed positions.
An OB is the last candle that followed the prior trend before the market reversed (e.g., for a Bullish OB: the last bearish candle before a pivot low and a strong upward impulse).
The script detects these levels using local price pivots, analyzing candle direction to filter out less significant movements.
FVG (Fair Value Gaps) represent areas of imbalance between buyers and sellers — price gaps formed by a sharp impulse where full trading did not occur due to one-sided order dominance (e.g., excess buy or sell orders).
Why combine OB and FVG in one indicator?
Combining OB and FVG analysis is essential because these phenomena often occur sequentially in the institutional market cycle:
1. Order Block — institutions enter the market in the OB zone, absorbing orders and building positions.
2. Strong impulse — after smart money entry, a rapid price move creates an FVG (imbalance gap).
3. Retest — price naturally returns to these zones (OB or FVG), drawn by unfilled orders and the search for equilibrium.
Such areas strongly attract price, as they represent not only historical institutional levels but also open “holes” in the order book. Retests of OB and FVG are ideal entry opportunities with high reaction probability (rebound or breakout). The indicator combines these two interconnected elements, enabling comprehensive market structure analysis in a single tool.
Order Blocks are labeled as:
Bullish OB – demand zones, often accumulation areas before an upmove.
Bearish OB – supply zones, signaling potential impulse end or correction start.
█ FEATURES
Order Block Detection (OB Detection):
- Automatic identification of demand and supply zones based on pivots.
- OB is the last candle aligned with the prior trend, just before the market reversal — precisely identified through candle sequence analysis around the pivot.
- OB zones appear with a delay equal to Pivot Length (default 10 bars).
- Break signals trigger when a candle’s body (close) fully pierces the zone, causing the zone to disappear immediately (e.g., close < low of Bullish OB → Break Down and zone deletion).
- Minimum size filtering via OB Size Multiplier.
- Option to create OB without wicks (Include Wicks in OB): when disabled, OB zones are based solely on candle bodies (open/close), ignoring wicks (high/low).
Fair Value Gap Detection (FVG Detection):
- Optional, with enable/disable capability.
- FVG are detected without delay — immediately upon gap occurrence.
- Size filtering via Candle Size Period and FVG Size Multiplier.
Customizable Styling:
- Separate colors and border styles (Solid / Dashed / Dotted) for each zone type.
- Adjustable transparency and border thickness.
- Unified color for box, border, and signal of the same type.
Breakout and Exit Signals:
- Break Up – triggered when a candle’s close breaks above a Bearish OB, causing the zone to disappear.
- Break Down – triggered when a candle’s close breaks below a Bullish OB, causing the zone to disappear.
- Exit Up / Exit Down – temporary exit from the zone without full breakout (price leaves the zone but doesn’t close beyond it). Signal type selection: Break, Exit, or Both.
- Alerts: built-in alerts for all signal types — triggered automatically on candle close confirming breakout or exit from OB.
█ HOW TO USE
Adding to chart: import the code into Pine Editor and run the script on TradingView.
Settings configuration:
- Pivot Length: controls swing detection sensitivity and OB display delay (default 10).
- Include Wicks in OB: enabled (default) – OB includes wicks; disabled – OB uses bodies only.
- Size Filter: adjust Candle Size Period and OB/FVG Size Multiplier to filter out small zones.
- Colors & Styles: set colors, styles, and transparency for each zone type.
- Signal Type: choose which signals to display (Break, Exit, or Both).
Signal interpretation:
- OB Break Up: price closes above Bearish OB → zone disappears → potential bullish continuation.
- OB Break Down: price closes below Bullish OB → zone disappears → potential bearish continuation.
- Exit Signals: price leaves the zone temporarily without breakout — often signals impending reversal or pullback.
Tips:
- Use OB signals alongside other indicators like RSI, MACD, SMI, or trend filters.
- Order Blocks from higher timeframes (e.g., 4H, 1D) carry greater significance and reaction strength.
- Remember: FVG are detected immediately, OB with delay — a complementary approach!
█ APPLICATIONS
- Smart Money Concepts (SMC): use OB zones as dynamic support and resistance levels. In an uptrend, look for buy opportunities in bullish OBs, which price often retests before further gains. Combining with RSI, MACD, or Fibonacci levels enhances zone significance, confirming institutional demand.
- Breakout Trading: trade based on OB breakout signals. A buy signal after breaking a bearish OB may indicate a strong upward impulse, especially if supported by rising MACD or RSI above 50. Similarly for sell signals after Break Down.
- Reversal Zones: Exit signals may indicate the end of a move or correction. Safest to use in alignment with higher-timeframe trend and confirmed by another indicator (e.g., RSI divergence, Fibonacci levels).
- Confluence Analysis: combine OB and FVG for deeper market structure and equilibrium insight. When an Order Block overlaps or borders an FVG, we get confluence of two institutional phenomena — OB (smart money entry) + FVG (imbalance) — making these areas particularly strong price magnets, increasing retest and reaction probability.
█ NOTES
- FVG can be fully disabled for a cleaner chart view.
- In consolidation periods, signals may appear more frequently — always confirm with additional trend filters.
- Works on all markets and timeframes (crypto, forex, indices, stocks).

ombhai028sboa public scholl ierigiwuhreti ieyrgleirgleiruglehfblyerfeibreyrbveyryrgyregeiyrgerygeirygeyrgyge

Dynamic Auto FibonacciDynamic Auto Fibonacci - Logarithmic Fib Retracements & Extensions
Overview
Dynamic Auto Fibonacci is an advanced Fibonacci analysis tool that automatically identifies swing highs and lows to plot precise retracement and extension levels on your chart. Unlike traditional manual Fibonacci tools, this indicator dynamically updates as price action evolves, with full support for logarithmic scaling - essential for accurate analysis on long-term charts and high-growth assets.
The indicator features a clean, modern aesthetic with customizable vibrant colors and text-only labels that won't clutter your chart, making it perfect for both intraday scalping and long-term position trading.
Key Features
✅ Automatic Fibonacci Detection - Automatically finds the highest high and lowest low within your selected timeframe
✅ Manual Anchor Point - Click directly on the chart to set a custom low point for your Fibonacci analysis
✅ Logarithmic Scale Support - True logarithmic Fibonacci calculations for accurate levels on log-scale charts
✅ Flexible Display Modes - Show retracements only, extensions only, or both simultaneously
✅ Fully Customizable Levels - Adjust any Fibonacci level value, color, or toggle individual levels on/off
✅ Unified Color Mode - One-click option to change all levels to a single color (perfect for minimalist chart styles)
✅ Clean Modern Design - Text-only labels with vibrant colors and adjustable positioning
✅ 13 Default Levels - Includes 0.0, 0.236, 0.382, 0.5, 0.618, 0.786, 0.886, 1.0, 1.236, 1.414, 1.618, 2.0, and 2.618
How to Use
Quick Start (Automatic Mode)
Add the indicator to your chart
By default, it will automatically find the lowest and highest points over the past 12 months
Fibonacci levels will appear with clean colored text labels positioned to the right of current price
Setting a Custom Anchor Point (Manual Mode)
This is the most powerful feature - drawing from a specific swing low:
Click the Settings icon (gear) on the indicator
Navigate to Fibonacci Settings group
Click inside the "Anchor Start Time" field - this will activate anchor selection mode
Click directly on the candle where you want to set your swing low point on the chart
The indicator will automatically:
Lock that candle as your anchor (swing low)
Find the highest high that occurred after your selected anchor point
Draw Fibonacci retracement and extension levels between those two points
Important: The anchor represents the starting point (0.0 level) of your Fibonacci, and the indicator finds the peak after that point as the 1.0 level.
Display Modes
Navigate to Display Settings → Display Mode to choose:
Retracements & Extensions (default) - Shows all levels from 0.0 to 2.618
Retracements Only - Shows only 0.0 to 1.0 levels (great for identifying pullback entry zones)
Extensions Only - Shows 1.0+ levels (useful for profit targets and breakout projections)
Customizing Individual Levels
Under Retracement Levels and Extension Levels groups, each level has three controls:
Toggle checkbox - Show/hide the level
Value field - Adjust the exact Fibonacci ratio (e.g., change 0.618 to 0.65 if desired)
Color picker - Set unique colors for each level
Unified Color Override
Perfect for chart screenshots or minimalist aesthetics:
Go to Unified Color Override settings group
Enable "Use Unified Color for All Levels"
Choose your color (defaults to gray)
All lines and text immediately change to that color - individual settings are preserved when you toggle back off
Line & Label Customization
Display Settings group offers:
Line Style: Solid, Dashed, or Dotted
Line Length: Short (10 bars), Medium (50 bars), or Long (extends right infinitely)
Line Width: 1-5 pixels
Label Size: Tiny to Huge
Label Offset: Adjust how many bars to the right labels appear (default: 12)
Show Anchor Line: Display vertical lines at your swing low and swing high points
Settings Overview
Fibonacci Settings:
Retracement Timeframe (default: 12M)
Anchor Start Time (click to select candle)
Use Log Scale Calculation (highly recommended for crypto and growth stocks)
Display Settings:
Display Mode (Retracements & Extensions / Retracements Only / Extensions Only)
Line Style, Length, Width
On-Chart Labels (clean text) or Price Scale Labels (traditional right-side axis)
Label Size and Offset
Unified Color Override:
One-click monochrome mode for all levels
Individual Level Controls:
8 customizable retracement levels (0.0 to 1.0)
5 customizable extension levels (1.236 to 2.618)
Use Cases
📊 Swing Trading - Identify key support/resistance zones for entries and exits
📊 Scalping - Use short-term anchors to find precise intraday reversal levels
📊 Position Trading - Logarithmic calculations essential for multi-year crypto/stock analysis
📊 Options Trading - Extension levels provide excellent profit target zones
📊 Multi-Timeframe Analysis - Set different anchors to compare short-term vs. long-term Fibonacci structures
Tips for Best Results
For cryptocurrency and growth stocks: Always enable "Use Log Scale Calculation" and view your chart in log scale
For precision: Use the manual anchor feature to draw from confirmed swing lows/highs rather than relying on automatic detection
For clean charts: Toggle off levels you don't actively use (e.g., disable 0.786 and 0.886 if you only trade 0.382/0.618)
For screenshots: Enable Unified Color Override and set to grayscale for professional-looking chart exports
Note on Logarithmic Scale
This indicator includes true logarithmic Fibonacci calculations, which are critical when analyzing assets with significant price appreciation. Standard arithmetic Fibonacci tools become increasingly inaccurate on log-scale charts - this indicator solves that problem by calculating levels using logarithmic mathematics when "Use Log Scale Calculation" is enabled.
Disclaimer: This indicator is a tool for technical analysis and does not constitute financial advice. Always perform your own analysis and risk management before making trading decisions.

Pivots High Low Live DetectionPivots High Low Live Detection
Identifies and visualizes swing highs and lows on the chart in real time.
Helps to observe evolving market structure by connecting confirmed or developing pivot points with lines and labels.
Using a configurable lookback, minimum deviation, and confirmation bar system, the indicator highlights new Higher Highs (HH), Higher Lows (HL), Lower Highs (LH), and Lower Lows (LL) as they form.
When “Live (repainting)” mode is enabled, the current swing leg updates dynamically with each candle, giving immediate feedback as price develops.
When disabled, only confirmed pivots are plotted, ideal for historical validation and backtesting.
+ Key Features
Detects and labels major swing points (HH, HL, LH, LL).
Works in live or confirmed (non-repainting) mode.
Adjustable parameters for lookback, deviation (in ticks), and confirmation bars.
Lightweight and compatible with any timeframe or symbol.
Includes runtime alerts for new structural pivots and direction shifts.
+ How to Use
Adjust the inputs under the “Pivots” group to control sensitivity.
Enable “Live (repainting)” to see developing swing legs, or disable it for confirmed structure only.
Use alerts to track structural changes or potential trend reversals.

SPX 0dte Options TableSPX 0DTE Options Table Indicator 📊
Version: Pine Script v6
Description: A real-time table overlay for 0DTE SPX options, showing strikes, prices, and volumes for calls/puts. Perfect for intraday traders spotting high-volume opportunities!
Perfect for fast look up for options premium ( Real time data required $2/month)
Key Features
Dynamic Table: Displays current SPX price, call/put strikes (e.g., 5700C/5600P), last prices, and volumes in a clean overlay.
Custom Strikes: 1-15 per side (default: 8), with increments of 5+ (default: 10). Strikes rounded to multiples of 10.
Strike Offset: Fixed (default: 0) or dynamic based on remaining trading hours (US session: 9:30 AM-4:00 PM ET, e.g., 6+ hours = ±40).
SPX Handling: Fixed value (default: 6850) or dynamic from open (default: 60-min timeframe).
Data Fetch: OPRA tickers on last bar; customizable timeframe (default: 1-min).
Volume Alerts: Trigger on > threshold (default: 600) if price ≥$1. JSON alerts with ET timestamp.
Customization: Table position, colors, text size (tiny/small/normal/large).
Optimizations: Array-based; weekend-aware; real-time focus.
Limitations: Needs OPRA data access; no historicals; use fixed SPX to avoid open-update errors.

Combined Fractal + MACD + Volume Alerts - Buy/SellOverview
This TradingView indicator is designed to save traders hours of manual analysis by automatically combining three powerful market signals into a single alert system:
Williams Fractals – identifies local highs and lows in the price structure.
MACD Crosses – confirms momentum direction and potential trend changes.
Volume Spike Detection – ensures signals occur with meaningful market participation.
The indicator will generate buy and sell alerts only when all three conditions align (or within a short configurable window), allowing traders to focus on high-probability setups without monitoring multiple charts and indicators manually.
Key Features
✅ Combined Alerts – Only triggers when Fractal, MACD, and Volume conditions are met.
✅ Early Alerts – Alerts fire as soon as the conditions occur, giving traders a head start for preparation and analysis.
✅ Optional Visuals – Plots buy/sell markers for testing and strategy verification; can be disabled for a cleaner chart.
✅ Flexible Settings – Users can adjust MACD parameters, volume multipliers, and Fractal ranges to suit their trading style.
✅ Timeframe Agnostic – Works on all timeframes; best on intraday and swing-trading charts.
✅ Non-Repainting Alerts – Ensures reliable signals without misleading historical adjustments.
How It Works
Fractals (Price Structure)
The indicator detects local highs and lows (Williams Fractals) over a configurable range of bars.
Fractals act as a support/resistance or trend turning point filter.
MACD (Momentum Confirmation)
Signals are validated with MACD line and Signal line crosses.
Optional conditions: only alert when MACD crosses above zero for a bullish trend or below zero for a bearish trend.
Volume (Participation Check)
The indicator ensures that any signal occurs with above-average volume, filtering weak or low-confidence signals.
Volume threshold is configurable via a multiplier relative to the average over a selected period.
Combined Logic
Buy Alert: Triggered when a bullish Fractal is formed and MACD crosses up and volume spike occurs.
Sell Alert: Triggered when a bearish Fractal is formed and MACD crosses down and volume spike occurs.
Optionally, the conditions can fire within 3 candles of each other, giving some flexibility for real-market timing.
Benefits for Traders
Saves Time: No need to manually watch multiple indicators.
High-Probability Alerts: Combines trend, structure, and volume for robust signals.
Customizable: Adapt to your trading style, instrument, or timeframe.
Testing & Validation: Optional visuals allow backtesting before relying solely on alerts.
Alerts Anywhere: Works on all tickers and chart timeframes supported by TradingView.
How to Use
Apply the indicator to your TradingView chart.
Configure settings:
Fractal Left/Right range (default: 2 bars).
MACD Fast/Slow/Signal lengths.
Volume multiplier to define “spike.”
Optional: enable/disable visuals for testing.
Set up TradingView alerts using the indicator’s prebuilt alert conditions.
Use the alerts as early heads-up for potential trades; validate with your strategy rules or confluences.
Tips for Traders
Start with defaults: Test on a few symbols and intraday charts first.
Adjust volume multiplier: Avoid too many alerts on low-volume symbols.
Backtest visually: Enable markers to verify signals against historical price action.
Combine with your workflow: Use alerts to prioritize charts rather than trade blindly.
Conclusion
This Combined Fractal + MACD + Volume Alerts Indicator is ideal for traders who want to automate the detection of high-probability setups while maintaining flexibility and control. It streamlines decision-making by combining price structure, momentum, and market participation into a single, actionable alert system.
Whether you are a day trader, swing trader, or part-time trader, this indicator saves time, reduces noise, and helps focus on the most promising trading opportunities.

Gann Angles by Calendar Date 2A script that draws Gann angles. 1x1/1x2/1x3/1x4/1x8
Manually enter the date and price.

GTI BGTI: RSI Suite (Standard • Stochastic • Smoothed)
A three-layer momentum and trend toolkit that combines Standard RSI, Stochastic RSI, and a Smoothed/“Macro” RSI to help you read intraday swings, trend transitions, and high-probability reversal/continuation spots.
All in one pane with intuitive coloring and optional divergence markers and alerts.
Why this works
* Stochastic RSI (K/D) visualizes fast momentum swings and timing.
* Standard RSI moves more gradually, helping confirm trend transitions that may span several Stochastic cycles.
* Smoothed RSI (Average → Macro) adds a second-pass filter and slope persistence to reveal the macro direction while suppressing noise.
Used together, Stochastic guides entries/exits around local highs/lows, while the RSI layers improve confidence when a small swing is likely part of a larger turn.
What you’ll see
* Standard RSI (yellow; pink above Bull line, aqua below Bear line).
* Stochastic RSI (K/D) with contextual colors:
* Greens when RSI is weak/oversold (bearish conditions → watch for bullish reversals/continuations).
* Reds when RSI is strong/overbought (bullish conditions → watch for bearish reversals/continuations).
* Smoothed (Macro) RSI with trend color:
* Red when macro is ascending (bullish),
* Aqua when macro is descending (bearish).
* Divergences (optional markers):
* Bearish: RSI Lower High + Price Higher High (red ⬇).
* Bullish: RSI Higher Low + Price Lower Low (green ⬆).
* No repaint: pivots confirm after the chosen right-bars window.
How to use it
* Bullish Reversal
* Macro RSI is reversing at a higher low after price has been in a overall downtrend
* Stochastic RSI is switching from green to red in an overall downtrend
* Bullish Oversold
* Macro RSI is reversing from a significantly low level after price has a short but strong dip during an overall uptrend
* Stochastic RSI is switching from green to red in an overall uptrend
* Bullish Continuation
* Macro RSI is ascending with a strong slope or forming a higher low above the 50 line
* Stochastic RSI is reaching a bottom but still painted red
* Bearish Reversal
* Macro RSI is reversing at a lower high after price has been in a overall uptrend
* Stochastic RSI is switching from red to green in an overall uptrend
* Bearish Overbought
* Macro RSI is reversing from a significantly high level after price has a short but strong jump during an overall downtrend
* Stochastic RSI is switching from red to green in an overall downtrend
* Bearish Continuation
* Macro RSI is descending with a strong slope or forming a lower high below the 50 line
* Stochastic RSI is reaching a top but still painted green
* Divergences: Use as signals of exhaustion—best when aligned with Macro RSI color/slope and key levels (e.g., Bull/Bear lines, 50 midline).
*** IMPORTANT ***
* Stack confluence, don’t single-signal trade. Look for:
* 1) Macro RSI color & slope (red = ascending/bullish, aqua = descending/bearish)
* 2) Standard RSI location (above/below Bull/Bear lines or 50)
* 3) Stoch flip + direction
* 4) Price structure (HH/HL vs LH/LL)
* 5) Divergence type (regular vs hidden) at meaningful levels
* Trade with the macro
* Prioritize longs when Macro RSI is red or just flipped up
* Prioritize shorts when Macro RSI is aqua or just flipped down
* Counter-trend setups = smaller size and faster management.
* Location > signal
* The same crossover/divergence is higher quality near Bull (~60)/Bear(~40) or extremes than in the mid-range chop around 50.
* Early vs confirmed
* Use the early pivot heads-up for anticipation, but scale in only after the confirmed pivot (right-bars complete). If early signal fails to confirm, stand down.
* Define invalidation upfront
* For divergence entries, place stops beyond the pivot extreme (LL/HH). If Macro RSI flips against your trade or RSI breaks back through 50 with slope, exit or tighten.
* Multi-timeframe alignment
* Best results come when entry timeframe (e.g., 1H) aligns with higher-TF macro (e.g., 4H/D). If they disagree, treat it as mean-reversion only.
* Avoid common traps
* Skip: isolated Stochastic flips without RSI support, divergences without price HH/LL confirmation, and serial divergences when Macro RSI slope is strong against the idea.
* Parameter guidance
* Start with defaults; then tune: confirmBars 3–7, minSlope 0.05–0.15 RSI pts/bar, pivot left/right tighter for faster but noisier signals, wider for cleaner but fewer.
* Alerts = workflow, not auto-trades
* Use Macro Flip + Divergence alerts as a checklist trigger; enter only when your confluence rules are met and risk is defined.
Key inputs (tweak to your market/timeframe)
* RSI / Stochastic lengths and K/D smoothing.
* Bull / Bear Lines (default 61.1 / 43.6).
* Average RSI Method/Length (SMA/EMA/RMA/WMA) + Macro Smooth Length.
* Trend confirmation: bars of persistence and minimum slope to reduce flip noise.
* Pivot look-back (left/right) for divergence confirmation strictness.
Alerts included
* Macro Flip Up / Down (Smoothed RSI regime change).
* RSI Bullish/Bearish Divergence (confirmed at pivot).
* Stochastic RSI continuation/divergence (optional).
Tips
* Level + Slope matter. High/low RSI level flags conditions; slope confirms impulse/continuation.
* Let Stochastic time the swing; let Macro RSI filter the trend.
* Tighten or loosen pivot windows to trade fewer/cleaner vs. more/faster signals.

BigBallsCalculate normalized volume based on StdDev of volume over 200 bars and show volume as a circle on candles.
Sometimes useful for "follow through".

Highs and Lows MarkerIndicator Description – Highs and Lows Marker
This indicator identifies swing highs and swing lows based on a simple two-candle pattern structure:
High Formation (Swing High):
A High is marked when a bullish candle (Candle Up) is immediately followed by a bearish candle (Candle Down).
The High value is taken as the highest wick price between the two candles in this formation.
This represents a potential short-term resistance or turning point in the market.
Low Formation (Swing Low):
A Low is marked when a bearish candle (Candle Down) is immediately followed by a bullish candle (Candle Up).
The Low value is taken as the lowest wick price between the two candles in this formation.
This represents a potential short-term support or reversal area.
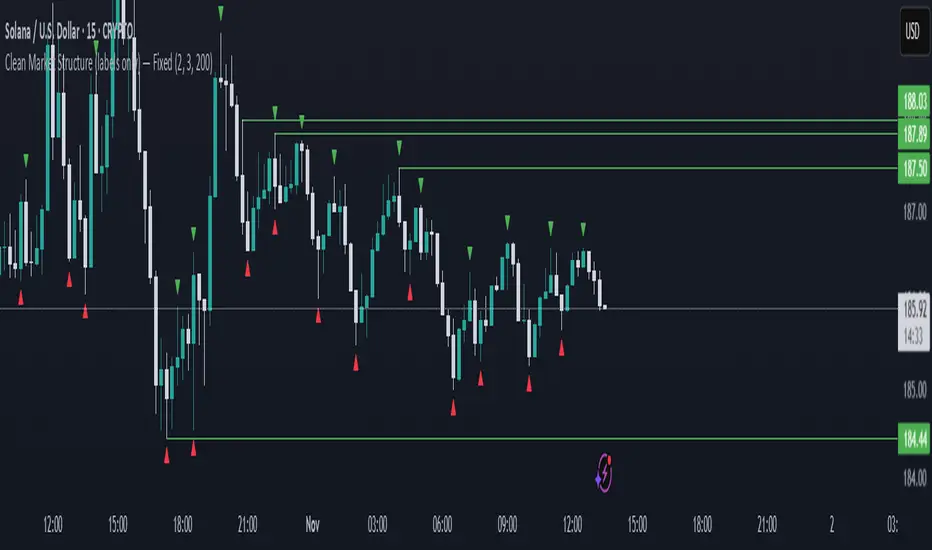
Clean Market Structures This indicator marks out the highs and lows on the chart, allowing traders to easily follow the market structure and identify potential liquidity zones.
Highs are plotted when an up candle is followed by a down candle, marking the highest wick of that two-candle formation.
Lows are plotted when a down candle is followed by an up candle, marking the lowest wick of that two-candle formation.
These levels often act as liquidity pools, since liquidity typically rests above previous highs and below previous lows .
By highlighting these areas, the indicator helps traders visualize where price may seek liquidity and react, making it useful for structure-based and liquidity-driven trading strategies.

SA_EMA Combo + UT BotEMA Combo + UT Bot is an indicator designed to make it easier to track trend direction and momentum reversals on the same chart.
The indicator combines multiple EMA lines (50/100/150/200) with a short- and medium-term EMA cloud. This cloud visually shows whether the market is in a bullish or bearish trend through color changes.
In addition, it uses the UT Bot algorithm to generate buy and sell signals adapted to market volatility. These signals are triggered when the price crosses the ATR-based trailing stop level.
Users can choose to use Heikin Ashi candles and adjust signal sensitivity via the Key Value parameter. This allows traders to follow overall trends and potential reversal zones using a single tool.
Disclaimer: This indicator is for technical analysis purposes only and should not be considered financial advice.
Developed for Future Alpha Club.
Central Limit Theorem Reversion IndicatorDear TV community, let me introduce you to the first-ever Central Limit Theorem indicator on TradingView.
The Central Limit Theorem is used in statistics and it can be quite useful in quant trading and understanding market behaviors.
In short, the CLT states: "When you take repeated samples from any population and calculate their averages, those averages will form a normal (bell curve) distribution—no matter what the original data looks like."
In this CLT indicator, I use statistical theory to identify high-probability mean reversion opportunities in the markets. It calculates statistical confidence bands and z-scores to identify when price movements deviate significantly from their expected distribution, signaling potential reversion opportunities with quantifiable probability levels.
Mathematical Foundation
The Central Limit Theorem (CLT) says that when you average many data points together, those averages will form a predictable bell-curve pattern, even if the original data is completely random and unpredictable (which often is in the markets). This works no matter what you're measuring, and it gets more reliable as you use more data points.
Why using it for trading?
Individual price movements seem random and chaotic, but when we look at the average of many price movements, we can actually predict how they should behave statistically. This lets us spot when prices have moved "too far" from what's normal—and those extreme moves tend to snap back (mean reversion).
Key Formula:
Z = (X̄ - μ) / (σ / √n)
Where:
- X̄ = Sample mean (average return over n periods)
- μ = Population mean (long-term expected return)
- σ = Population standard deviation (volatility)
- n = Sample size
- σ/√n = Standard error of the mean
How I Apply CLT
Step 1: Calculate Returns
Measures how much price changed from one bar to the next (using logarithms for better statistical properties)
Step 2: Average Recent Returns
Takes the average of the last n returns (e.g., last 100 bars). This is your "sample mean."
Step 3: Find What's "Normal"
Looks at historical data to determine: a) What the typical average return should be (the long-term mean) and b) How volatile the market usually is (standard deviation)
Step 4: Calculate Standard Error
Determines how much sample averages naturally vary. Larger samples = smaller expected variation.
Step 5: Calculate Z-Score
Measures how unusual the current situation is.
Step 6: Draw Confidence Bands
Converts these statistical boundaries into actual price levels on your chart, showing where price is statistically expected to stay 95% and 99% of the time.
Interpretation & Usage
The Z-Score:
The z-score tells you how statistically unusual the current price deviation is:
|Z| < 1.0 → Normal behavior, no action
|Z| = 1.0 to 1.96 → Moderate deviation, watch closely
|Z| = 1.96 to 2.58 → Significant deviation (95%+), consider entry
|Z| > 2.58 → Extreme deviation (99%+), high probability setup
The Confidence Bands
- Upper Red Bands: 95% and 99% overbought zones → Expect mean reversion downward as the price is not likely to cross these lines.
- Center Gray Line: Statistical expectation (fair value)
- Lower Blue Bands: 95% and 99% oversold zones → Expect mean reversion upward
Trading Logic:
- When price exceeds the upper 95% band (z-score > +1.96), there's only a 5% probability this is random noise → Strong sell/short signal
- When price falls below the lower 95% band (z-score < -1.96), there's a 95% statistical expectation of upward reversion → Strong buy/long signal
Background Gradient
The background color provides real-time visual feedback:
- Blue shades: Oversold conditions, expect upward reversion
- Red shades: Overbought conditions, expect downward reversion
- Intensity: Darker colors indicate stronger statistical significance
Trading Strategy Examples
Hypothetically, this is how the indicator could be used:
- Long: Z-score < -1.96 (below 95% confidence band)
- Short: Z-score > +1.96 (above 95% confidence band)
- Take profit when price returns to center line (Z ≈ 0)
Input Parameters
Sample Size (n) - Default: 100
Lookback Period (m) - Default: 100
You can also create alerts based on the indicator.
Final notes:
- The indicator uses logarithmic returns for better statistical properties
- Converts statistical bands back to price space for practical use
- Adaptive volatility: Bands automatically widen in high volatility, narrow in low volatility
- No repainting: yay! All calculations use historical data only
Feedback is more than welcome!
Henri

Dynamic Auto Fibonacci - Auto/Manual ModeDynamic Auto Fibonacci - Professional Retracement & Extension Tool
The ultimate Fibonacci tool combining automatic high detection with manual precision for swing low selection.
🎯 Key Features
Hybrid Drawing System
Auto Mode: You manually select your swing low by clicking on the chart, then the indicator automatically finds the highest high after that point - giving you control over your anchor while automating the rest
Manual Mode: Full control - click to select BOTH your swing low (0.0) AND swing high (1.0) for complete precision - perfect for drawing multiple projections to find confluence zones
Logarithmic Scale Support
True logarithmic Fibonacci calculations for accurate levels on log-scale charts
Essential for crypto and growth stocks with significant price appreciation
Smart Level Management
"Key Fibs Only" toggle (ON by default): Shows 13 essential professional levels
All 23 levels unlocked: Turn off Key Fibs to access 10 additional advanced levels including 0.414, 0.707, 0.886, 1.886, 2.272, 3.618, and negative projections
Every level is fully customizable - edit values, toggle on/off, change colors
Essential Fibonacci Levels (Default)
Core: 0.0, 0.236, 0.382, 0.5, 0.618 (Golden), 0.786, 1.0
Extensions: 1.272, 1.382, 1.618 (Golden), 2.0, 2.618 (Golden), 4.236
All golden ratio levels (0.618, 1.618, 2.618, 3.618) highlighted in gold
Professional Display Options
Three display modes: Retracements Only, Extensions Only, or Both
Customizable line styles (Solid/Dashed/Dotted), widths, and lengths
Clean text-only labels or traditional price scale labels
Unified color override for minimalist chart aesthetics
Adjustable label positioning and sizing
Perfect for Professional Trading
Add multiple instances with different manual anchors to identify high-probability confluence zones
Combines the convenience of partial automation with the precision of manual anchor selection
Works on all markets: stocks, forex, crypto, futures
Compatible with all timeframes and markets. Clean code, efficient performance, zero repainting.
Consecutive Gap FinderLooks for consecutive gaps based on daily chart using ATR multiplier.
Highlights them when a certain number are found.

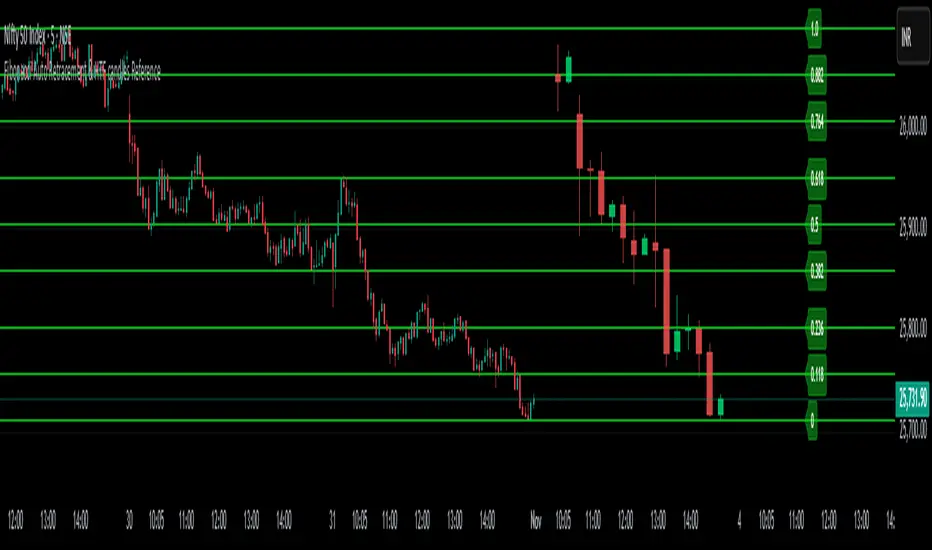
Fibonacci Auto Retracement & HTF candles ReferenceAdvanced Higher Timeframe (HTF) Candle & Fibonacci Viewer
Overview:
The Advanced HTF Candle & Fibonacci Viewer is a professional Trading View indicator designed to help traders overlay higher timeframe price structures onto lower timeframe charts. By combining daily candle analysis with precise Fibonacci retracement levels, this tool allows traders to identify critical support and resistance zones, potential breakouts, and retracement opportunities without switching charts.
Special Thanks:
This script includes a small part of coding inspired by Zeiierman, whose work on HTF analysis provided the foundation for visualizing higher timeframe structures. Full credit to Zeiierman for their invaluable contribution to the Trading View community.
Key Features:
1. Multi-Day HTF Range Display
Automatically displays high and low of 1–7 previous days.
Highlights candle bodies and wicks for clear structure visualization.
Ideal for spotting daily ranges and breakout levels.
2. Dynamic Fibonacci Levels
Standard levels: 0%, 11.8%, 23.6%, 38.2%, 50%, 61.8%, 76.4%, 88.2%, 100%.
Optional mid-level lines for intraday support/resistance identification.
Levels adjust automatically to reflect price action direction.
3. Customizable Labels & Colors
Adjustable text size, color, transparency, and offset.
Fully customizable candle and Fibonacci colors.
Mid-level lines can be shown or hidden for a cleaner look.
4. Persistent Levels
Levels remain until the next trading session or breakout, helping track trends and retracements consistently.
5. Multi-Timeframe Optimization
Works on any chart timeframe, from 1-minute to weekly charts.
Provides higher timeframe insight while trading on lower timeframes.
Why Traders Love This Indicator:
View higher timeframe action without switching charts.
Identify high-probability entry and exit zones.
Combine with other indicators for complete market analysis.
Useful for swing traders, day traders, and scalpers alike.
Customization Options:
Number of previous days (1–7)
Show/hide mid-level lines
Show/hide labels
Customize label size, color, and offset
Customize Fibonacci and candle colors
Ideal Use Cases:
Swing Trading: Identify daily key levels for entry, exit, and stop-loss.
Day Trading: Use HTF ranges on intraday charts to spot breakouts and reversals.
Fibonacci Analysis: Locate retracement zones efficiently.
Trend Confirmation: Validate trades with higher timeframe structure.
Summary:
The Advanced HTF Candle & Fibonacci Viewer is a powerful tool for traders seeking clarity, structure, and precision. With higher timeframe insight overlaid on active charts and proper credit to Zeiierman for their HTF coding contribution, this indicator helps traders make informed, confident decisions in any market.