#BLTA - CARE 7891🔷 #BLTA - CARE 7891 is an overlay toolkit designed to support structured trading preparation and chart reading. It combines a manual Trade Box + Lot Size/Risk panel, session background highlights (NY time), confirmed Previous Day/Week High-Low levels, an Asian range liquidity box, a 1H ZigZag market-structure projection, and an imbalance map (FVG / OG / VI) with an optional dashboard.
This script is an indicator (not a strategy). It does not place orders and is intended for planning, risk visualization, and market context.
✅ Main Modules
1) 💸 Risk Module (Trade Box + Lot Calculation + Table)
A complete manual trade-planning tool:
Pick an Entry Point (EP) and Stop Loss (SL) directly on the chart using input.price(..., confirm=true).
Automatically calculates:
Cash at Risk
SL distance (pips) (Forex-aware)
Lot size based on your:
Account balance
Risk %
Units per lot
Account base currency (with conversion if needed)
Draws:
Risk box (EP ↔ SL)
Target box (RR-based TP)
Displays a clean table panel with the key values.
🔁 Re-confirm Mode (Wizard)
Use “Re-confirm Trade Box Points” to force a clean logical reset and re-pick EP/SL/time anchors:
Shows temporary EP/SL labels
Shows a small wizard table guiding you step-by-step
Turn it OFF to return to normal risk table + boxes
Tip: If your chart timeframe changes or you want a fresh selection, Re-confirm mode is the safest way to reset everything cleanly.
2) 🎨 Session Visualization (New York Time)
Highlights chart background for these windows:
Day Division (17:00–17:01 NY)
London (03:00–05:00 NY) + sub-windows
New York (08:00–10:30 NY) + sub-windows
Colors are fully configurable from inputs.
3) 📰 Confirmed PDH/PDL (Previous Days)
Optional module that plots confirmed Previous Day High (PDH) and Previous Day Low (PDL):
Trading day is defined as 17:00 → 17:00 NY
Lines start exactly at the candle where the high/low occurred
Lines extend forward and can freeze when price touches them
Configurable: days to keep, style, width, and “stop on hit”
4) 📅 Confirmed Weekly High/Low (Previous Weeks)
Optional module that plots confirmed Weekly High/Low:
Confirmation occurs at Sunday 17:00 NY (typical FX week boundary)
Lines begin at the candle where the weekly extremes formed
Extends forward and can freeze on touch
Configurable: weeks to keep, style, width, stop-on-hit
5) 🈵 Asian Range Liquidity Box
Draws a session box that tracks high/low and optional midline (50%):
Uses New York time
Dynamic updates while session is active
Optional mid label and configurable line style/width
6) 📈 Market Structure - ZigZag (1H projected)
A ZigZag structure engine calculated on 1H and projected onto any timeframe:
Configurable:
Length
Source type (High/Low or Open/Close)
Colors and width
Opacity when viewing non-1H charts
Optional live extension of the last leg
Includes safe cleanup when toggling OFF (no leftover objects)
7) 📊 Imbalance Detector (FVG / OG / VI) + Dashboard
Detects and draws:
Fair Value Gaps (FVG)
Opening Gaps (OG)
Volume Imbalances (VI)
Optional dashboard shows frequencies and fill rates.
Attribution / Credits
This module is inspired by / adapted from the public concept widely known as “Imbalance Detector” (LuxAlgo-style logic). This script is independently packaged and integrated as part of the toolkit with additional modules and custom structure.
⚙️ How to Use (Quick Steps)
Add the indicator to the chart (overlay).
Enable 💸 Risk Module if you want trade planning.
Go to Trade Box Location and pick:
Entry Point (EP)
Stop Loss (SL)
Time anchors for box edges
Adjust:
Account balance, risk %, units per lot, RR target
Enable additional modules as needed:
Session backgrounds
PDH/PDL
Weekly High/Low
Asian range box
ZigZag
Imbalances + dashboard
🔎 Notes & Limitations
This script is for visual planning and context, not trade execution.
Lot sizing is based on the selected EP/SL and your inputs; always double-check broker rules, symbol specifications, and contract size.
Object-heavy features (boxes/lines/tables) may increase load on lower-end devices or very small timeframes.
Indikator dan strategi

ICT ORB Killzones by MaxN (15 / 30m)Trading session open/close with first 15/30 min orbs
will just have to adjust time zones to your current time line
GMT +0
I use
Asia 23.00 - 06.00
London 07.00 - 16.00
New York 12.00 - 22.00

Swing HelperThis script, titled "Swing helper", is a multi-metric dashboard designed to provide a comprehensive snapshot of a security's volatility, relative volume, and price action health directly on the chart. It focuses on Average Daily Range (ADR) relationship and key performance indicators to help traders identify setups like volatility contractions or trend strength.
Key Features
Dual-ADR Analysis: Calculates and compares Long-Term (LT) and Short-Term (ST) ADR percentages. The ADR Ratio helps identify when volatility is expanding or contracting relative to historical norms.
Relative Volume (RVol): Compares current volume to a 20-day moving average, highlighting institutional participation.
Dynamic Closing Range: Visualizes where the price is closing relative to the day's true range (the "Closing Range %"), indicating buying or selling pressure.
SMA 50 Distance: A unique metric that measures the price's distance from the 50-day Simple Moving Average in "ADR units," helping to gauge how overextended a stock is.
Automated Price Projections: Dynamically plots -1x and -2x ADR levels from the current price to provide immediate downside targets or support levels.
Custom Bar Coloring: Highlights specific price action patterns:
Inside Days (Blue)
Upside Reversals (Green)
Downside Reversals (Red)
Visual Customization
The script includes a highly flexible Summary Table with customizable positions, sizes, and colors (including borders and headers), allowing it to fit into any dark or light mode chart layout without obstructing price action.
How to Use
Volatility Contraction: Watch for the ADR Ratio to drop, indicating a tightening range before a potential breakout.
Relative Strength: Look for high RVol combined with a high Closing Range % (e.g., >75%) to confirm strong demand.
Mean Reversion: Use the SMA50 Dist metric to identify when a stock is "stretched" too far from its moving average relative to its daily volatility.

Lot Size Calculator (Entry + SL) GOLDLot Size Calculator (Entry + SL)
This indicator helps traders calculate the correct position size (lots) based on risk management, using a fixed account balance and risk percentage per trade.
By providing an Entry Price and Stop-Loss Price, the script automatically computes:
Dollar risk per trade
Stop-loss distance
Risk per unit
Total position size in units
Final position size in lots (rounded to broker-compatible steps)
How It Works
Define your Account Balance.
Set your Risk % per trade (e.g., 1%).
Choose your Entry Price:
Manual input, or
Use the current market price.
Enter your Stop-Loss Price.
The indicator calculates the maximum lot size so that your loss at SL equals your predefined risk.
Key Features
Uses TradingView’s syminfo.pointvalue for accurate instrument pricing
Supports any market (Forex, indices, commodities, crypto)
Custom units per lot (FX standard, mini, micro, or custom CFD contracts)
roker-friendly lot rounding
Clean table display for quick decision-making
Ideal for traders who:
Follow strict fixed-percentage risk management
Want consistent position sizing
Trade multiple instruments with different contract sizes
This tool ensures every trade risks the same percentage of capital, regardless of stop-loss distance.

BK AK-Flag Formations🏴☠️ BK AK-Flag Formations — Raise the standard. Drive the line. Continue the assault. 🏴☠️
Built for traders who exploit momentum with discipline: flagpoles, flags, and pennants detected, tagged, and briefed—so you press advantage instead of hesitating.
🎖️ Full Credit (Engine + Logic — Trendoscope)
Original foundation (Trendoscope Flags & Pennants):
The entire detection engine—multi-zigzag swing extraction, pivot logic, pattern validation, classification framework, and drawing architecture—is Trendoscope. He’s the architect of the core system.
I’m not claiming the engine. I’m shipping a cleaner, more tactical interface layer on top of his work.
🧩 BK Enhancements (on top of Trendoscope)
Purpose: read continuation faster with less chart noise.
Short-form pattern tags so structure stays obvious without burying price:
BF / BeF / BP / BeP / F / P / UF / DF / RF / FF / AF / DeF
Label transparency controls (text + background), plus separate transparency control for short labels
Hover tooltips (toggle): hover the tag to reveal full pattern name + bias (Bullish / Bearish / Neutral)
Upgraded alert system: filters by Bias (Bullish/Bearish/Neutral) and Type (Flag / Pennant), with clearer alert messages
Pattern border extension (optional): extends the two pattern boundary lines forward by N bars so your levels stay mapped for break/retest planning
Everything else is Trendoscope’s architecture and math.
🧠 What It Does (The Mission)
This script hunts continuation formations that form after a strong impulse move:
Detects the flagpole (impulse)
Validates a consolidation structure (flag or pennant)
Tags it cleanly with short codes
Optional hover-briefing gives the long name + bias exactly when you need it
You get continuation structure in real time, across multiple swing sensitivities.
🧭 How It Detects (So You Know It’s Not Random)
This isn’t “pattern art.” It’s rule-based geometry + swing logic:
1) Multi-Zigzag Sweep (micro → macro)
Runs up to 4 zigzag engines so it catches both tight and larger continuations.
(Default BK tuning uses 4 levels with different swing lengths/depths.)
2) Quality Filters (you control strictness)
Key scanning controls:
Error Threshold: tolerance used during trendline validation
Flat Threshold: what qualifies as “flat” vs sloped
Max Retracement (default 0.618): limits how deep the consolidation can retrace the impulse
Verify Bar Ratio (optional): checks proportion/spacing of pivots, not just price
Avoid Overlap: prevents stacking formations on top of each other
Repaint option: allows refinement if better coordinates form (for real-time users)
3) Classification (Flag vs Pennant)
Once the engine confirms an impulse + valid consolidation, it classifies:
Flag = orderly channel/wedge-style consolidation after the pole
Pennant = tighter triangle-style compression after the pole
Then it labels with bias based on direction and formation context.
🏳️ Read the Continuation (Short Codes that Actually Matter)
BF — Bull Flag: strong pole → controlled pullback; watch for break + continuation expansion
BP — Bull Pennant: thrust → tight compression; expansion confirms carry
BeF — Bear Flag: down impulse → weak rallies; breakdown favors continuation lower
BeP — Bear Pennant: pause beneath resistance; release favors trend continuation
F / P: generic flag / pennant tags when the system can’t (or shouldn’t) over-specify
Standards aren’t decoration—they’re orders.
🧑🏫 Mentor A.K.
A.K. is the discipline behind this release.
No chasing. No gambling. No emotional entries.
He drilled one rule into everything: structure first, then execution—never the reverse.
This indicator exists to make that possible under pressure.
🤝 Give Forward (The Code of the Crew)
If this tool sharpens your edge:
Teach one trader how to read continuation properly (pole → base → trigger → invalidation)
Share process, not just screenshots (entry logic, stop logic, management plan)
If you build on open work: credit loudly and contribute improvements back when you can
Tools multiply force. Character decides the outcome.
👑 Respect to King Solomon (Wisdom > Impulse)
“Plans are established by counsel; by wise guidance wage war.” — Proverbs 20:18
Continuation trading is the same: impulse → formation → execution.
BK AK-Flag Formations — when the standard rises, the line advances.
Gd bless. 🙏


Gold Asia Session Highlighter [IST]Here is a polished description and guide for your Gold Asia Session Highlighter. You can use this text for a YouTube description, a Telegram post, or a PDF guide to explain the tool to others.
Gold Asia Session Highlighter (IST) | Visual Indicator
This is a custom TradingView indicator designed to simplify the Gold Asia Strategy. Instead of automating trades, this tool purely handles the visuals. It automatically highlights the correct Asia Session time window (adjusting for Winter/Summer hours) and marks the exact points where you should draw your Fixed Range Volume Profile (FRVP) tool.
Perfect for: Traders who prefer to draw their own FRVP levels manually but want to ensure they are using the exact, error-free time range every single day.
Features
✅ Automatic Time Zone: Strictly calculated using IST (Indian Standard Time), so you don't need to convert time zones manually.
✅ Smart Season Detection: Automatically switches between Winter Session (04:30 – 06:25) and Summer Session (03:30 – 05:25) based on the current month.
✅ Visual Guidance: Highlights the session background and places "START" and "END" labels on the exact candles.
✅ Zero Clutter: Clean visuals with no moving averages or strategy lines—just the session box.
How to Use It
Add to Chart: Apply the script to your Gold (XAUUSD) 5-minute chart. You will see a blue highlighted box appear during the Asia session.
Locate the Labels:
Look for the blue START label (bottom of the candle).
Look for the red END label (top of the candle).
Draw Your FRVP:
Select the Fixed Range Volume Profile tool from your TradingView toolbar.
Click exactly on the START candle.
Drag and release exactly on the END candle.
Trade: You now have the exact Value Area High (VAH), Value Area Low (VAL), and Point of Control (POC) for the day. Use your breakout strategy as usual!

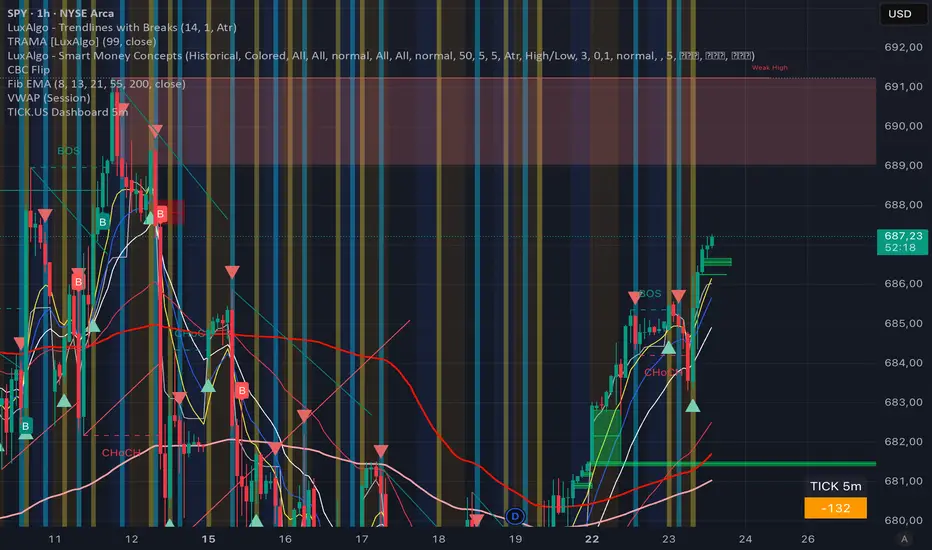
TICK.US Dashboard 5mIt's a very simple script, It displays the TICK.US Timeframe 5 mn on your template
Momentum Echo Oscillator [Community Edition]Concept: The Momentum Echo Oscillator (MEO) is a modern take on classical momentum oscillators. Most indicators only look at the "now". MEO introduces the concept of Momentum Echoes—historical momentum harmonics that are weighted and blended back into the current price velocity.
Why use MEO? Standard momentum tools (like ROC or RSI) can be very "jittery" or noisy. By integrating historical echoes, MEO provides a smoother, more rhythmic representation of price flow, making it easier to spot genuine trend reversals.
Key Elements:
Primary Momentum: The immediate speed of price.
Echo Harmonics: Two adjustable lookback points that act as a "memory" for the indicator, filtering out false breakouts.
Dynamic Histogram: Visualizes the gap between the Echo Engine and the Trigger Line, highlighting acceleration and deceleration.
Settings:
Echo Weight: Adjust how much "memory" you want the indicator to have.
Smoothing: Clean up the signals for higher timeframes.
This is an open-source tool for the TradingView community. Enjoy!

4MA / 4MA[1] Forward Projection with 4 SD Forecast Bands4MA / 4MA Projection + 4 SD Bands + Cross Table is a forward-projection tool built around a simple moving average pair: the 4-period SMA (MA4) and its 1-bar lagged value (MA4 ). It takes a prior MA behavior pattern, projects that structure forward, and wraps the projected mean path with four Standard Deviation (SD) bands to visualize probable future price ranges.
This indicator is designed to help you anticipate:
Where the MA structure is likely to travel next
How wide the “expected” future price corridor may be
Where a future MA4 vs MA4 crossover is most likely to occur
When the real (live) crossover actually prints on the chart
What you see on the chart
1) Live moving averages (current market)
MA4 tracks the short-term mean of price.
MA4 is simply the previous bar’s MA4 value (a 1-bar lag).
Their relationship (MA4 above/below MA4 ) gives a clean, minimal read on trend alignment and directional bias.
2) Projected MA path (forward curve)
A forward “ghost” of the MA structure is drawn ahead of price. This projected curve represents the indicator’s best estimate of how the moving average structure may evolve if the market continues to rhyme with the selected historical behavior window.
3) 4 Standard Deviation bands (predictive future price ranges)
Surrounding the projected mean path are four SD envelopes. Think of these as forecast corridors:
Inner bands = tighter “expected” range
Outer bands = wider “stress / extreme” range
These bands are not a guarantee—rather, they’re a structured way to visualize “how far price can reasonably swing” around the projected mean based on observed volatility.
4) Vertical projection lines (most probable cross zone)
Within the projected region you’ll see vertical lines running through the bands. These lines mark the most probable zone where MA4 and MA4 are expected to cross in the projection.
In plain terms:
The projected MAs are two curves.
When those curves are forecasted to intersect, the script marks the intersection region with a vertical line.
This gives you a forward “timing window” for a potential MA shift.
5) Cross Table (top-right)
The table is your confirmation layer. It reports:
Current MA4 value
Current MA4 value
Whether MA4 is above or below MA4
The most recent BUY / SELL cross event
When a real, live crossover happens on the actual chart:
It registers as BUY (MA4 crosses above MA4 )
Or SELL (MA4 crosses below MA4 )
…and the table updates immediately so you can confirm the event without guessing.
How to use it
Practical workflow
Use the projected SD bands as future range context
If price is projected to sit comfortably inside inner bands, the market is behaving “normally.”
If price reaches outer bands, you’re in a higher-volatility / stretched scenario.
Use vertical lines as a “watch zone”
Vertical lines do not force a trade.
They act like a forward “heads-up”: this is the most likely window for an MA crossover to occur if the projection holds.
Use the table for confirmation
When the crossover happens for real, the table is your confirmation signal.
Combine it with structure (support/resistance, trendlines, market context) rather than trading it in isolation.
Notes and best practices
This is a projection tool: it helps visualize a structured forward hypothesis, not a certainty.
SD bands are best used as forecast corridors (risk framing, range planning, and expectation management).
The table is the execution/confirmation layer: it tells you what the MAs are doing now.

tncylyv - Improved Delta Volume BubbleThis script is a specialized modification and structural upgrade of the excellent "Delta Volume Bubble " by tncylyv.
While the original tool provided a fantastic foundation for statistical volume analysis, this "Zero Float" Edition was built to solve specific visual challenges faced by active traders—specifically the issue of indicators "floating" or disconnecting from price when zooming in on lower timeframes.
The Straight Improvements
This version turns a "Signal Indicator" into a complete "Trading System" with five specific upgrades:
1. Visual Stability (The "Zero Float" Fix)
Original: Used complex coordinates that could desynchronize, causing bubbles to drift or float away from candles on fast charts (1m/5m).
My Upgrade: Implemented "Magnetic Anchoring." Labels and bubbles are now physically locked to the candle wicks. They never drift, overlap, or float, no matter how much you zoom or resize the chart.
2. Cognitive Load (The HUD)
Original: Displayed raw numbers inside colored circles, requiring you to memorize color codes.
My Upgrade: Replaced numbers with Semantic Text Labels (e.g., "ABSORB", "SQUEEZE", "MOMENTUM"). You can read the market intent instantly without decoding it.
3. Regime Adaptation (AI Engine)
Original: Used a fixed threshold (e.g., Z-Score > 2.0).
My Upgrade: Added an Adaptive Learning Window. The script scans recent volatility to automatically raise the threshold during choppy markets (filtering noise) and lower it during quiet sessions (catching subtle entries).
4. Market Memory (Smart Structure)
Original: Signals disappeared into history.
My Upgrade: Draws Support/Resistance Rails extending from major volume events. This helps you visualize exactly where institutions are defending their positions.
5. Robust Data Handling
My Upgrade: Added a Hybrid Fallback Engine. If granular 1-minute data isn't available (e.g., on historical charts), the script seamlessly switches to an estimation model so the indicator never "breaks" or disappears.
Core Logic
Z-Score Normalization: We don't look at raw volume; we look at statistical anomalies (Standard Deviations).
Absorption: Detects "Effort vs. Result"—high volume with tiny price movement (Trapped Traders).
Squeeze: Highlights areas where a breakout is imminent due to volatility compression.
Credits
Original Concept & Code: tncylyv (Delta Volume Bubble ). This script would not exist without his brilliant groundwork.
Modifications: Visual Anchoring, HUD Text System, AI Thresholding, and Structure Rails added in this edition.
This script is open-source to keep the spirit of the original author alive. Use it to understand the "Why" behind the move.

ZERO LANG Nube EMA 18-36 + Volumen EstrictoThis indicator is designed to show market trends using a cloud pattern. When the price retests the cloud and bounces back across it with high volume, it generates a buy signal, and vice versa when the price falls.
It uses the 18-period EMA and the 36-period EMA.

HS:- HA+BIAS📝 Daily Bias + Heikin Ashi Step Line (Notes)
1️⃣ Indicator Purpose
Combines Daily Market Bias with Heikin Ashi Average
Displays HA average as a STEP LINE WITH BREAKS
HA line changes color based on bias
Works on any timeframe
Bias logic is always calculated from Daily data
2️⃣ Heikin Ashi Calculation
Uses Heikin Ashi candles internally
Does not change chart candles
Formula used:
HA Average = (HA Open + HA Close) / 2
Provides a smoother price reference than normal candles
3️⃣ Daily Reference Levels
Uses previous day:
High
Low
These levels define market structure
Fetched using Daily timeframe regardless of chart timeframe
4️⃣ Positive Bias Condition (Bullish)
Bias becomes POSITIVE only when both conditions are true:
Today Close > Previous Day High
Today Low > Previous Day Low
📌 Indicates strong bullish control
5️⃣ Negative Bias Condition (Bearish)
Bias becomes NEGATIVE only when both conditions are true:
Today Close < Previous Day Low
Today High < Previous Day High
📌 Indicates strong bearish control
6️⃣ Bias Hold Rule (Most Important)
Bias does NOT flip frequently
Bias remains unchanged until:
Both opposite conditions are satisfied
Prevents false signals during sideways markets
Bias Values:
+1 → Positive
-1 → Negative
0 → Neutral
7️⃣ Bias Memory Concept
Bias is stored using a state variable
Previous bias is carried forward when no condition is met
Ensures stable trend direction

ATR 0.5x & 1x Distance (Horizontal)What this version does (no ambiguity)
Plots true horizontal dashed lines
One at ±0.5 × ATR
One at ±1.0 × ATR
Lines extend to the right (proper levels, not floating spaghetti)
ATR is calculated from the active chart timeframe
30m chart → 30m ATR
1H chart → 1H ATR
Clean, stable, no repainting tricks
Important detail (this matters for your strategy)
The lines are anchored to a reference price, which is currently configurable:
Default: close
You can change it to:
VAH
VAL
POC
Any plotted level
This is exactly what you want for:
“How far beyond value has price gone in ATR terms?”
How you’ll likely use this in practice
For your mean-reversion framework:
Anchor Reference Price = VAH or VAL
Treat:
0.5× ATR → probabilistic rejection zone
1.0× ATR → acceptance / thesis failure
No more eyeballing. No more dragging stops because “the candle looked angry.”

LJ Parsons Adjustable expanding MRT FibBased on premium/discount/fair-value levels the indicator will expand with the market by settable dates.
The levels are not fib based as such but are resonant levels within an multiplicative /12 log scale using the LJ Parsons Market resonance hypothesis.

TiRadarHUD Radar that provids for the ability to input manual levels in addition to tracking multiple EMAs.

Gaps IdentifierThis indicator identifies up and down Gaps using previous period's close price to the next period's open price. Potentially useful for Gap rebound strategies.
(Will identify gaps 4%–11% by default; can change in settings)


Risk Adjusted Geometric Exponent [VynthraQuant]RAGE Index (Risk-Adjusted Geometric Exponent)
Overview
The RAGE Index is a quantitative momentum oscillator that measures the efficiency and quality of an asset's price trend. Standing for Risk-Adjusted Geometric Exponent , this indicator goes beyond simple price action by evaluating the average logarithmic growth rate relative to the asset's volatility.
In institutional finance, it is not just about how much an asset moves, but how it moves. RAGE identifies trends that exhibit high compounding growth with minimal "noise" or volatility.
The Logic Behind RAGE
The indicator is built on two core quantitative pillars:
1. Geometric Exponent (GE): Instead of simple percentage changes, we calculate the geometric mean of log-returns. This represents the true compounding "velocity" of the price.
2. Volatility Normalization: We divide the GE by the standard deviation of returns (Volatility) over a specific lookback period.
How to Interpret the RAGE Index
* The Zero Line: The most critical level. When RAGE crosses above 0, the asset has entered a state of positive geometric growth. Below 0, the asset is in a state of efficient decay.
* Trend Quality: A rising RAGE value indicates that the trend is becoming more "efficient", growth is increasing while volatility is staying low or decreasing.
* Color-Coded Candles: The script features a `force_overlay` function that colors the candles on your main chart.
* Bullish Color: Efficient growth detected (Long bias).
* Bearish Color: Efficient decay detected (Short bias).
Key Features
* Logarithmic Accuracy: Uses log-returns to ensure time-additivity and eliminate the bias found in standard percentage calculations.
* Adaptive to Volatility: Unlike a standard RSI or MACD, RAGE penalizes "choppy" price action, helping you stay out of sideways markets.
* Optimized Performance: Written in Pine Script v6 with high-efficiency math to ensure fast loading even on lower timeframes.
Settings
* GE Lookback: The window used to calculate the average growth rate.
* Volatility Lookback: The window used to measure the "risk" or noise of the price action.
General Disclaimer
This indicator is for informational and educational purposes only. It does not constitute financial advice. The creator bears no responsibility for any financial decisions or losses resulting from its use. Past performance is not indicative of future results.
Islamic Disclaimer
All trading activity should be approached with awareness of halal and haram principles. Ensure your investments, instruments, and methods align with Islamic ethical standards. This tool does not promote speculative or impermissible practices.

Watchlist Auto Buy/Sell AlertsTrial for the best. This indicator is built to assess the chart and make it easier for traders to identify coins that are available for trading and minimize losses.

ICT ORB Killzones by MaxN (15 / 30m)Trading session London, Asia, New York
orb 15/30 min selectable breakout zones with buy/sell signals

HTF Fractal Boxes by TAAKOWhat This Indicator Does
This indicator displays higher timeframe (HTF) candlesticks as an overlay on your current chart, allowing you to see larger timeframe price action without switching charts.
Key Features:
Shows the last 3 completed HTF candles (configurable)
Displays a 4th candle with dashed lines showing the current forming HTF bar
Each candle includes full OHLC data: body (open/close) and wicks (high/low)
Candles are color-coded: green for bullish, red for bearish, blue for neutral
Positioned on the right side of your chart for easy reference
Automatically scales with your Y-axis price movements

Volume + VWAP + Prior Session Levels DashboardVolume Spike + VWAP + Session Levels Dashboard
This indicator is a real-time market context dashboard designed to help traders quickly understand participation, value, and key reference levels without cluttering the chart with multiple indicators.
Instead of plotting lines or signals, the script summarizes critical intraday information into a compact on-chart table, allowing traders to make faster, more informed decisions based on how active the market is, where fair value is, and where important reference levels exist.
Core Concepts Used
This script is built on three widely used market principles:
Relative Volume Participation
Volume-Weighted Average Price (VWAP)
Prior Session Reference Levels
The indicator does not attempt to predict direction. Its purpose is to provide objective context that traders can combine with their own strategies.
How the Indicator Works
1. Volume Spike Analysis (Relative Volume)
Rather than showing raw volume, the script measures how unusual the current bar’s volume is compared to recent activity.
A moving average of volume is calculated using a user-defined lookback period.
Current volume is divided by this average to produce a volume multiple (for example, 2.0× normal volume).
This multiple is translated into a descriptive strength label, ranging from Below Threshold to Legendary.
This approach helps traders immediately recognize when participation is significantly above normal, which often coincides with institutional activity, breakouts, or important reactions near key levels.
2. Daily VWAP (Current and Prior Day)
VWAP (Volume-Weighted Average Price) represents the average price traded, weighted by volume, and is commonly used as a measure of fair value.
This script calculates VWAP internally by:
Accumulating price × volume throughout the day
Dividing by total volume
Automatically resetting at the start of each new trading day
The dashboard displays:
Current day VWAP – real-time session fair value
Prior day VWAP – an important reference from the previous session
Traders often use these levels to evaluate whether price is trading at a premium, discount, or near equilibrium.
3. Previous Day High and Low
The indicator also displays:
Previous day high
Previous day low
These levels frequently act as liquidity targets, support/resistance zones, or reaction points, especially during intraday trading sessions.
Dashboard Design
All information is presented in a two-column dashboard showing:
Metric name
Current value or status
The dashboard can be positioned in any corner of the chart and updates in real time, allowing traders to maintain awareness without constantly switching indicators or timeframes.
How to Use This Indicator
This script is best used as a decision-support tool, not a standalone trading system.
Typical uses include:
Identifying abnormally high volume near important price levels
Evaluating price position relative to VWAP
Monitoring reactions around prior day highs and lows
Staying oriented during fast market conditions without chart clutter
The indicator works on any timeframe and adapts automatically to the instrument’s trading session.
Customization Options
Users can:
Adjust the volume moving average length to define what “normal” volume means
Choose the price source used for VWAP calculation
Change the dashboard’s on-screen position
Summary
The Volume Spike + VWAP + Session Levels Dashboard provides a clear, objective snapshot of market conditions by combining participation, value, and reference levels into a single visual tool. It is designed to help traders answer a simple but critical question:
“Is the market doing something meaningful right now — and where?”
This indicator focuses on context, clarity, and usability for traders who want insight without unnecessary complexity.
