SR Channel + EMA + RSI MTF + VolHighlightSR + Volume + RSI MTF – edited by Mochi
This indicator combines three tools into a single script:
SR Zones from Pivots
Automatically detects clusters of pivot highs/lows and groups them into support and resistance zones.
Zone width is tightened using a percentage of the pivot cluster range so levels are more precise and cleaner.
Each zone includes:
A colored box (SR area),
A dashed midline,
A POC line (price level with the highest traded volume inside the zone),
A label showing the zone price and distance (%) from current price.
Zone color is dynamic but simple and stable:
If price closes below the mid of the zone → it is treated as resistance (red).
If price closes above the mid of the zone → it is treated as support (green).
Box, lines, and label always share the same color.
Volume Inside the Zone + POC
Calculates buy/sell volume for candles whose close lies inside each zone.
Uses abs(buyVol − sellVol) / (buyVol + sellVol) to measure volume imbalance and control box opacity:
Stronger, more one‑sided volume → darker box (stronger zone).
POC is drawn as a thin line with the same color as the zone to highlight the best liquidity level for entries/TP.
Multi‑Timeframe RSI Dashboard
Shows RSI(14) values for multiple timeframes (1m, 5m, 15m, 30m, 1h, 4h, 8h, 1d), each can be toggled on/off.
Background color of each RSI cell:
RSI > 89 → red (strong overbought),
80–89 → orange (warning area),
RSI < 28 → lime (strong oversold),
Otherwise → white (neutral).
The goal of this script is to give traders a clear view of:
Key support/resistance zones,
Their volume quality and POC,
And multi‑TF overbought/oversold conditions via the RSI dashboard – all in one indicator to support retest/flip‑zone trading.
Indikator dan strategi

ABC Pro Ultimate S/RABC Pro Ultimate is a high-precision trading tool designed to identify harmonic ABC (Zigzag) patterns and combine them with institutional Support & Resistance levels. Unlike standard indicators that clutter your chart with noise, this script filters for high-relevance pivot points from the distant past to provide truly meaningful trade setups.

High/Low Tracker (Dual Sessions)VV4High and lows in 2 timeframes
16:00 -> 03:55
19:30 -> 02:55
Toggle on/off of
- Auto extending untill 09:25
- Live updating during price action
Configure linestyles, box styles
It is now displaying correctly for both CL and ES

High/Low Tracker (Dual Sessions)V4High and lows in 2 timeframes
16:00 -> 03:55
19:30 -> 02:55
Toggle on/off of
- Auto extending untill 09:25
- Live updating during price action
Configure linestyles, box styles
It is now displaying correctly for both CL and ES

Multiple Time Frame Stoch-RSIThis indicator is designed to show users the values for default stochastic RSI and default RSI settings across multiple time frames.
I have made many bad trades focusing too closely on one particular time frame and indicators that suggest the price will move one way, to be superseded by a higher timeframe pushing price in another direction.
The timeframes are customisable so you can select your own timeframes, but the default timeframes chosen here are part of the BareNaked Crypto or Naked Nation strategy, looking at timeframes in multiples of 3 for lower timeframes.
The idea in its simplest form is that when timeframes like the 3/6/9m are all over sold or over bought (coloured red or green) then it could be a suitable time to place an order. Or at least be more favourable for your trade.
This indicator as with all indicators is designed as a tool to add to whatever arsenal of strategy or tools you are already using and does not constitute financial advice, just be cause 3/6/9m is in red or green does not guarantee that the trade will go your way.
The orange on the timeframes are generally designed to show users where price can reverse so for example if the stochastic 3m is at 10 and in green, but the 9m is at 65 in orange, it could be that a push up is not finished and the 9m drop from oversold to 65 could be reversed due to a low 3m stochastic number and then 9m goes from 65 back up to 100, and vice versa.
The arrows for direction also allow you to quickly deduce the direction of the stochastic RSI, ^ up, V down, and stable -. this should allow you to see if the stochastic has been rising and is beginning to turn around or not.

Overnight Gap - Close to Open - TF PascalCalculates the percentage change in the opening price of the candle above relative to the closing price of the previous candle.
Not available for S&P500 CFDs.
Can be used for cash prices such as TVC's SPX for the S&P500.

King Trade 4-hour buy/sell strategyThis is a buy/sell system for 4-hour candlestick charts. For best results, use it on Heiken Ashi candlestick charts.

Early Trend Warning Using MTF AnalysisAs an active trader and software professional, I build my own indicators. I built this one today which I want to share with fellow traders.
If you are a trend trader then HTF/MTF analysis is very critical. It is virtually impossible to constantly track multiple tickers all the time. One should not take a buy trade when MTF is bearish and vice versa. This indicator solves this problem.
The EMA Trend Warning indicator helps traders detect potential trend changes early by analyzing price interactions with multi-timeframe Exponential Moving Averages (EMAs) and their momentum. It sends instant alerts when price crosses above or below EMAs with supporting momentum, making it easier to capture bullish or bearish moves.
The EMA Trend Warning indicator detects potential trend changes by monitoring price against 14-period EMAs on multiple timeframes: 15-minute, 30-minute, and 1-hour charts. It sends alerts when the price crosses above or below the EMA with supporting momentum, helping traders identify early bullish or bearish signals.
How It Works:
1. Calculates 14-period EMA on 15m, 30m, and 1H charts.
2. Computes EMA slopes to determine momentum direction.
3. BUY alert triggers when price crosses above the 15m EMA and at least one EMA slope is upward.
4. SELL alert triggers when price crosses below the 15m EMA and at least one EMA slope is downward.
5. Alerts fire once per bar and track previous state to avoid repeated notifications.
Features:
1. Multi-timeframe EMA monitoring.
2. Momentum confirmation with EMA slopes.
3. Instant BUY/SELL alerts.
4. Tracks previous trend state to prevent alert spam.
Benefits:
1. Detects trend changes early for better entry timing.
2. Confirms trend across multiple timeframes.
3. Saves time with automated alerts.
4. Helps traders align trades with market momentum.
Please consider this indicator as EARLY WARNING ONLY. Take trade based on multiple confluences post receiving any warning. I have tested it on BTCUSD since yesterday, multiple warning alerts were 100% perfect.

RSI Strategy with Auto Tuner (PF)# RSI Auto‑Tuner Strategy — How To Use
This document explains **how to use** the RSI Auto‑Tuner strategy. It intentionally avoids math and implementation details. Follow this as an operating guide.
---
## 1. What This Tool Is For
This strategy helps you:
* Discover **which RSI length works best** on a given ticker and timeframe
* Measure performance using **Profit Factor (PF)**
* Improve RSI performance on noisy markets by **transforming price first**
The auto‑tuner is a **research tool**, not a live trading signal generator.
---
## 2. Two Modes You Must Treat Differently
### Research Mode
Used to explore and discover parameters.
* Auto‑Tune: **ON**
* Parameters are allowed to change
* Results may look very good
* Overfitting risk is real
### Trading Mode
Used for forward testing or live trading.
* Auto‑Tune: **OFF**
* Parameters are fixed
* Behavior is stable and repeatable
* This is the only acceptable mode for live use
**Never trade live with Auto‑Tune enabled.**
---
## 3. Manual Mode (Trading Mode)
Use this after parameters are finalized.
Steps:
1. Set **Auto‑Tune = OFF**
2. Choose:
* Source (raw price or transformed price)
* RSI Length (manual, default 14)
* Oversold / Overbought levels
3. The strategy will:
* Enter long when RSI crosses up through Oversold
* Enter short when RSI crosses down through Overbought
* Flip positions on opposite signals
This mode is predictable and safe for forward testing.
---
## 4. Auto‑Tune Mode (Research Mode)
Use this to find optimal RSI lengths.
Steps:
1. Set **Auto‑Tune = ON**
2. Configure the search range:
* Minimum Length (default 5)
* Maximum Length (default 14)
* Step Size (default 1)
3. The strategy will:
* Internally simulate trades for each RSI length
* Track gross profit, gross loss, and trades
* Select the length with the highest Profit Factor
4. The best length is applied automatically
Auto‑Tune evaluates historical data only.
---
## 5. Using a Transform on Price (Critical)
RSI does **not** have to run on raw price.
You can significantly improve results by:
* Applying a **price transform** first
* Feeding the transformed series into the RSI Source input
Examples of transforms:
* Moving averages
* Low‑pass filters
* Butterworth filters
* Any smoother or denoiser
Why this works:
* Busy, wicky markets cause RSI to whipsaw
* Transforms remove micro‑noise
* RSI responds to structure instead of chaos
* Profit Factor often increases dramatically
Best practice:
* Auto‑tune on raw price
* Auto‑tune on transformed price
* Compare PF, trade count, and stability
---
## 6. Reading the Status Label
At the last bar, the on‑chart label shows:
* Whether Auto‑Tune is ON or OFF
* Whether candidates were built successfully
* Number of RSI lengths tested
* Best RSI length found
* Profit Factor and trade count
If Auto‑Tune is OFF, the label shows the manual length.
---
## 7. Recommended Workflow
1. Choose ticker and timeframe
2. Enable Auto‑Tune on **raw price**
3. Record best RSI length and PF
4. Enable Auto‑Tune on **transformed price**
5. Compare results
6. Lock parameters
7. Disable Auto‑Tune
8. Forward test
---
## 8. Warnings and Discipline
* High PF with few trades is unreliable
* Transforms can hide execution costs
* Always validate on a different period
* Auto‑Tune is a **lens**, not an edge
Treat this tool as a research microscope, not an autopilot.

Rolling Cumulative Volume Delta (N bars)Rolling CVD, not anchored to a date and reset after anchor+period reached

Multi-Fractal Trading Plan [Gemini] v22Multi-Fractal Trading Plan
The Multi-Fractal Trading Plan is a quantitative market structure engine designed to filter noise and generate actionable daily strategies. Unlike standard auto-trendline indicators that clutter charts with irrelevant data, this system utilizes Fractal Geometry to categorize market liquidity into three institutional layers: Minor (Intraday), Medium (Swing), and Major (Institutional).
This tool functions as a Strategic Advisor, not just a drawing tool. It calculates the delta between price and structural pivots in real-time, alerting you when price enters high-probability "Hot Zones" and generating a live trading plan on your dashboard.
Core Features
1. Three-Tier Fractal Engine The algorithm tracks 15 distinct fractal lengths simultaneously, aggregating them into a clean hierarchy:
Minor Structure (Thin Lines): Captures high-frequency volatility for scalping.
Medium Structure (Medium Lines): Identifies significant swing points and intermediate targets.
Major Structure (Thick Lines): Maps the "Institutional" defense lines where trend reversals and major breakouts occur.
2. The Strategic Dashboard A dynamic data panel in the bottom-right eliminates analysis paralysis:
Floor & Ceiling Targets: Displays the precise price levels of the nearest Support and Resistance.
AI Logic Output: The script analyzes market conditions to generate a specific command, such as "WATCH FOR BREAKOUT", "Near Lows (Look Long?)", or "WAIT (No Setup)".
3. "Hot Zone" Detection Never miss a critical test of structure.
Dynamic Alerting: When price trades within 1% (adjustable) of a Major Trend Line, the indicator’s labels turn Bright Yellow and flash a warning (e.g., "⚠️ WATCH: MAJOR RES").
Focus: This visual cue highlights the exact moment execution is required, reducing screen fatigue.
4. The Quant Web & Markers
Pivot Validation: Deep blue fractal markers (▲/▼) identify the exact candles responsible for the structure.
Inter-Timeframe Web: Faint dotted lines connect Minor pivots directly to Major pivots, visualizing the "hidden" elasticity between short-term noise and long-term trend anchors.
5. Enterprise Stability Engine Engineered to solve the "Vertical Line" and "1970 Epoch" glitches common in Pine Script trend indicators. This engine is optimized for Futures (NQ/ES), Forex, and Crypto, ensuring stability across all timeframes (including gaps on ETH/RTH charts).
Operational Guide
Consult the Dashboard: Before executing, check the "Strategy" output. If it says "WAIT", the market is in chop. If it says "WATCH FOR BOUNCE", prepare your entry criteria.
Monitor Hot Zones: A Yellow Label indicates price is testing a major liquidity level. This is your signal to watch for a rejection wick or a high-volume breakout.
Utilize the Web: Use the faint web lines to find "confluence" where a short-term pullback aligns with a long-term trend line.
Configuration
Show History: Toggles "Ghost Lines" (Blue) to display historical structure and broken trends.
Fractal Points: Toggles the geometric pivot markers.
Hot Zone %: Adjusts the sensitivity of the Yellow Warning system (Default: 1%).
Max Line Length: A noise filter that removes stale or "spiderweb" lines that are no longer statistically relevant.

Mod_Capital-Fibo🔥 Mk_Suhropbek_Fibo — Smart Fibonacci Trading Tool 🔥
Everyone draws Fibonacci.
Only professionals use it correctly.
💎 Mk_Suhropbek_Fibo is an automated Fibonacci indicator that analyzes real market structure and displays only high-probability levels.
📊 How it works:
— Analyzes the last 100 candles
— Automatically detects market trend (BUY / SELL)
— Draws Fibonacci levels in the correct direction
— Clearly marks 0 / 0.236 / 0.382 / 1 / 1.618 (TP)
⏱ Designed for H1 and higher timeframes
✔️ No noisy scalping
✔️ Clean and readable charts
✔️ Suitable for real accounts and prop firms
🔄 Updates only every 25 bars
— Keeps the chart clean
— No constant redrawing
— Focus on quality setups, not quantity
🎯 One setup = a complete trading scenario
— Clear structure
— Logical profit target (1.618)
— No counter-trend trades
📈 Proven market logic
— No overfitting
— Reusable, consistent behavior
— Discipline over emotions
🧠 Who is this indicator for?
✔️ Traders who use Fibonacci seriously
✔️ Those tired of guessing where to draw fib levels
✔️ Traders who treat trading as a business
🚫 No random entries
✅ Clear system
✅ Structured trading
📌 Mk_Suhropbek_Fibo — not prediction, but calculation.

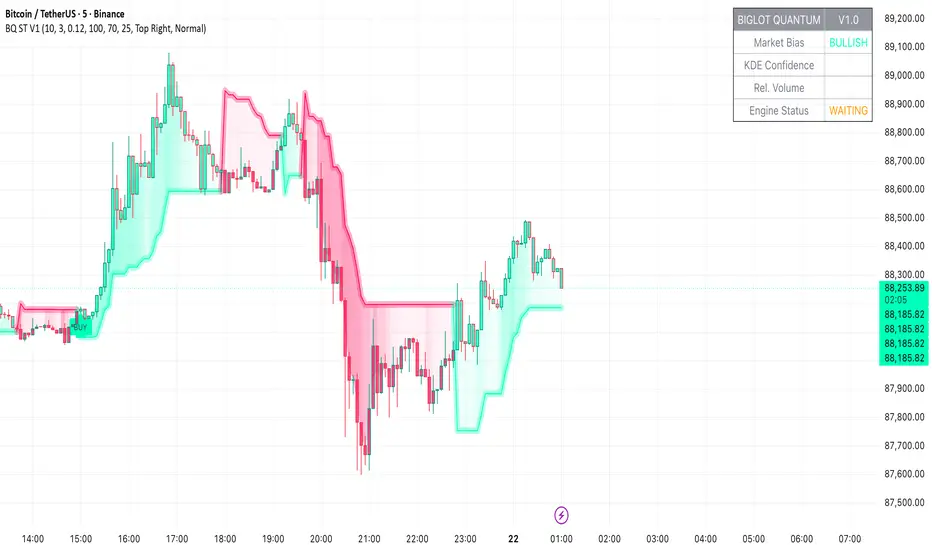
BigLot Quantum SuperTrend V1BigLot Quantum SuperTrend V1 is a trend-following indicator that enhances the traditional SuperTrend by integrating statistical volume analysis.
The script combines an ATR-based SuperTrend engine with Kernel Density Estimation (KDE) applied to relative buy and sell volume. Volume behavior is modeled statistically, allowing the indicator to filter breakout signals and activate only when volume conditions show high probability compared to historical data.
Bullish and bearish signals are generated when price crosses the SuperTrend line and the corresponding volume probability exceeds a user-defined threshold. This approach helps reduce false signals during low-liquidity or sideways market conditions.
The script includes visual trend highlighting, probability-based confidence filtering, and a real-time dashboard displaying trend direction, volume strength, and signal status. It is designed to work across all markets and timeframes without repainting.
SR Channel + EMA + RSI MTF + VolHighlight - Edited by MochiSR + Volume + RSI MTF – edited by Mochi
This indicator combines three tools into a single script:
SR Zones from Pivots
Automatically detects clusters of pivot highs/lows and groups them into support and resistance zones.
Zone width is tightened using a percentage of the pivot cluster range so levels are more precise and cleaner.
Each zone includes:
A colored box (SR area),
A dashed midline,
A POC line (price level with the highest traded volume inside the zone),
A label showing the zone price and distance (%) from current price.
Zone color is dynamic but simple and stable:
If price closes below the mid of the zone → it is treated as resistance (red).
If price closes above the mid of the zone → it is treated as support (green).
Box, lines, and label always share the same color.
Volume Inside the Zone + POC
Calculates buy/sell volume for candles whose close lies inside each zone.
Uses abs(buyVol − sellVol) / (buyVol + sellVol) to measure volume imbalance and control box opacity:
Stronger, more one‑sided volume → darker box (stronger zone).
POC is drawn as a thin line with the same color as the zone to highlight the best liquidity level for entries/TP.
Multi‑Timeframe RSI Dashboard
Shows RSI(14) values for multiple timeframes (1m, 5m, 15m, 30m, 1h, 4h, 8h, 1d), each can be toggled on/off.
Background color of each RSI cell:
RSI > 89 → red (strong overbought),
80–89 → orange (warning area),
RSI < 28 → lime (strong oversold),
Otherwise → white (neutral).
The goal of this script is to give traders a clear view of:
Key support/resistance zones,
Their volume quality and POC,
And multi‑TF overbought/oversold conditions via the RSI dashboard – all in one indicator to support retest/flip‑zone trading.

Rango Pre-Apertura (8am-9am)Overview
This indicator is specifically designed for the index trading community, with a focus on US30 (Dow Jones). It centers on the concepts of "Capital Injection" and "Opening Traps," automatically identifying the most critical liquidity levels prior to the New York Open (09:30 AM EST).
Indicator Logic
The script operates on the premise that the range formed between 08:00 AM and 09:00 AM EST acts as a key accumulation or manipulation zone before the official session. By marking these levels, traders can visualize where institutional algorithms are likely to seek liquidity before the day’s primary expansive move begins.
Key Features
08:00 - 09:00 AM Range: Automatically calculates and projects the exact High and Low of this pre-market window.
Previous Day Levels (PDH/PDL): Identifies the Previous Day High and Low as primary zones for External Liquidity (BSL/SSL).
Visual Clarity: Lines are projected only until 01:00 PM EST to keep the chart clean for post-session analysis.
Professional Styling: Uses non-continuous plots to avoid visual noise and diagonal line "bleeding" between trading days.
How to Trade with this Script
Mapping: Identify whether the price opens above or below the 8:00 AM range.
The Trap: Look for liquidity sweeps (Stop Runs) of the marked lines exactly at 09:30 AM.
Confirmation: Combine this indicator with price action to detect "Force Invalidations" (Engulfing patterns) at H1 or H4 Points of Interest (POI).

Anurag -Precision Options Scalper [Multi-TF] -A professional-grade options day trading system built for SPY, QQQ, and SPX.
CORE FEATURES:
- Multi-timeframe analysis (15m regime → 5m setup → 1m execution)
- Market regime detection using ADX + ATR Z-Score (filters out chop)
- Confidence scoring system (0-100) — only takes high-probability setups
- Auto DTE engine recommends 0DTE vs 1DTE based on conditions
- Suggested strike prices (slightly OTM)
- Built-in position tracking with stop/target levels
- Session filtering (9:30 AM - 4:00 PM ET only)
- End-of-day forced exit warning
SIGNAL LOGIC:
CALL: 15m bullish bias + trending regime + price above VWAP/EMAs + pullback to support + bullish candle + 1m momentum confirmation
PUT: 15m bearish bias + trending regime + price below VWAP/EMAs + rejection from resistance + bearish candle + 1m momentum confirmation
RISK MANAGEMENT:
- ATR-based stops and targets
- Break-even stop movement after partial profit
- Time-based exit if momentum dies
- Max 4 trades per day (configurable)
- Gamma scalp mode for 0DTE (tighter stops/targets)
BEST ON: 5-minute chart | SPY, QQQ, SPX
STYLE: Pullback entries in trending markets
⚠️ For educational purposes. Not financial advice. Manage your own risk.

Manipulation Candle (RIC) V0.2Interpretation and Trading Use
Boxed Candles: Represent 15-minute periods with unusually high range relative to daily volatility. These may signal:
Market manipulation (e.g., stop hunts or fakeouts).
Breakouts, reversals, or high-impact news.
Entry/exit points in strategies focusing on volatility expansion.
No Boxes: Indicates normal or low-volatility candles (range < threshold).
Multi-Timeframe Analysis: On lower timeframes (e.g., 5-min), boxes encompass multiple bars. On higher (e.g., 1-hour), they highlight specific 15-min segments.
Example: On a volatile stock like TSLA, a 0.2 multiplier might highlight candles during earnings releases, aiding in spotting trading opportunities.
Limitations and Considerations
Drawing Limits: TradingView caps drawing objects at ~500 per script. On long histories, older boxes may not load—zoom in or reduce chart bars.
Data Availability: Requires 15-minute and daily data; may not work on illiquid symbols or non-standard charts (e.g., Renko).
Real-Time Delays: Boxes appear only after 15-min closes; no intra-bar drawing.
No Alerts Built-In: Add custom alerts via TradingView's alert system (e.g., on condition changes).
Performance: Efficient, but on very low timeframes with long history, it may use more resources due to persistent boxes.
Customization: For extensions (e.g., labels, multiple timeframes), modify the code carefully in Pine Script® v6 to avoid errors.
Version History
V0.2: Added persistent historical boxes; refined new candle detection.
Future Updates: Potential additions like box limits or multi-multiplier support. Check for updates in the script comments.
If you encounter issues or need customizations, refer to TradingView's Pine Script® documentation or community forums. For error-free extensions in Pine Script® v6, ensure proper variable scoping, type declarations, and testing on historical data.


Dynamic EMA Trend Table [Customizable]Overview
The Dynamic EMA Trend Table is a comprehensive dashboard designed to give traders an instant overview of the market trend across five distinct Exponential Moving Averages (EMAs). Instead of cluttering your chart with multiple lines, this script organizes the data into a clean, customizable table, allowing you to assess trend alignment at a glance.
How It Works
This indicator calculates five user-defined EMAs (defaulting to the popular 5, 20, 50, 100, and 200 periods). It then compares the Current Price against each EMA value to determine the immediate trend status:
Bullish State: When the current price is above the specific EMA, the table cell turns Green (customizable).
Bearish State: When the current price is below the specific EMA, the table cell turns Red (customizable).
This logic allows swing traders and scalpers to instantly see if the asset is in a strong uptrend (all cells Green), a strong downtrend (all cells Red), or a consolidation phase (mixed colors).
Key Features
Fully Customizable Periods: Change the length of all 5 EMAs to fit your specific strategy (e.g., Fibonacci numbers or standard Swing Trading settings).
Dynamic UI: Position the table anywhere on the screen (Top/Bottom/Left/Right) and adjust the size to fit your screen resolution.
Visual Cleanliness: You can choose to show the table only, or toggle the "Show EMAs on Chart" option to plot the actual lines on your chart.
Smart Coloring: The lines on the chart (if enabled) inherit the same color logic as the table—turning Green when price is above them and Red when price is below.
Settings & Configuration
Price Source: Select Close, High, Low, etc. (Default is Close).
Table Position & Size: Customize where the dashboard appears.
EMA Lengths: Set your 5 preferred lookback periods.
Color Theme: Fully adjustable colors for Bullish, Bearish, Neutral, and Background elements to match your chart theme (Dark/Light mode friendly).
Use Case Example
Trend Confirmation: A trader looking for a "Buy" entry might wait for the short-term EMAs (5 and 20) and the medium-term EMA (50) to all turn Green in the table before entering.
Support/Resistance Watch: By quickly glancing at the values in the table, you can see exactly where the 200 EMA sits without needing to scroll back on your chart to find the line.

High Vol Big Move (Up or Down)Nine million EP with 4% stock moved up or down, and today's volume is more than yesterday's volume.

Interest ZonesThis indicator automatically identifies and plots "Interest Zones" around significant pivot highs and lows, representing potential areas of institutional interest, support/resistance, or accumulation/distribution. Zones are dynamically merged when pivots cluster near the same price level and extended for visibility.
How It Works (Technical Methodology)
Pivot Point Detection
The indicator uses Pine Script's ta.pivothigh() and ta.pivotlow() with asymmetric left/right lengths (default left=20, right=13) to detect swing highs and lows. This allows for customizable sensitivity – longer left for stronger confirmation, shorter right for faster detection.
Zone Start Condition (Filtering)
Multiple modes control from which point in history zones begin to be drawn:
"None": All historical pivots (limited by max zones).
"Auto (Start of Day)": Zones only from the beginning of the current trading day (resets daily).
"Manual Date": User-defined fixed date.
"Interactive (Chart)": User-confirmed date via input (useful for backtesting specific periods).
"Last X Bars": Only pivots within the last user-defined number of bars (default 400).
A vertical line marks the start point in date-based modes for visual reference.
Zone Construction
For each valid pivot:
Zone thickness is based on ATR(14) × user-defined multiplier (default 0.3) for dynamic, volatility-adjusted height.
Pivot High zones: Centered below the high (potential supply/resistance).
Pivot Low zones: Centered above the low (potential demand/support).
Zones are drawn as boxes extending to the right, with gray fill and border.
Merge & Overlap Logic
When a new pivot falls inside an existing zone or is very close (within user-defined "Proximity Sensitivity %" of the zone's midpoint, default 1.1%):
The new pivot is merged into the existing zone.
A counter ("x2", "x3", etc.) is displayed on the zone, indicating how many pivots have clustered there.
The zone is strengthened visually (counter text) and extended further right.
This highlights high-interest levels where price repeatedly reversed.
Zone Management
In "None" mode: Only the most recent user-defined max zones are kept (default 5) – oldest deleted automatically.
In other modes: Up to ~490 zones (performance limit), oldest pruned if exceeded.
All zones auto-extend to the right on the last bar for continuous visibility.
Visual Elements
Uniform gray color for all zones (configurable).
Transparent background fill (adjustable).
Counter text in white (configurable) when zones have multiple touches.
Clean, non-directional design – focuses purely on clustered reversal points.
How to Use
Interest Zones highlight price levels where the market has shown repeated respect through multiple swing pivots – often coinciding with institutional order clusters, psychological levels, or hidden support/resistance.
Higher counter values ("x3+", "x5+"): Stronger zones – higher probability of reaction on retest.
Use for:
Potential reversal or bounce areas when price approaches a zone.
Confluence with other tools (order blocks, FVG, volume profile, etc.).
Stop-loss placement beyond zones or take-profit at opposite zones.
Daily reset ("Auto Start of Day"): Ideal for intraday trading – fresh zones each session.
Backtesting: Use "Manual" or "Interactive" date modes to analyze specific historical periods.
"Last X Bars": Good for medium-term swing analysis without full history clutter.
Adjust ATR multiplier for tighter (lower) or wider (higher) zones based on asset volatility. Increase proximity sensitivity for more aggressive merging in ranging markets.
Combine with trend direction, volume, or higher-timeframe structure for best results.
Disclaimer
This indicator is a technical analysis tool and should be used in conjunction with other forms of analysis. Past performance does not guarantee future results. Always use proper risk management.

