Gap & Crap Detector V1Gap & Crap Detector (5% Gap Detector + % Labels)
This indicator automatically detects stocks that gap up ≥ 5% (adjustable) from the previous day’s close and tracks whether the move holds or fails over the next three candles.
🔍 How It Works
Yellow % Label → Appears on every candle that gaps up ≥ 5%, showing the exact percentage gap.
Gap & Go (Green Label) → Triggers when the next 3 candles close above the gap-day low, signaling momentum continuation.
Gap & Crap (Red Label) → Triggers immediately if any of the next 3 candles close below the gap-day low, signaling momentum failure.
⚙️ Inputs & Customization
Gap % Threshold – Default 5% (adjustable)
Label Size – Tiny / Small / Normal / Large / Huge
Opacity Controls – Independently set transparency for yellow, red, and green labels
Gap & Go Offset – Adjust how high above the candle the green label appears
🧠 Usage
Use this tool to identify breakout gaps and verify whether price action confirms (Gap & Go) or fails (Gap & Crap).
Ideal for momentum traders, swing traders, Ovtlyr Plan M, and gap strategy backtesting.
Ovtlyr

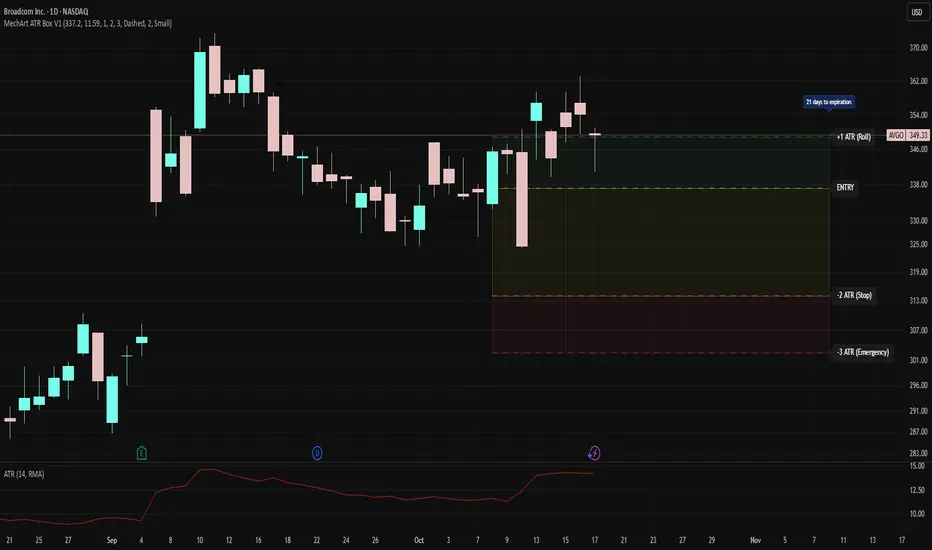
MechArt ATR Box V1MechArt ATR Box V1
Description:
The MechArt ATR Box V1 is a precision trade-planning and risk-management tool that visualizes your entire position framework using customizable ATR-based zones.
It automatically plots your key decision levels from a defined entry price and ATR value — helping you clearly see when to roll, hold, or exit a trade.
Features:
Configurable ATR multipliers for roll, stop, and emergency zones.
Automatically updates labels and price levels based on your custom ATR settings.
Distinct color-coded boxes for:
✅ +1 ATR (Roll Zone) – visualize profit or roll targets.
⚠️ –2 ATR (Stop Zone) – manage risk boundaries.
🚨 –3 ATR (Emergency Stop) – mark hard exit thresholds.
Adjustable ATRs, line style, width, color, and opacity for visual clarity.
Optional Days Until Expiration label for time-sensitive trades.
Ideal for:
Traders using mechanical, ATR driven systems (like OVTLYR Plan M), or anyone who wants a clear, rule-based visualization of risk vs. reward directly on the chart.