[BTCUSD] Multi Entries Autotrade BinanceCommission = 4 USD per order >>> check in the Performance Summary
Slippage = 2 ticks
- I see from Kodify (tradingview.com/pine-wizards)
Risk: 1% per trade >>> check at the "List of trades"
* Auto trade BINANCE FUTURE by Webhook + Pro, Pro+, Premium Tradingview user.
Binance future quantity setting:
- Fixed Quantity = 0 => Auto quantity (Balance, risk, pips loss)
- Fixed Quantity > 0 (0.001, 0.002, 0.01,...) => send signal with Fixed Quantity
H4 timeframe is main trend: Supertrend indicator.
- Uptrend when closes candle is below the red line
- Downtrend when closes candle is above the green line
H1 timeframe: Keltner Color count & RSI indicator:
- Keltner Color Count input:
- Length = 50
- Multi1 = 1
- Multi2 = 2
- Multi3 = 3
- Source = Close
- Lookback = 25
- RSI input: Length: 14, Source: Close
I. Entry 1: BASIS KELTNER CHANNEL
- BUY when previous OHLC4 candle crossover Basis line AND Supertrend H4 uptrend AND Keltner channels uptrend. Not repaint.
- SELL when previous OHLC4 candle crossunder Basis line AND Supertrend H4 downtrend AND Keltner channels downtrend. Not repaint.
II. Entry 2: UPPER 2/LOWER 1 KELTNER CHANNEL
- BUY when previous OHLC4 candle crossunder Upper 1 AND Supertrend H4 uptrend AND Keltner channels uptrend AND rsi uptrend. Not repaint.
- SELL when previous OHLC4 candle crossover Lower 1 AND Supertrend H4 downtrend AND Keltner channels downtrend AND rsi downtrend. Not repaint.
III. Entry 3: SELL UPPER 2/ BUY LOWER 1 KELTNER CHANNEL
- BUY when previous OHLC4 candle crossover Lower 1 AND Supertrend H4 uptrend AND Keltner channels uptrend AND rsi uptrend. Not repaint.
- SELL when previous OHLC4 candle crossunder Upper 1 AND Supertrend H4 downtrend AND Keltner channels downtrend AND rsi downtrend. Not repaint.
IV. Report all history BTCUSD (H1 timeframe)
- 01/01/2019 - 20/11/2021
- 01/01/2018 - 01/01/2021
- 01/01/2017 - 01/01/2020
- 01/01/2016 - 01/01/2019
- 01/01/2015 - 01/01/2018
- 01/01/2014 - 01/01/2017
- 01/01/2013 - 01/01/2016
- 01/01/2012 - 01/01/2015
Osilator
ETHUSD Multi Entries Autotrade BinanceCommission = 4 USD per order >>> check in the Performance Summary
Slippage = 2 ticks
- I see from Kodify (tradingview.com/pine-wizards)
Risk: 1% per trade >>> check at the "List of trades"
* Auto trade BINANCE FUTURE by Webhook + Pro, Pro+, Premium Tradingview user.
Binance future quantity setting:
- Fixed Quantity = 0 => Auto quantity (Balance, risk, pips loss)
- Fixed Quantity > 0 (0.001, 0.002, 0.01,...) => send signal with Fixed Quantity
H4 timeframe is main trend: Supertrend indicator.
- Uptrend when closes candle is below the red line
- Downtrend when closes candle is above the green line
H1 timeframe: Keltner Color count (Free): 2 Entries (I. Basis line, II. Upper 1/Lower 1 line)
Keltner Color Count input
- Length = 50
- Multi1 = 1
- Multi2 = 2
- Multi3 = 3
- Source = Close
- Lookback = 25
I. Basis entry rule:
1. Keltner channels:
Long when closes candle crossover the Upper 3 Keltner.
Short when closes candle crossunder the Upper 3 Keltner.
2. Rule of Basis's correction zone before open trades.
- Buy when previous OHLC4 candle crossover the Keltner Basis (Supertrend uptrend & Keltner long). Not repaint.
- Short when previous OHLC4 candle crossunder the Keltner Basis (Supertrend downtrend & Keltner short). Not repaint.
II. 'Upper 1/Lower 1' entry rule:
1. Keltner color count: lookback = 25
2. Keltner channels:
- Long when closes candle crossover the Upper 2 Keltner and Keltner Color count Uptrend.
- Short when closes candle crossunder the Upper 2 Keltner and Keltner Color count Downtrend.
3. RSI down when crossover 70, RSI down when crossunder 30
4. Rule of 'Upper 1/Lower 1' correction zone before open trades.
- Buy when previous OHLC4 candle crossunder the Keltner Upper 1 (Supertrend uptrend & Keltner long & RSI up). Not repaint.
- Short when previous OHLC4 candle crossover the Keltner Lower 1 (Supertrend downtrend & Keltner short & RSI down). Not repaint.
III. Stoploss move: Height of Keltner * 1.3
IV. Report all history ETHUSD (h1 timeframe):
1. Keltner Basis line entries:
- 14/01/2019 - 20/11/2021
- 18/01/2021 - 01/01/2021
- 02/01/2020 - 01/01/2020
- 05/02/2016 - 01/01/2019
- 23/10/2015 - 01/01/2018
- 23/10/2015 - 01/01/2017
2. Keltner 'Upper 2/Lower 1' entries:
- 20/01/2019 - 20/11/2021
- 10/01/2018 - 01/01/2021
- 12/01/2017 - 01/01/2020
- 04/02/2016 - 01/01/2019
- 19/08/2015 - 01/01/2018
- 19/08/2015 - 01/01/2017
3. Combine 2 entries (Basis & 'Upper 1/Lower 1':
01/01/2019 - 20/11/2021
01/01/2018 - 01/01/2021
01/01/2017 - 01/01/2020
01/01/2016 - 01/01/2019
01/01/2015 - 01/01/2018
01/01/2015 - 01/01/2017

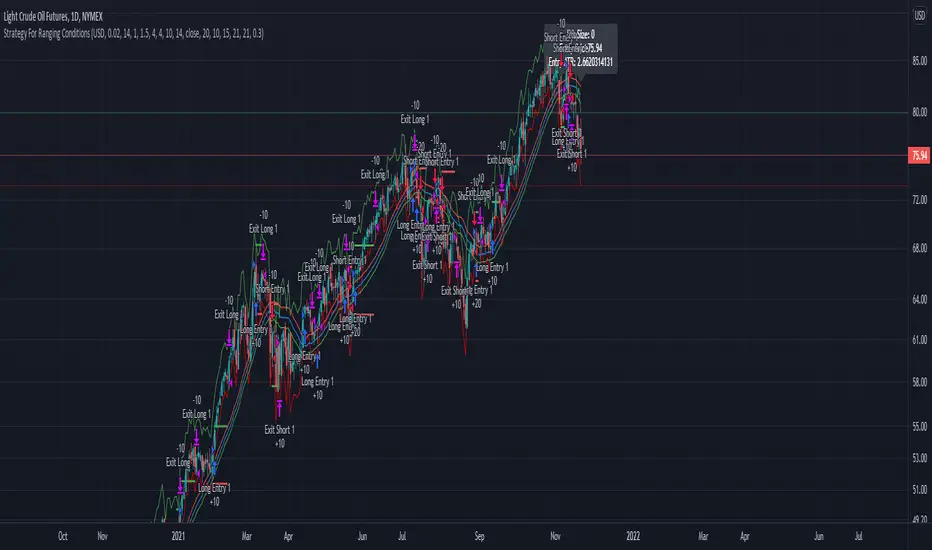
Strategy For Ranging ConditionsThis is a Trading strategy that uses a stochastic indicator in order to place buy and sell positions while using an exponential moving average as a filter. This is great for assets that normally move within a range and helps to keep one out of reversals or out of the grasps of crashes downwards and its loss of appreciation gained due to price takers. A lot of trades are taken but they are normally exited quickly due to this strategy's nature. Again diligence will be needed to know if one should apply this to their current asset being looked at or add it to a set of different trading strategies in your arsenal. Take a deep look at the condition your asset is in whether it be ranging or trending and use this strategy as one deems fit.
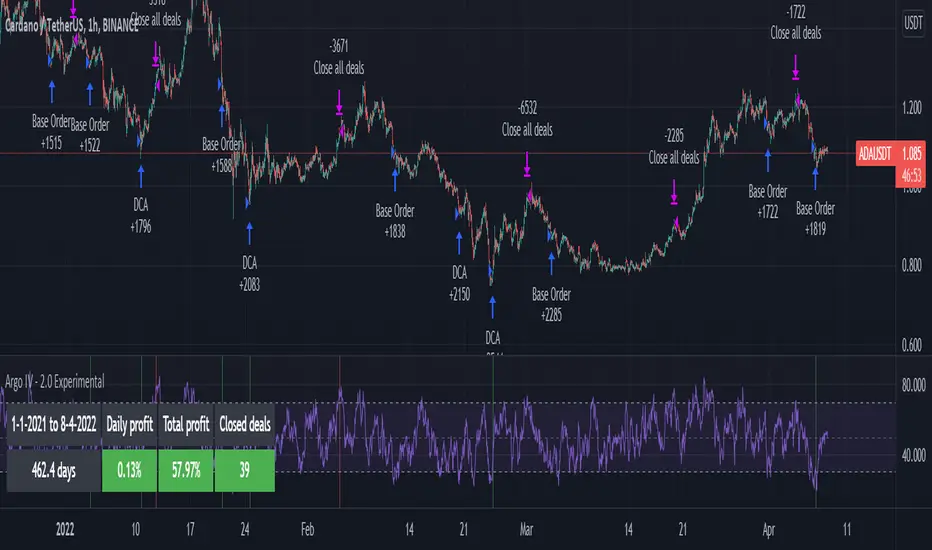
Argo IV - EXPERIMENTAL strategy for 3commas with alertsThis strategy lets users create BUY/SELL alerts for 3commas single bots in a simple way, based on a built in set of indicators that can be tweaked to work together or separately through the study settings. Indicators include Bollinger Bands , Williams %R , RSI , EMA , SMA , Market Cipher, Inverse Fisher Transform, RSI divergence.
It is based on the ARGO I study ( here ), with the following major differences:
- It uses pyramiding (see strategy "properties")
- It includes a lot of new options for deal start/close conditions for maximum control
- It doesn't require any external tool to backtest.
If the user choses to create both BUY and SELL signals from the study settings, the alert created will send both BUY and SELL signals for the selected pair. Note the script will only send alerts for the pair selected in the study settings, not for the current chart (if different).
Important : it is only an early experiment, I will only release the script when satisfied with performance. Until then, I advise not to use this for any real trading.
How to use:
- Add the script to the current chart
- Open the strategy settings , insert bot details. Pairs MUST be in capital letters or 3commas will not recognize them.
- Still in the settings, tweak the deal start/close conditions from various indicators until happy. The strategy will plot the entry / exit points on the chart
- When happy, right click on the "..." next to the study name, then "Add alert'".
- Under "Condition", on the second line, chose "Any alert () function call". Add the webhook from 3commas, give it a name, and "create".
RSI StrategySimple way how to use RSI and MA indicators for trading.
What we use:
• RSI
• SMA calculated by RSI (title: SMA_RSI)
• Delta of RSI and SMA_RSI (title: delta)
• SMA calculated by delta of RSI and SMA & RSI (title: SMA_RSI2)
Logic:
Upon the fact that we use the difference between two indicators that have similar values ( RSI and SMA_RSI), we get number around zero. Next, result is smoothed by calculated the SMA . This is the blue/purple line that appears on the chart - SMA_RSI2.
The trade open when SMA_RSI2 cross over the threshold. The trade close when SMA_RSI2 cross under the threshold below.
Also, the usual EMA 200 is used as a filter, which you can switch on or switch off.

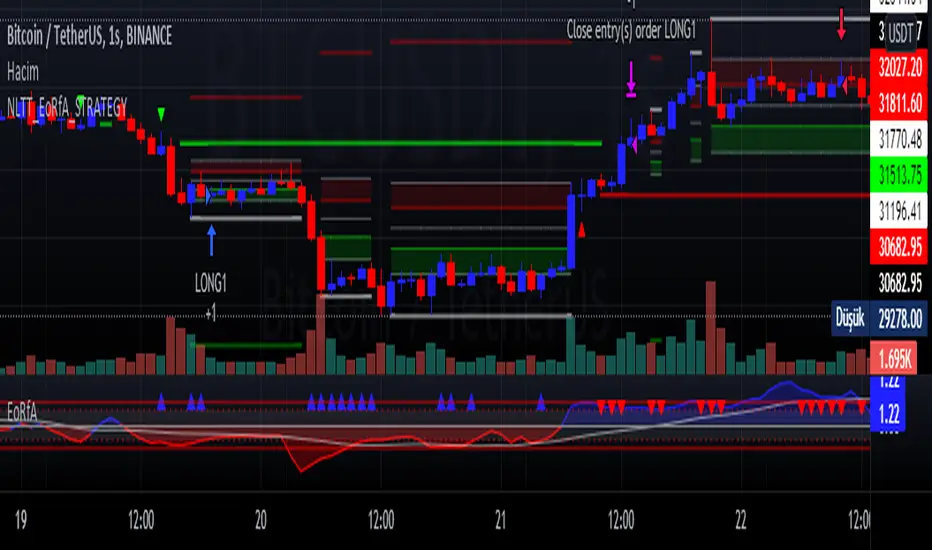
No-lose trading targets (Based on EoRfA) By Mustafa ÖZVERI simulated the NLTTa_EoRfA indicator with the Bitcoin-USD
For details about the indicator, visit my profile on tradingview
For Simulation, with default settings, we order
When on Long setup and price on green area
- open a long position that closes on red area
When on Short setup and price on red area
- open a short position that closes on green area
And we got
- about 15% profit
But only this value can not guarantee good results for trading. BE CAREFUL
WaveTecs StrategyWelcome to the Backtesting version of "WaveTecs Strategy", the indicator itself is an invite-only script called "WaveTecs Indicator" on TradingView.
WaveTecs Strategy
WaveTecs is a Strategy that combines Wave Trend Oscillator and verifies wave momentum by using RSI and Stochastic Oscillator Values.
What is Wave Trend?
One of the most effective indicators in identifying swings is the Wave Trend indicator. Wave Trend plots waves using highs and lows between an upper band and a lower band. It looks for the opening and closing of a new wave trend movement as well as overbought and oversold areas.
How does this modified strategy work?
By using RSI and Stochastic values we are able to verify Wave inflection points to determine if there is a suitable amount of momentum to ride the swing and make profitable trades. Positions are taken or closed based on the rising or falling momentum.
Each value input can be adjusted to best suit the type of market you are trading in. By using the strategy we can optimize these value inputs to yield greater net profits. I have found the RSI and Stochastic values hugely impact entries and exits regarding trades.
For Long conditions:
- RSI & Stochastic needs to be increasing and moving out of oversold conditions to show positive momentum.
- Falling momentum results in a sell signal. I have found RSI less than 65 to be sufficient in most markets however this can be adjusted at any time to yield different results depending on your comfort level.
For Short conditions:
- RSI & Stochastic needs to be decreasing and moving out of overbought conditions to show negative momentum.
Generally, Wave Trend Strategies only take trades that are outside of the bands. This strategy allows trades inside and outside of the bands, which can be selected under the input section title "Aggressive Trading". Trading in this mode is more frequent as signals are often. Due to volatility in crypto markets, I have defaulted the source for Wave Trend waves to be Open/High/Low/Close Average which yielded great results. High/Low/Close average works very well for all other securities, and can easily be adjusted through the drop-down menu inside the inputs.
Works for all types of markets. Parameters can be adjusted but not required as indicator values are standard in the industry.
The default parameters are set to those typically used in the markets currently. However, I have found that if you adjust you to adjust the parameters based on your asset and time frame desired you will yield different results.
----------------
For example:
----------------
ETHUSDT - 4 HR, results are shown below
Wave Trend Parameters:
Aggressive Trading: Yes
Channel Length: 12
Average Length: 24
Overbought Top: 90
Overbought Bottom: 75
Oversold Bottom: -90
Oversold Top: -55
Source: hlc3
Strategy Type:
Trade Direction: Long Only
Stochastic Inputs:
Stoch Length: 18
Smoother %K: 5
Moving Average %K: 4
%K Lower Limit: 21
%K Upper Limit: 80
%K Crossunder Sell: 80
Relative Strength Index Inputs:
RSI Lower Limit: 30
RSI Upper Limit: 70
RSI Sell Value: 68
==================
WaveTecs Features
==================
Profitable Trading Strategy;
Aggressive Trading feature for more trades, with earlier entries and exits;
Customizable inputs to fine-tune your trades;
Buy & Sell Alerts (Indicator Only);
Overlay indicator only to show alerts, WaveTecs Strategy needed to see Wave Trend;
Bot Integration through webhooks;
Two different strategy modes: Long Trades Only or Long & Short Trades
Adding new features & updates whenever possible.
Add both WaveTecs Indicator and WaveTecs Strategy to your chart. WaveTecs Indicator only plots Buy & Sell Alerts, whereas WaveTecs Strategy lets you see what the strategy is doing.

Smoothed Waddah ATR~~~All Credit to LAZY BEAR for posting the original Script which is an old MT4 indicator.~~~~
No this system does not repaint... if it does let me know. Either the code is wrong or you are using a repainting chart such as renko candles.
*PURPOSE*
This Is an "Enhanced or Smoothed" version of the script that captures the heiken-ashi closing price as its main calculation variable. While using normal bar or line charts. Enhancements integrate trade filters to reduce false signals.
*WHAT TYPE OF TRADING STRATEGY IS THIS?*
This is a Long Only, Trend Trading System. Is intended to be applied to Charts/Timeframes that produce sustainable trends for which ever asset you are trading.
*NOTE OF ADVICE REGARDING SETTINGS*
Settings can be tweaked but I have found that best results come with the given settings. If a chart is too choppy to trade this indicator successfully, it is advised not to change the settings but either find a different timeframe or different asset to apply this strategy to.
TLDR
Indicator measures the change of the MacD (difference between MAC D of given EMA's) and compares it to the difference between the Upper and Lower Bollinger bands. Green bar over trigger line= entry. Red bar over trigger line = close.
*SETTINGS AND INPUTS*
-MacD of HeikenAshi chart (will always be of the Heikenashi chart even when applied to different chart type)
sensitivity = input(150, title='Sensitivity') =range should be (125-175)multiplier so that MacD can be compared to BB
fastLength = input(20, title='MacD FastEMA Length')
slowLength = input(40, title='MacD SlowEMA Length')
-Bollinger Band of currently used price chart type
channelLength = input(20, title='BB Channel Length')
mult = input(1.5, title='BB Stdev Multiplier')
-14 Period RSI Trade Filter (set to 0 to Disable)
RSI14filter = input(40, title='RSI Value trade filter') =only gives entry when RSI is higher than given value
*ABSTRACT & CONCEPT*
TLDR - Indicator measures the change of the MacD (difference between MAC D of given EMA's) and compares it to the difference between the Upper and Lower Bollinger bands. Green bar over trigger line= entry. Red bar over trigger line = close.
Indicator plots -
Bars are the change in the MAC D and the indicator line is the difference in the BB.
When Bars are higher than the indicator line then it is considered a trend "Explosion"
Green Bars are Trend Explosion to the upside, Red Bars are Trend explosion to the downside.
GENERAL DETAIL-
the core calculation is measuring the change in MacD of current candle compared to the MacD of two previous candles.
This value is multiplied by the sensitivy so it can be compared to the change in Bollinger Band Width.
if the MACD change is positive then you get a green/lime bar for that value. If the MacDchange is negative you get a red/orange bar for that value.
and are determined by whether the actual change is increasing in that direction or decreasing. (bars getting taller or bars getting shorter)
Entry signal for long is A positive change in MACD difference (Green bar) that is greater than the change of the bollinger band (orange signal line) AND if the RSI value is above your filter.
Close signal or Trend Stop Warning Signal is given when a Negative MacD Difference (red bar) is greater than the change of the bollinger band (orange Line)
*CONSIDERATIONS AND THOUGHTS*
I have over 150 iterations of this indicator and this is the most consistent and best version of settings and filters I was able to generate. I built this indicator specifically for 3 charts. SPY monthly, QQQ monthly, BTC 3 Day. However this indicator works well on any long term bullish chart. (tech stocks are great) .
Trend trading systems are intended to be homerun hitting, plunge protecting indicators that allow for long legs and expanding volatility. This indicator does this as the trigger line is Dynamic with the expansion and contraction of the bollinger band.
I do not take every signal specifically not the close signals. Instead they more like warnings in ultra bullish environments.
If i had to pair this indicator with any other filter than the RSI, it would be a long term moving average i.e. the 50 week or equivalent for your chart. signals above rising moving averages means that you are trading with an upward trending market.
Hope this helps. Happy trades.
-SnarkyPuppy

Simple EMA20 Strategy + StochasticThis is a Trend Following Strategy.
The intent of this strategy is to catchthe price as it trends higher than the 20-period EMA and sell immediately after the price closes below it.
I have implemented calculations from Stochastic to make sure the price is coming from an oversold area.
There is also a check to see if the 20-period EMA is trending higher than before.

Supertrend + RSI Strategy [Alose]This strategy combines the best of both indicators (Supertrend & RSI).
As we know, Supertrend is excellent at finding changes in the market trend and thus finding the best entries, however in my opinion it has a great weakness and it is that it does not know how to find the best exit point.
For this reason I decided to combine it with the RSI that we know usually knows the highest and lowest rebound points of the price, thus managing to find the best exit point for the strategy.
The best thing about combining these 2 indicators is that our trades will obtain better profits in less time.
LONG ENTRY
When SuperTrend changes its direction and it is less than 0.
LONG EXIT
There are two ways to close the trade:
When RSI is overbought, you can choose the "Overbought Level " inside the strategy settings (Default: 72).
When SuperTrend changes its direction and it is grater than 0.
SHORT ENTRY (You can enable short entries in strategy settings)
When SuperTrend changes its direction and it is grater than 0.
LONG EXIT
There are two ways to close the trade:
When RSI is oversold, you can choose the "Oversold Level " inside the strategy settings (Default: 28).
When SuperTrend changes its direction and it is less than 0.

RSI & SMA Strategy By DenizIntroduction
It has always been a major challenge to detect the current market price in technical analysis . There are some basic but strong indicators that help us to estimate the next market action. Relative Strength Index and Simple Moving Average indicators were used in this strategy.
This strategy aims to detect the next market action with different calculations & usages of RSI and SMA indicators.
Strategy Features
As per the result of the calculation from RSI and SMA outputs the strategy will decide to go "Long" or "Short" if the directions are changed from long to short the trade will be closed and it's opening new trade as per to the new direction.
Apart from basic "take profit" and "stop" options there is an additional closing trade option named "Long/Short Bar Count". If the trade could not reach the target in a certain period, it will look for a quit with a 0 loss.
Advantages
Informative alarm messages.
High ratio of Profitable trade numbers.
Disadvantages
Less trade count.

grid strategy longDesign ideas for the first edition:
Only go long, not short, choose a time period when the general trend is up. The default grid size is 1x ATR, the next one, two, and three grids will take orders, and the fifth grid will stop loss. When the empty position reaches the upper grid, the grid as a whole rises.
Chinese Introduction:
只做多、不做空,选择大趋势向上的时间段。网格大小默认为1倍ATR,往下1、2、3个网格吃单,第5个网格止损。空仓时到达往上一个网格则网格整体抬升。

Sideways Strategy DMI + Bollinger Bands (by Coinrule)Markets don’t always trade in a clear direction. At a closer look, most of the time, they move sideways. Relying on trend-following strategies all the time can thus lead to repeated false signals in such conditions.
However, before you can safely trade sideways, you have to identify the most suitable market conditions.
The main features of such strategies are:
Short-term trades, with quick entries and quick exits
Slightly contrarian and mean-reversionary
Require some indicator that tells you it’s a sideways market
This Sideways DMI + Bollinger Bands strategy incorporates such features to bring you a profitable alternative when the regular trend-following systems stop working.
ENTRY
1. The trading system requires confirmation for a sideways market from the Directional Movement Index (DMI) before you can start opening any trades. For this purpose, the strategy uses the absolute difference between positive and negative DMI, which must be lower than 20.
2. To pick the right moment to buy, the strategy looks at the Bollinger Bands (BB). It enters the trade when the price crosses over the lower BB.
EXIT
The strategy then exits when the move has been exhausted. Generally, in sideways markets, the price should revert lower. The position is closed when the price crosses back down below the upper BB.
The best time frame for this strategy based on our backtest is the 1-hr. Shorter timeframes can also work well on certain coins that are more volatile and trade sideways more often. However, as expected, these exhibit larger volatility in their returns. In general, this approach suits medium timeframes. A trading fee of 0.1% is taken into account. The fee is aligned to the base fee applied on Binance, which is the largest cryptocurrency exchange.
You can execute this strategy on your favourite exchange at coinrule.com.

RSI multitimeframe SMA crossoverStrategy based on the multi timeframe equally weighted RSI moving averages turned into single average and then cross of the 2 combined outputs, seems to be promising, default settings work good on 5m chart(better entry) but very filtered trade amount. If you want to use it on different timeframes be my guest and mess with adjustments, pretty much every aspect of strategy is adjustable, idea is same. If somebody liked the idea and able to improve it - share with me :)
John F. Ehlers Center Of Gravity Balanced by [DM]Greetings to all colleagues.
I share this indicator turned into a strategy, (this is one of my first strategies so some inputs are missing and others are somewhat archaic)
this cog is formed by three signals which can be reduced by dividing by phi
Available settings:
Length setting for signal
Trigger parameter setting for strategy
stoploss settings
trailing stop settings
tp settings
I hope it fuels your curiosity
The Center of Gravity (COG) indicator is a technical indicator developed by John Ehlers in 2002, used to identify potential turning points in the price as early as possible. In fact, the creator John Ehlers claims zero lag to the price, and the smoothing effect of the indicator helps to spot turning points clearly and without distractions.

Bot go_up DD_long/shortHello!
This strategy is based on the double bottom pattern - for entering a long position / double top-short
A double bottom pattern is formed when two price bottoms are relatively at the same level and the top acts as resistance. This pattern appears at the end of a downtrend and signals a reversal.
A double top is a bearish reversal pattern that signals the end of an uptrend. It is formed by two price highs forming at the same level and a notch line that acts as local support.
As history and practice show, the double bottom pattern works better. Moreover, in a bull market.
You can include only long or only short. BUT while there is a long, a short position will not be opened, in fact, with a long as well.
You can use reverse trade, one coin at a time.
DESCRIPTION:
// LOGIC ENTRY:
Period for short and long positions-to search for double bottom as well as double top. the more, the less false.
Change liong and short-channel width for pattern search separately for long and short.
General shift-the overall width of the channel, which changes equally at once for long and short
By default, quiet settings for tf 5 minutes are applied!
You can choose the settings you like.
// AMOUNT(USDT) FIRST ORDER AND > % NEXT
In the first column, indicate the amount, in the second, how many percent the next order will be more than the previous one.
// EXIT SETTINGS
Closing a trade by RSI when it reaches the level specified in the settings (but in the negative, the trade will never be closed, even if the condition is triggered)
Using a percentage to exit a trade + stop loss. (Put a stop order 1000+ on the market can be anything, especially if you use spot trading)
PS: in order to use the RSI output at a certain level, put a checkmark on the desired one, and also check the percentage box and indicate a take on the percentage 10-20 +)
// MARTINGALE GRID
If there is a check mark, then the grid is used.
Use all signals?
If yes, then there will be no limit on inputs from logic
If the checkbox is not checked, then you can limit the entries from the strategy logic by the specified percentage.
Grid, the next order, when decreasing by a certain percentage, an order when decreasing by the percentage that will be specified (after entering from the logic, when the next signal appears, the grid will be counted from the beginning)
PS: orders are not automatically placed, if the conditions are triggered, then the entry is only at the next bar (within the TV, it is not possible to add orders immediately, but most often, in case of straits, for the better)
// FILTER SETTINGS
The filter consists of a series of popular, averaged oscillators
//DATA RANGE
You can see the results for the selected period
//
CALCULATION OF ORDERS AND MARGIN (FOR INFO ONLY)
The number of orders is the number of entries (you must always have the same number of orders in the arguments and in the properties !!)
- in the aruments for understanding, in the properties - it does not matter how much it will cost there, so many inputs will be!)
-leverage is created to calculate the margin
When you change these parameters, you will understand how much money is required in general and what maximum drawdown can be allowed
Green line-take, lower-stop-order.
To use algo trading, in fact, you need to use a script, in the service through which you will transmit a signal through webhooks, you need to select the amount.
{{strategy.order.contracts}}
ОПИСАНИЕ НА РУССКОМ
//ЛОГИКА ВХОДА:
Период для шорт и лонг позиций, сдвиг для шорта лонга, также общий
По умолчанию применены спокойные настройки для тф. 5 минут.
Вы можете самостоятельно подбирать настройки, основываясь на прошлые результаты
//СУММА ВХОДА В ЮЗДТ +МАРТИНГЕЙЛ:
В первой графе указываете сумму , во второй -на сколько процентов следующий ордер будет больше предыдущего.
//НАСТРОЙКИ ВЫХОДА ИЗ СДЕЛКИ
Закрытие сделки по RSI, когда достигнет уровня, указанного в настройках ( но в минус сделка не будет закрыта никогда, даже если условие сработало)
Использование процента для выхода из сделки+ стоп приказ.( Ставьте стоп-приказ 1000+ на рынке может быть всякое, тем более, если используете спотовую торговлю)
ПС: для того, чтобы использовать выход по RSI по определенному уровню, поставьте галочку на нужный , а также поставьте галочку по проценту и укажите тейк по проценту 10-20+)
//НАСТРОЙКИ СЕТКИ
Если стоит галочка-то сетка используется.
Использовать все сигналы?
Если да, то лимита по входам от логики не будет
Если не стоит галочка, то можно ограничить входы от логики стратегии, на указанный процент.
Сетка, следующий ордер, при снижении на определенный процент-след ордер при снижении на тот процент, который будет указан ( после входа от логики , при появлении следующего сигнала сетка будет считаться с начала)
ПС: ордера автоматически не ставятся, если сработали условия, то вход, только на следующем баре ( в рамках ТВ, нет возможности добавить сразу ордера, но чаще всего, при проливах-к лучшему)
//НАСТРОЙКИ ФИЛЬТРА
Фильтр состоит из серии популярных, усредненных осцилляторов.
//
БЭКТЕСТИНГ
Можете посмотреть результаты за выбранный промежуток
//
ПИРАМИДИНГ (исключительно для расчета)
Количество ордеров-это количество входов ( у вас всегда должно быть одинаковое количество ордеров в агрументах и в свойствах!!)
-в аргументах для понимания, в свойствах -важно, сколько там будет стоить-столько входов и будет!)
-плечо создано для расчета маржи
При изменение данных параметров Вы будете понимать сколько потребуется средств в общем и какую максимальную просадку можно допустить
Зеленая линия-тейк, нижняя-стоп-приказ.
Для использования алго-трейдинга, собственно так и нужно использовать скрипт, в сервисе, через который Вы будете передавать сигнал через веб-хуки , Вам нужно выбрать количество.
{{strategy.order.contracts}}
Удачных трейдов, друзья!

DI Crossing Daily Straregy HulkTradingSimple strategy based on crossing DI+ and DI- and Average True Range.
Long entry when DI+ crossover DI-
Short entry when DI+ crossunder DI-
Stop Loss and Take Profits based on Average True Range.
Default values are 1*ATR(14) for stop loss and 2*ATR(14) for Take Profit.
Risk reward 1 to 2 ratio.
Recommended default values, but you can change it if you want.
Recommended timeframe - 1D.
Script was tested on BTCUSDT pair and have a 2.4 profit factor.

EMA RSI ADX Scalping StrategyThis is the strategy version of my ERA Indicator. You can check my scripts if you'd like to use only study indicator.
Strategy Rules For Long Entry:
- Check if price above the set EMA (Can disable this rule if you'd like in the settings)
- RSI is in Oversold
- ADX is above set "Trend Ready" threshold (Meaning there is a trend going on)
- Price must approve the trend of previous candles. This is bullish for buy entries and bearish for sell entries.
- Enter with stop loss below last swing low with 1:1 or 1.5:1 take profit ratio.
Strategy Rules For Short Entry:
- Check if price below the set EMA (Can disable this rule if you'd like in the settings)
- RSI is in Overbought
- ADX is above set "Trend Ready" threshold (Meaning there is a trend going on)
- Price must approve the trend of previous candles. This is bullish for buy entries and bearish for sell entries.
- Enter with stop loss above last swing high with 1:1 or 1.5:1 take profit ratio. (Can be adjusted)
Features:
- You can modify a lot values to your liking.
- Choose Fixed or Trailing Stop Loss / Take Profit with detailed modifiers.
- You can connect it to bots if you'd like.
- It does NOT repaint.
- Since it's a scalping strategy recommended to use on 15 min or below timelines.
- Choose if you want to stop entry on opposite signals.
- And some other things i may not remember right now...
I tried to code this as modifiable as possible. Let me know if there are any problems you encounter. Open to suggestions as well.
Happy Trading.

TradingGroundhog - Strategy & Fractal V1#-- Public Strategy - No Repaint - Fractals -- Short term
Here I come with another script, more simple than Wavetrend V1. You will love it.
#-- Synopsis --
Another simple idea, on a small time frame (15 min) we buy when the opening price goes below a Bottom fractals and sell when it goes over a Top fractals, but as this script do not use Wavetrends. You should stop by your self to use the script during long lasting downtrends.
I developed the strategy using BTC /EUR 3 MIN BINANCE but it can be applied to many other cryptos, I don't know for forex or others. You can use it for short term (to a month of uptrend) and automated trading.
#-- Graph reading --
And now, how to read it ?
Fractals:
Yellow Flags occur when the opening price goes below a Bottom fractal , it means Buy.
White Flags appear when the opening price goes over a Top fractal , it means Sell.
#-- Parameters --
*** Parameters have been intensively optimized using 10 cryptocurrency markets in order to have potent efficiency for each of them. I would recommend to only change the Can Be touch parameter. For the others, I don't recommend any modifications. The idea behind the script is to be able to switch between markets without having to optimize parameters, less work, easy to target active crypto and therefor limit the risks. ***
Can be touch :
'Filter fractals' : Activate or Disable the filtering fractal operation. If Enable, buy during less risky periods. (Activate is often better)
Can be touch but not necessary :
'VolumeMA' : The Volume corrector used by the fractals
'Extreme window' : The number of price individuals to look for if we want to remove extreme fractals.
Not to touch :
'Long Sop Loss (%)' : The minimal difference of price between a Fractal bottom and the opening price to buy.
#-- Time frame --
Should be used with the following time frames depending on the necessity:
1 MIN
3 MIN (Preferred with the parameters set)
5 MIN
#-- Last words --
The script can be set up to send Tradingview signals to 3comma just by adding comment = " " in strategy.close_all() and strategy.entry().
Good trades !
Disclaimer (As it should always be one to any script)
***
This script is intended for and only to be used for personal purposes only. No such information provided by it constitutes advice or a recommendation for any investment or trading strategy for any specific person. There is no guarantee presented or implied as to the accuracy of specific forecasts, projections, or predictive statements offered by the script. Users of the script agree that its original developer does not take responsibility for any of your investment decisions. Please seek professional advice before trading.
***
# Here are the results from the 20rst of September 2021 with 100% of equity on the BTC /EUR 3 Min and with a capital of 10 000 EUR. So almost, one month.
# As I saw, it goes from +30% to more than +160% (the great SHIB) depending on the selected crypto. It may be negative if you spot a downtrend.

Volume Difference Delta Cycle OscillatorVolume Difference Delta Cycle Oscillator indicator:
Using the power of my Volume Difference Indicator and standard deviations based on Bollinger Bands and more, we present this wonderful indicator with the following features:
Price Action Histogram: This is the bread and butter of this graph, if the PAH is above 0, this is considered a BULL cycle, and if below 0, this is considered a BEAR cycle. The histogram will move up and down based on the Histagram settings you set in the properties field. Be careful, we advise using default settings.
Custom Overbought & Oversold Lines:mean
These lines can be used to identify when to buy and sell the security, and help you make sense of the action of the histogram. Change the color, size, and linewidth!
These lines are what are used to perform the trades with the strategy as well, so if you change them, they will make an impact on the strategy itself.
EzSpot Background:
Do you want to turn your brain off and just trade when you you're inside an Overbought or Oversold line? Awesome! Turn on EzSpot backgrounds, and when it's green, go long, when it's red go short! Simple as that!
How it works:
By taking the Delta of the Volume Difference Indicator we're able to find the rate of change of the amount of change of volume, allowing us to see changes in volume before price changes. To add onto these, we supercharge it by taking the output of this line as the input source of bollinger bands which we use to output the %B of the Delta of the Volume Difference Indicator.
Separately, we calculate the %B of the current close to use later.
The final step is taking the second %B (which is an indication of where price lies on the curve of historical price data), and from it subtract the first %B, which allows us to visualize the standard deviation of the closing price, minus the standard deviation of Delta of the Volume Difference , which in essence allows us to see when volume changes but price does not and vice versa.
This final output is then plotted along with an over bought and over sold line, which we use to perform our trades on.
Simplified: This indicator shows the cycles of price action - volume based on the rate of the rate of volume changes based on price and the closing price.
Super Simple: Notice when volume increases but price hasn't, and vice versa with this indicator.

TripleEMA + StochasticRSI + ATR Scalping Strategy by TradeSmartCOINBASE:BTCUSD Hello everyone and welcome to our second script release!
This script is one of many upcoming scripts. This one is a test for us, how it works, how you guys like this kind of stuff, and for feedback what we should change/improve at.
So feel free to comment any suggestions you have.
SCRIPT IS OPTIMIZED FOR:
BTC/USD (Coinbase) 15 minute timeframe
(Keep in mind default settings does not include trading fees, you can set it at the properties)
I recommend using this script on a trading exchange where the fees are extremely low or on an exchange where you get paid to place limit orders.
(I am not a financial avdvisor and none of this is financial advice.)
Now you can modify the following:
Stochastic RSI
3 different EMA
Length of ATR (for stop loss and take profit)
Stop Loss and Take Profit Risk to Reward ratio
Choice between Capital Risk on each trade or Risk of % of Capital
Allowing Short/Long entries only
Limit between dates
Trading days 1-7
We will update the script with more and more features taking in consideration your requests.
Hope you like it! Don't forget to let us know what we should change or improve. Thanks, and have a great day!
STRATEGY ENTRY RULES
LONG
When EMAs are lining up (meaning for ex. 400 < 13 < 7), and the Stochastic RSI crosses upwards (meaning blue line crosses orange upwards), then go long.
SHORT
When EMAs are lining down (meaning for ex. 7 < 13 < 400), and the Stochastic RSI crosses downwards (meaning blue line crosses orange downwards), then go short.
TAKE PROFIT
When price hits the exit price (calculated from stop loss with the risk ratio)
STOP LOSS
When price hits stop loss then exit the position.
QUANTITY TO BUY (Risk per Trade % or Capital %)
Risk Per Trade % attribute: we can set how much money we want to risk on one trade. Meaning that if we lose that particular position, then a Risk Per Trade % value of our equity will be lost.
Example: if you set the Risk Per Trade % to 1 % and you have a 100$ account balance, then if you loose the trade you will loose 1$ max.
Capital % we can set with how big % of our capital we want to enter into a position. Meaning that we enter with a set % of our capital.
Example: if you set the Capital % to 1 % and you have a 100$ account balance, then you will enter the position with 1$.
First Release Settings: (2021-10-25) for BTC/USD (Coinbase) 15 minute timeframe
Stochastic RSI settings: (Not displayed in the script. If you want to see it you have to add it separately.)
K: 3
D: 2
RSI Length: 6
Stochastic Length: 16
RSI Source: hlc3
EMA 1: 5
Source One: Close
EMA 2: 12
Source Two: Close
EMA 3: 215
Source Three: Close
Length of ATR: 16
Stop Loss Multiplier (risk): 3.6
Exit Price Multiplier (reward): 1
Risk Percentage: 3
Allow Long Entries: yes
Allow Short Entries: yes
Valid Trading Days: 1234567
The valid trading days of the Limit Trading Time feature. Numbers represent the days: Sunday (1), Monday (2), Tuesday (3), …, Saturday (7)
If you like this one, follow for more scripts! Thank you for your support!

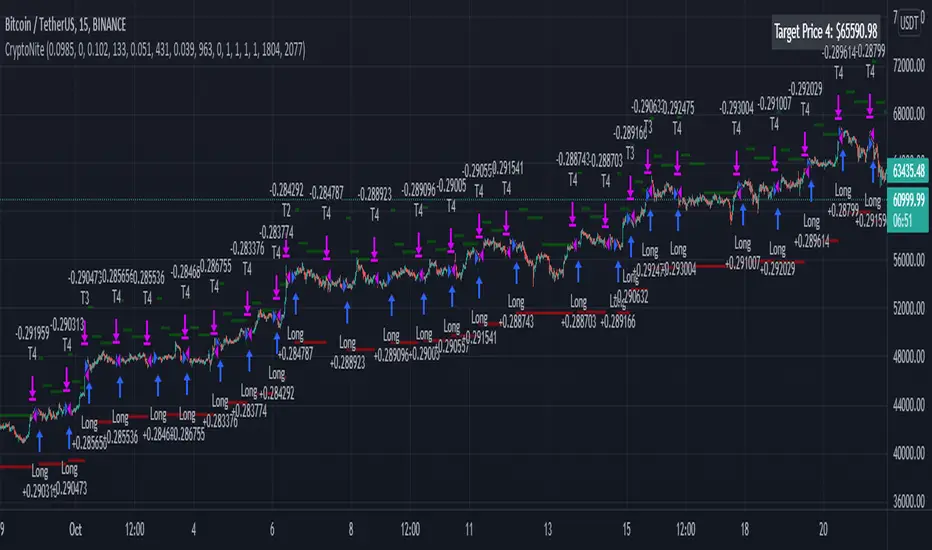
CryptoNite - Machine Learning Strategy (15Min Timeframe)Greeting Traders! I am back with another ML strategy. :D I kept my word with combining my machine learning algorithms from Python and integrating them into Tradingview. Thanks to Tradingview's new release of Pinescript v5 it is now possible. This strategy respects the Sortino Ratio and was created using 2 years of data for 50 different cryptocurrencies. That is a total of 100 years of data and 44,849 trades to create this strategy. Now let me tell you, my computer and I are exhausted. We both been at it non-stop for about two months everyday. I refine the strategy, and the computer runs 24/7 for a few days to spit out the best results into the terminal. It's been a good run so my computer will finally get some sleep tonight.
So let's talk a little about the features of the strategy. In the settings window, you'll see the Stoploss, Take Profit Parameters, and Date Range. You can change the Date Range, but I recommend to leave the SL/TP parameters how they are because the machine learning algo chose those input. If you wish to change them you are always welcome to do so but backtest results will change. For the Take Profit parameters you'll see on the left side you something labeled time duration(displayed in minutes) and on the right side you'll see take profit values. Let's talk a little bit how they work.
TP_values = {
"0": 0.102,
"133": 0.051,
"431": 0.039,
"963": 0
}
In python, the table looks like this but it is quite easy to understand in Tradingview.
From 0-133 minutes, the strategy is looking to the reach target point 1 at 10.2% profit.
From 133-431 minutes, the strategy is looking to the reach target point 2 at 5.1% profit.
From 431-963 minutes, the strategy is looking to the reach target point 3 at 3.9% profit.
From 963+ minutes, the strategy is looking to break even at 0% profit on target point 4.
Through each target point a sell trigger is active. It will look for the best time to sell even if TP has not been reached.
This helps the trade not stay open too long.
The last thing I need to mention is the textbox displayed on the right side of your chart. This textbox displays the current Take Profit value in dollar amount. So when you're in a trade you'll know what TP target has to be reached when the open trade is active. Throughout time, the target price changes depending how long the trade has been open. If you have any questions feel free to comment down below, and enjoy this strategy!