SFC Smart Money Manipulation - MTF ZonesThis indicator shows the most important manipulated zones - true support and resistance.
The indicator can show the zones from different time frames - 1H, 4H, D and the current TF.
Order Block definition - small candle or few consecutive candles, where banks place buy and sell orders in order to manipulate the price. After price is manipulated and moved in one direction, the banks are in draw down, that is why they manipulate the price one more time before the true move, retesting these candles (closing losing positions).
FU candles
FU candles are most manipulated candles and create very strong reaction zones. These are the true zones, where the banks place their orders.
Why they are so strong? The answer is very simple - these candles clear the liquidity from the previous ones. After the liquidity is cleared ( all stop losses/pending orders are triggered), price reveal the true direction and move very fast.
FU candles are type of Order Blocks - the most powerful one.
Because the most volume is in the body of the order block. The indicator shows not only the FU candle, but the body of the order block.
There are two types of FU candles :
(only full FU candles are displayed as zones, because they are much significant)
1) Full fu, where the current candle completely engulf the previous one, after taking the liquidity. (displayed as F)
2) Current candle only take liquidity from the previous one, but failed to engulf it. (displayed as A)
9 day simple moving average is also displayed. When the price form Fu candle above/under the MA, there is a better chance for reversal.
When FU candles are retested the transparency will change, showing that the zones may have less impact.
Order Blocks
Only the current order blocks are displayed. Price react very often from the 50% level, that is why this level is also displayed.
Rejections
Rejections are doji candles or candles with big wicks. These rejections very often lead to reversals or deep pullbacks. But before the true move, price test the rejection levels. The retest is not always, but very often of the 50% of the wick.
The rejections are very important price zone.
The indicator can show the zones from different time frames - 1H, 4H, D and the current TF. When wicks are retested the transparency and colour will change, showing that the wicks may have less impact or no more impact.
Settings
-The colour and transparency of the zones can be changed.
- Multi time frames zones could be disabled.
- Doji settings
- Length of the moving average
How to use
If price reach one of the displayed zones. The trader should be prepared for price reaction. This reaction could lead to reversal, pull back or trading range.
The trader should have bias from the higher time frames and watch for signs of manipulations on smaller time frames.
Orderblocks
Bodies X Wix Version of Smart Money Tools by makuchaku & eFeThis is the same Script as Super Fair Value Gaps / FVG /BoS / by makuchaku & eFe. Mine Should Default to Large Text instead of small. The Super Order Blocks I believe was meant to for you to find one of the many Smart Money tools such as turn on the Fair Value gap but leave the others off, or Turn on where the Break of Structure and leave the others off. The reason I believe this is because the default values for each of the structures were default colored (green for positive and red for negative) for all.
Mine has a different Color for every possible structure. As long as you can read with the larger text that I added, then you can create your own boxes positive for break of structure, rejection block, order blocks and fair value gaps for any time frame. The reason I did that is because There's only certain things I believe I will need to mark for myself in each time frame, and then from there You can stretch iyour own box out further in time because if price touches a fair value gap for example, the fair value gap should conyinue in time until at least 2 candles have filed the Fair valu gap going both directions. That's truly when the fair value gap should is mitigated and will from off the chart. However, If I knew How to add the code for that, I would.
Additionally, I have the Max Boxes per chart, so you should have the ability to see every OB, FVG,RJB, & BoS on the chart
I tried my hardest to create a colored border that was different from the box. But the way the original was coded was almost impossible to do. Because they defined each of the structures (FVG, OB, BoS, RJB) outer levels, when the outer levels connect via math in the code, then it joins all the outside lines for a rectangle. When creating a box, the coloe will always be the same as the border unfortunately. (Unless I replan this from the beginning)
I also Changed the default labels for reach structure from a hard to read gray to a white that pops out.
Also, chart indicators are a little large as well. Such as the cross, sideways cross, The green Triangle, and the white Diamond. You'll get used to it or you can change it as well.
Creating videos for students, you need something they can see.
So, I just wanted to ensure everything was a little more unique and easily usable when showing this to my students when I send them private videos for our weekly lessons. I'm trying to learn how to use the IPFS for THAT, (which i see has invaded PineScript) Hope this indicator helps.
If you're to borrow this, Just make sure you keep the authors in the name makuchaku & efe

Mastering Market Structure"Market structure first, always" - Mr. Anderson aka TrueCrypto28 right before he went on to master Kung-Fu
Understanding and identifying market structure is essential for successful and consistent profitability. No system is perfect, but trading in the direction of the prevailing market structure can reduce the likelihood of being caught severely offsides and can yield trades with tighter invalidations and greater risk-to-reward potential.
This script will automatically identify and plot the following:
Market Structure
Pivot highs and lows using the lookback left and right lengths are analyzed to identify major swing highs and lows to identify the current trading range.
Bullish structure is characterized by a series of higher highs and higher lows.
Bearish Structure is characterized by lower highs and lower lows.
Structure breaks when a bar closes outside the current trading range. Major swing highs and lows will update following these breaks to continue following the current price action
Current market structure bias, bullish or bearish, can be displayed in a table in the location of your choosing.
Structure is fractal, so seeing low time frame structure shift against the high time frame structure can identify the beginning of a pullback. When it realigns with the high timeframe structure, it can identify the beginning of the high time frame trend continuation. You can choose to analyze structure on any timeframe with this script and even add multiple copies of it to your chart each analyzing different a timeframes to easily find high quality trade opportunities.
Fibonacci Levels of the current trading range
These are included to help identify areas of interest for trade execution and profit levels.
We want to buy at a discount and sell at a premium. The "Wholesale Zone" can be considered below the 50% retracement level in bullish structure, or above it in a bearish structure.
When in a bullish structure, "discount" buy opportunities can be found below the 50% retracement level with the expectation of trend continuation.
In a bearish structure, more ideal "premium' sell opportunities can be found above the 50% retracement with the expectation of trend continuation.
Optimal trade entry (OTE) zone, between the 61.8% and 78.6% retracement can offer a great risk-to-reward ratio for execution of a new position in trending environments.
When trading sideways in a range, opening new buy positions near the bottom of the range or new sell positions from the top of the range are preferred. Midrange 50% level commonly sees some reaction and can be used as a primary target with further targets either being the opposite end of the range or lower support levels (see order block section).
Order Blocks
New Bullish and bearish order blocks are created and plotted with every respective market structure break. They identify the price level from which the most recent leg of price action that yielded the structure break began.
In strong trending environments, these levels should continue to support or resist price. They are great areas to look to enter new positions.
Order blocks can also be used as targets for your trades to avoid giving back unrealized profits as price tends to react off of these levels.
To keep your chart clean and the order blocks relevant, an order block will be automatically deleted if price trades through and closes beyond it. Otherwise, printed order blocks will remain on your chart until either it's origin bar is out of TradingView's maximum bar history allowance or their maximum box count allowance.
Pairing these with fibonacci levels, retracements into order blocks that are in the Wholesale Zone or even the OTE zone offer higher probability trades with more favorable risk-to-reward potential.
Swing Failure
Swing failure patterns (SFPs) arise when a candle takes out a swing high or low, but fails to close beyond it.
Again, pairing these with other features of this script like range boundaries, wholesale zones, OTE zones, and order blocks can help traders identify the best times to actually execute their trade as SFPs are commonly seen at points of inflection in price action.
Moving Averages
Up to 4 moving averages from the current time frame are available. MA type and lengths can be adjusted to your preference.
Up to 4 MTF MAs. By Default this is an EMA 200 as it is commonly used for trend identification and support/resistance.
These are included for confluence of trend direction and strength.
They can also act as dynamic support and resistance and so can be useful for trade execution if price bounces or rejects off of them or targets as price may do so when it reaches them.
Additionally, alerts have been coded for the following scenarios:
MS Break alerts will trigger on bar close when a break in market structure has been confirmed.
SFP alerts will trigger on bar close when the swing failure pattern has been confirmed.
Entering OB alerts will trigger as soon as price touches the closest order block.
Entering Wholesale Zone alerts will trigger as soon as price cross the 50% retracement level. This can be used as an early alert to identify assets that have undergone a significant pullback before potential continuation in the direction of the main trend.
Entering OTE Zone alerts will trigger as soon as price crosses into the Optimal Trade Entry zone between the 61.8% and 78.6% retracement.
This script is unique in the way that it tracks market structure, automatically updates as price action continues to develop, presents high quality areas of interest, and SFPs for trend reversal and continuation. Traders will no longer need to constantly monitor their charts or exhaustively update their alerts to find good trade opportunities. This script takes care of all of it automatically. Collectively, all of the included features can be used to build a complete trading system.

Smart Money Concepts (SMC) [LuxAlgo]This all-in-one indicator displays real-time market structure (internal & swing BOS / CHoCH), order blocks, premium & discount zones, equal highs & lows, and much more...allowing traders to automatically mark up their charts with widely used price action methodologies. Following the release of our Fair Value Gap script, we received numerous requests from our community to release more features in the same category.
"Smart Money Concepts" (SMC) is a fairly new yet widely used term amongst price action traders looking to more accurately navigate liquidity & find more optimal points of interest in the market. Trying to determine where institutional market participants have orders placed (buy or sell side liquidity) can be a very reasonable approach to finding more practical entries & exits based on price action.
The indicator includes alerts for the presence of swing structures and many other relevant conditions.
Features
This indicator includes many features relevant to SMC, these are highlighted below:
Full internal & swing market structure labeling in real-time
Break of Structure (BOS)
Change of Character (CHoCH)
Order Blocks (bullish & bearish)
Equal Highs & Lows
Fair Value Gap Detection
Previous Highs & Lows
Premium & Discount Zones as a range
Options to style the indicator to more easily display these concepts
Settings
Mode: Allows the user to select Historical (default) or Present, which displays only recent data on the chart.
Style: Allows the user to select different styling for the entire indicator between Colored (default) and Monochrome.
Color Candles: Plots candles based on the internal & swing structures from within the indicator on the chart.
Internal Structure: Displays the internal structure labels & dashed lines to represent them. (BOS & CHoCH).
Confluence Filter: Filter non-significant internal structure breakouts.
Swing Structure: Displays the swing structure labels & solid lines on the chart (larger BOS & CHoCH labels).
Swing Points: Displays swing points labels on chart such as HH, HL, LH, LL.
Internal Order Blocks: Enables Internal Order Blocks & allows the user to select how many most recent Internal Order Blocks appear on the chart.
Swing Order Blocks: Enables Swing Order Blocks & allows the user to select how many most recent Swing Order Blocks appear on the chart.
Equal Highs & Lows: Displays EQH/EQL labels on chart for detecting equal highs & lows.
Bars Confirmation: Allows the user to select how many bars are needed to confirm an EQH/EQL symbol on chart.
Fair Value Gaps: Displays boxes to highlight imbalance areas on the chart.
Auto Threshold: Filter out non-significant fair value gaps.
Timeframe: Allows the user to select the timeframe for the Fair Value Gap detection.
Extend FVG: Allows the user to choose how many bars to extend the Fair Value Gap boxes on the chart.
Highs & Lows MTF: Allows the user to display previous highs & lows from daily, weekly, & monthly timeframes as significant levels.
Premium/Discount Zones: Allows the user to display Premium, Discount, and Equilibrium zones on the chart
Usage
Users can see automatic CHoCH and BOS labels to highlight breakouts of market structure, which allows to determine the market trend. In the chart below we can see the internal structure which displays more frequent labels within larger structures. We can also see equal highs & lows (EQH/EQL) labels plotted alongside the internal structure to frequently give indications of potential reversals.
In the chart below we can see the swing market structure labels. These are also labeled as BOS and CHoCH but with a solid line & larger text to show larger market structure breakouts & trend reversals. Users can be mindful of these larger structure labels while trading internal structures as displayed in the previous chart.
Order blocks highlight areas where institutional market participants open positions, one can use order blocks to determine confirmation entries or potential targets as we can expect there is a large amount of liquidity at these order blocks. In the chart below we can see 2 potential trade setups with confirmation entries. The path outlined in red would be a potential short entry targeting the blue order block below, and the path outlined in green would be a potential long entry, targeting the red order blocks above.
As we can see in the chart below, the bullish confirmation entry played out in this scenario with the green path outlined in hindsight. As price breaks though the order blocks above, the indicator will consider them mitigated causing them to disappear, and as per the logic of these order blocks they will always display 5 (by default) on the chart so we can now see more actionable levels.
The Smart Money Concepts indicator has many other features and here we can see how they can also help a user find potential levels for price action trading. In the screenshot below we can see a trade setup using the Previous Monthly High, Strong High, and a Swing Order Block as a stop loss. Accompanied by the Premium from the Discount/Premium zones feature being used as a potential entry. A potential take profit level for this trade setup that a user could easily identify would be the 50% mark labeled with the Fair Value Gap & the Equilibrium all displayed automatically by the indicator.
Conclusion
This indicator highlights all relevant components of Smart Money Concepts which can be a very useful interpretation of market structure, liquidity, & more simply put, price action. The term was coined & popularized primarily within the forex community & by ICT while making its way to become a part of many traders' analysis. These concepts, with or without this indicator do not guarantee a trader to be trading within the presence of institutional or "bank-level" liquidity, there is no supporting data regarding the validity of these teachings.

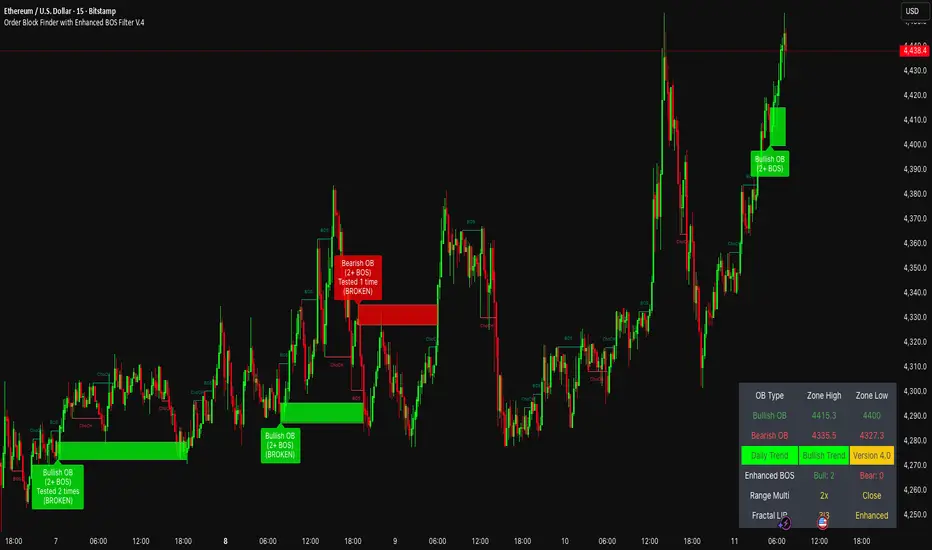
Automatic Order Block + Imbalance by D. BrigagliaThis script combines automatic orderblock and imbalance tracking.
Bullish OB - Blue
Bullish Imbalance - Green
Bearish OB - Red
Bearish Imbalance - Orange
Please note that the actual definitions of orderblock and imbalance are not respected in this script for the sake of simplicity. Scripts that are too complex may overfit some particular chart. Since there is no way to translate the actual ob and imb definitions into pinescript language, I decided to keep it simple.
Ideally, you want to see a bullish OB followed by buy side imbalance, or viceversa. OBs that are broken weakly are generally invalidated, ones that are broken strongly generally become breakers, and you can use them as good support/resistance levels.
Also, a good thing you can do when an OB and an imbalance match, is going in the lower timeframes and catching the structure reversal in the OB or imbalance zone. That may provide excellent RR trades. Always trade with OB that confirm the HTF trend.
Nothing in my content on tradingview is considerable investment advice.

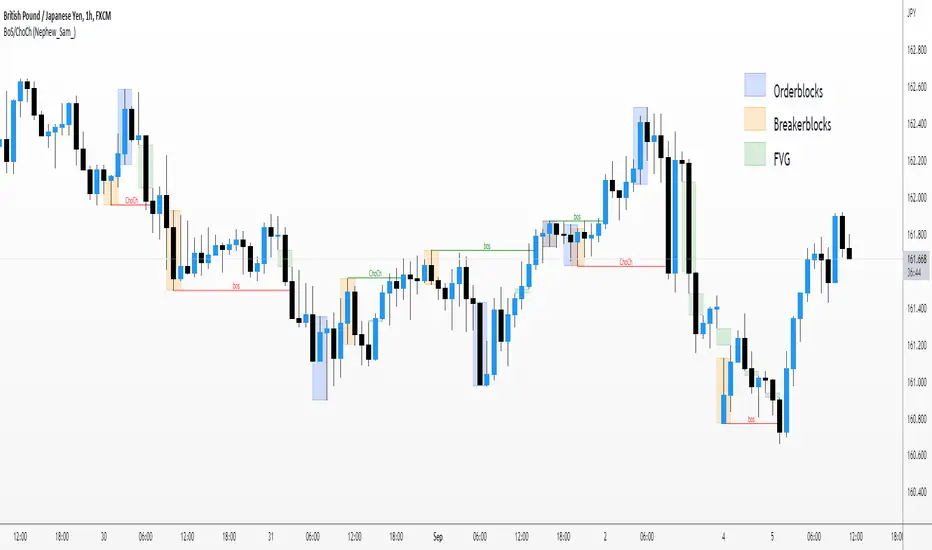
Market Structure BOS/CHOCH/MSB/FVG/OB/BB (Nephew_Sam_)This market structure indictor uses pivot points to find break of structure and change of character.
You can enable the options to find Fair Value Gaps, Breaker Blocks and Orderblocks too. The way this works is, once a bos/choch is found, it will loop back and find all fvg/ob/bb from that point until the previous pivot point.
Settings
Pivot strength - How many candles to the left/right requried to determine a swing high
Breakout Confitmation - The breakout candle should close under the previous pivot or the wick H/L should be under
Show xyz - show HH/LL, Break of structure and change of character
FVG/OB/BB - Show, bull/bear colors, extend boxes to the right, delete boxes once filled, fill type close or H/L
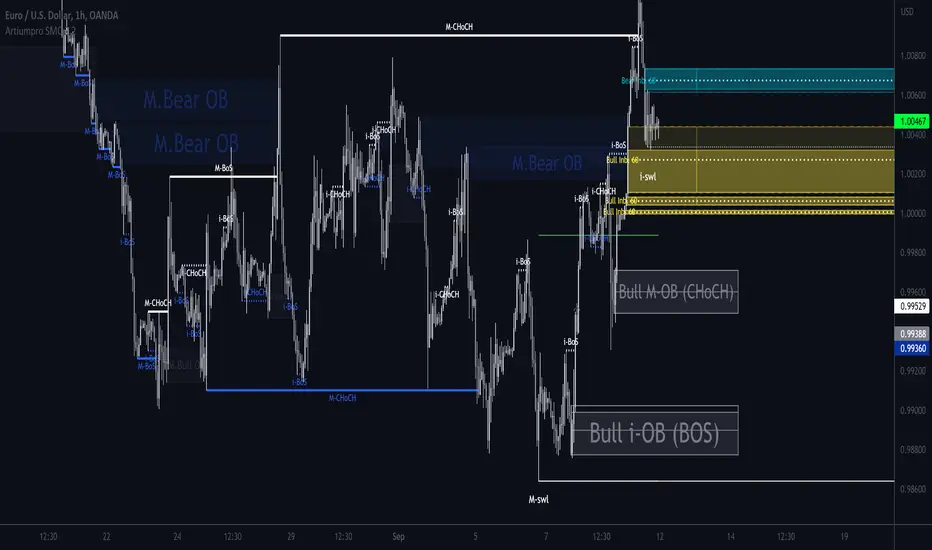
ArtiumPro Main Market StructureThis indicator maps out Market Structure using real time price action rather than simply pulling "pivot" points. Use to see at a glance where a BOS or CHoCH has occurred and where the current and historic highs and lows are.
- M-BOS happens when a main break of structure occurs (trend continuation) the continuation of a bullish or bearish trend.
User setting change line style, color and transparency & turn off text, change text color and transparency
- M-CHoCH happens when a Change of Character occurs (trend change) this is the 1st sign of a possible change of the trend direction from bullish to bearish or bearish to bullish
User setting change line style, color and transparency & turn off text, change text color and transparency
- M-swh & M-swl are the current active unmitigated highs and lows
- User setting for M-swh & M-swl allows you to chose the amount of active highs / lows you want to see on the chart. this can be used at a glace to see where potential liquidity may be laying. If you only want to see the last most current
high an low you can turn on the "just last active" option box.
- User settings to turn on or off the old mitigated highs lows making it easy to see at a glance when old highs and lows have been broken or swept. The label for this is also customizable to user preference.

FXC Order Block Finder █ OVERVIEW
The FXC Order Bock Finder finds and draws institutional order blocks according to the Smart Money Concept. Order blocks are zones where institutions have most likely left some orders that need to be filled at a later point in time. In These order blocks or POIs can be used to either place limit orders or to look for instant entries as price comes to retest the zone. It works on all time frames but higher time frames tend to be more precise.
█ HOW DOES IT WORK?
The indicator waits for a break of structure (BOS) and then prints a zone if there's an engulfing pattern and an open imbalance. Basically it draws zones where a fake move followed by aggressive buying or selling happened and Imbalances were left open.
█ WHAT MAKES IT UNIQUE?
Apart from the fact that I haven’t found any indicator that is able to properly draw order blocks most indicators do re-paint which doesn’t make any sense in the case of the Smart Money Concept.
Furthermore does this indicator have settings that let’s you adjust how the order blocks are drawn. From wick to end of the imbalance or candle close to imbalance. Also you can set how many candles it takes into consideration for the imbalance in case the imbalance starts after the engulfing pattern has formed. And you can set how many candles have to checked to determine a BOS or an internal BOS by using fractal breaks.
█ HOW TO USE IT?
Either place sell limits at the lower end of the order block with SL slightly above the OB and buy limits at the upper end of the OB with SL slightly below the OB. Target a fixed Risk Reward Ratio or trade it to the next order block. By using multi time frame analysis you can determine the overall direction of the market and prevent low probability trades. Also worth mentioning is that order blocks that have been created during high volume sessions tend to result in way better trades than with order blocks that have been printed during the Asia session.
█ ADDITIONAL INFO
As soon as price retested an order block the order block is mitigated and therefore not valid anymore. Also order blocks that are too far back in time are less probable to deliver good trades. In general the win rate tends not to be too high using this method but more often than not there's a reaction as price taps into an order block and trades with high RRR are quite often. As always in trading, proper money management and risk management is key.
█ DISCLAIMER
This is not financial advice. The Indicator spots these zones according to the smart money concept . However there's absolutely no guarantee that a nice order blocks results in a good trade.
█ Examples

PT OrderBlockVersion 1.0 of the PT OrderBlock indicator was developed to visually identify supply & demand zones within price. This indicator can be used on all timeframes. My preferred method is swing trading the higher timeframe.
Orderblocks are formed when there is a break in structure once a big buy/sell candle has formed. These "blocks" will eventually get revisited on a retest acting as major support/resistance. An orderblock for a demand zone is populated on the chart when there is a bearish candle before a swift move to the top side (opposite direction). The same goes for the orderblock that is formed for a supply zone, it is the last bullish candle before a swift move to the downside. Once you see such behavior, the indicator will populate the orderblock for you. When an orderblock gets mitigated (tapped into) the indicator will change colors of the block to allow you to distinguish between a fresh and already taped supply/demand zone. It has been proven effective to enter entries based on retests of the orderblocks which take place AFTER a break in market structure.
*PT OB Features:
-OBs that have been partially filled will remove a portion of the background zone to indicate how much of the orderblock is left to fill in the full zone (Toggle Highlight remaining OB).
-OB trigger can be switched between candle open & wick. I prefer wick because it increases the probability of catching a low/high.
Video with strategy will be uploaded shortly! It is included as part of the library. Just message us for access!

Orderblocks (Nephew_Sam_) - Open sourceHighlights orderblocks based on fractal market structure.
Whenever a new fractal high/low is created, it will search for the Orderblock and plot lines and labels
Options:
1. Select 3/5 bar fractal
2. Plot lines and labels on OB's
- Ability to filter OB only when a candle is fully engulfed
3. Change bar color of engulfed candles
4. Option to filter OB that follows with an FVG
View the published chart for more details on how this indicator works
Disclaimer: You have the permissions to use this code however make sure you give me the credits when you do and make it open source or grant me access to the code.
Extreme Bars"Extreme Bars" is a simple but useful indicator that marks overbought and oversold candles. This indicator paints candles that fall far above the average red, and the candles that rise above the average green. Of course, they can change these colors if they want. "Extreme Bars" can be interpreted in many different ways. The starting points of colored candles can often be good support or resistance. In addition, it would be wise to close the positions opposite the colored candles and to maintain the positions compatible with the colored candles. It is also possible that the gaps formed by the colored candles will be closed in the future. The sensitivity of the indicator can be changed in the settings section.

Order Blocks Indicator By ForexBee V.1
What are Order Blocks:
Order blocks in forex refer to the collection of orders of big banks and institutions in forex trading. The big banks do not just open a buy/sell order but distribute a single order into a check of blocks to maximize the profit potential. These chunks of orders are called order blocks in trading.
Types of order blocks
Order blocks are categorized into two types in trading based on order types.
Bullish order block
Bearish order block
Bullish order block
When a bullish impulsive wave forms after the break of a ranging market structure or block, it indicates the formation of a bullish order block.
When the price returns to the order block zone, we’ll open buy orders to trade with institutions.
Bearish order block
When a bearish impulsive wave forms after the break of price range or block, a bearish order block forms. We’ll open sell orders from the bearish order block zone when the price returns to this zone in the future.
How to draw an order block zone in trading?
To draw an order block, you should first learn to identify the chart’s price range or price block.
In the next step, mark the highest point and the lowest point of the price range
Draw a horizontal zone meeting the high and low of the order block zone. This will act as an order block zone.
ArtiumPro Smart Money ConceptsSmart money concepts refer to the use of institutional trading strategies which align with the perspectives of Smart Money in the market. i.e. the composite man. Market Structure is the foundation of price action trading, understanding price action is fundamental to SMC.
ArtiumPro SMC 2.1 is an SMC (Smart Money Concepts) indicator full of features to aid SMC traders. Our aim is to save you time with automatic chart mark-up and help you spot areas of interest you may miss with the naked eye.
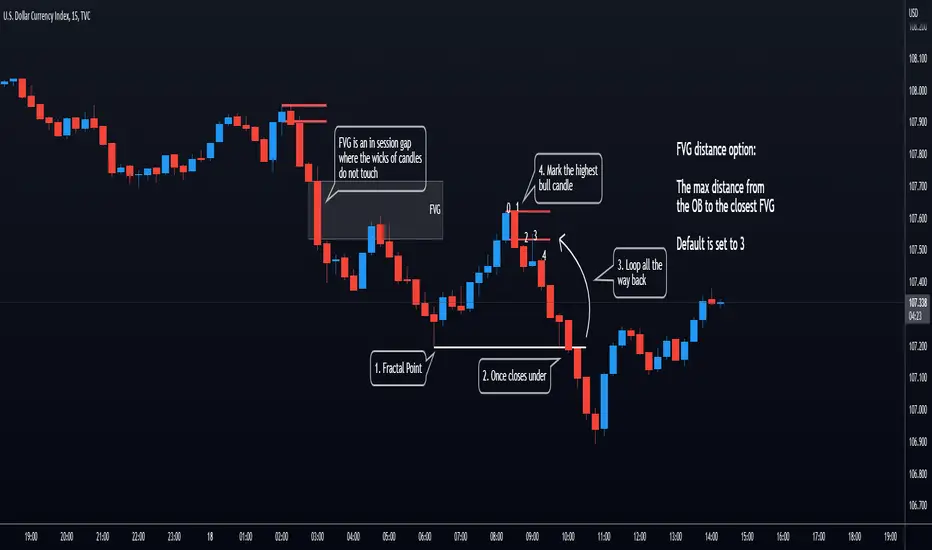
Fvg (Fair Value Gap) - is also known as an imbalance. An FVG is an imbalance of orders, for instance, for sellers to complete their trades, there must be buyers and vice versa so when a market receives too many of one kind of order buys or sells, and not enough of the order's counterpart. When the amount is not balanced and too many orders are put in for one direction, it creates an imbalance.
Multi timeframe FVG - this will show the same as above but on the higher timeframe you choose. It’ll show as 2 lines that show the higher timeframe fvg with a filled box that mitigates on entry.
Order Blocks - These are supply and demand zones, displayed typically as the last down/up candle before a move in the opposite direction. Great POI’s for entry and take profits.
Outside candle - this is a candle that sweeps the highs and lows of the previous candle, best used for the 1 hour or above these can indicate a change of price direction.
Previous day high & low
Not only does it show your previous day's low and high but it also shows your opening and close of the day. You have settings where you can turn off the open and close and just have daily highs and lows. It’s your choice within your settings.
Market Structure - We have packed this feature with options that are customizable for you,
Break of Structure (BOS) indicates a trend continuation.
Change of Character (CHoCH) indicates the first sign of a possible trend change.
Equal Highs/lows - this will mark your double/triple tops and bottoms.
Retracement - set this to your preferred retracement amount to customize your market structure to what you qualify as a valid pullback.
Elliott Wave ZigZag
Many people ask for the Elliott Waves. Well, here it is, inside this SMC. Just like your pivot highs and lows, the Elliott Wave is showing in real-time so you can see where your previous highs and lows are with the Elliott Wave break of structures that you can use in conjunction with the Smart Money Concepts Indicator of ArtiumPro.
Fib levels - for Premium & Discount areas - in this Instance the fib is used to determine if the price has pulled back into a premium or discount zone for optimal trade entry.
Trading Sessions
One of the most advanced trading session indicators out there and it’s included inside the most advanced SMC indicator on the market today. It has open breakout and settings to filter the opening range along with your pip daily range. You can select what timezone you are in and it automatically adjusts on the chart. Cool right? Hope you enjoy it, happy trading!
Smart Money BusterAfter daytrading for a while i came into conclusion that price action trading is the most successful way to trade for me and this project was for me to simplify my way of trading at the beginning. Eventually it got big and turned into a very useful helper indicator for me to setup on different pairs for alerts and only look at the charts to decide for entry when the alerts come from 120 different pairs that i set it up. Since i always looked at indicators for a way to make my job simpler and give me more time to do more important things for me rather than drawing lines on different pairs eveyday i think it got to a point where it works to my liking and making me gain time, thus more money.
This indicator uses smart money concepts like Market Structure, Order Blocks, Quassimodo Levels, Structure Breaks, Pumps and Dumps, Imbalances(In the works will be added in first update) to help trader catch what the whales are thinking and how to enter in the right time for swing trading, catching bottoms and tops.
Here are some of the features as of release:
Detects Market Structure and draws zig-zag lines and keeps note of pivot points.
Detects Order blocks and draws boxes when the conditions met
Detects the quassimodo levels and changes the color of the box to signal double confluence meaning stronger signal
Draws structure break lines
Setting to set structure break percentage before drawing boxes to get the boxes drawn if you want to be more 'sure' about the Order Block Levels.
Setting to change depth and backstep values for zigzags to be able to let you fit the system for different time frames.
Setting to set MSB trigger point between High and Low, Close and Open or hl2 values.
Setting to set Signal Triggering Range between Start, Middle and End meaning eg. if you set it to Middle it will wait for MSB trigger point to hit the middle of the box before giving you a signal.
Setting for changing HH-LL pivot points lookback count, 5 as default. Increasing this value will make you compare your pivot points with more data, really useful in lower time frames where will be a lot of zig-zags and highs and lows giving you a method to avoid false signals. Recommended to keep it lower values on 30 min and higher and increase it in lower Timeframes according to market volatility.
Setting to add a Box limit where the box of order block will be set invalid after certain candles and it still didn't trigger. Default value of 0 means it's disabled.
Setting to set Candle volatility percentage value to avoid big candles getting opposite signals on fast pump or dump schemes and bust those market makers schemes. Gotta say this came out really handy in crypto markets :)
As an end you can set alerts for 'Buy' , ' Sell ', ' Buy and Sell' together or if you wish you can connect it to bots via webhook as an entry. Although haven't connected to any bots myself as i think the best method of trading is human and machine working together. Since we have the creativity and out of the box thinking and machines have the ability to brute force calculation and huge bandwith that we don't currently have. At least until Elon Musk turns is into a cyborg, which i am not very eager about.
Planned Features:
- Add ability to detect imbalances(fair value gaps) to add third confluence to detect dragon fruit entries. This will make the system work with triple confluence.
- Add more settings so humans can command the ai better.
- Maybe a strategy version after i write my own dynamic take profit algorithm to give system ability make quantitative decisions based on current position profit levels.
- Although i think i fixed almost all the important bugs if there ever comes up one bugs will take priority for updates.
- And some things i may decide to add later. I will keep working on this project since it works well for me.
And like always, happy trading.

[VC] Cumulative Delta PLUS It is a Merged Version of our following two indicators.
V.C Box Chart Histogram
&
V.C Cumulative Delta Histogram.
We merged them at the user's request & convenience. This merged version also helps to save space for other indicators.
Description & Usage
Description & Usage will remain the same as described in individual descriptions of the above-mentioned parent indicators. Only one additional input is added to adjust the scale, named "Scale_Setting''.
Because now it's a merged version of 2 different indicators & both indicators have their different scale levels. To bring both indicators on an equal scale so that they can be visualised better, we have added scale adjustment settings that are easy to understand. Let's elaborate it.
Scale adjustment settings belong to the Cumulative length of the ' 'Cumulative Delta Indicator'' . Keep in mind that the best scale setting is keeping the scale setting values near or equal to cumulative length.
For example:
If you set cumulative length 20, the scale setting value should also be 20 or near 20 (like 17, 18, 19 etc.). (It depends on you, how large cumulative columns you want to see relative to Box chart Histogram)
Note: Any scale setting value can be used, it only affects visuals, not the actual calculations.
Disclaimer Note:
V.C Cumulative Delta Histogram It is purely Volume, Delta, Demand & Supply imbalance and comparative analysis-based tool. Before applying this Indicator to your study, you should clear your concepts about Volume, Delta & Spread, Demand & Supply, and Aggressive & Passive behaviour of buyers/sellers.
Some basic understanding of Sir Richerd Wyckoff's Theory can also be helpful.

Sonarlab - SMC Multi Timeframe add-onThe SMC HTF Indicator is an add-on for the original SMC Indicator . This add-on will show you multi timeframe Internal structure points, swing structure points and POI's. This will make it easier for you to do your multi timeframe analyses to speed up the process and save you chart work.
Main features:
- POI's
- Structure points (Swing and Internal)
- Trading panel (based on structure breaks)
Setting overview
Higher timeframe structure
Select timeframe {turn on/ off} / {amount to show}
Internal structure {turn on/ off} / {amount to show}
Swing structure {turn on/ off} / {amount to show}
POI {turn on/ off} / {amount to show}
OB Mitigation {wick/ close}
Alerts
Bullish/ bearish POI
Bullish/ bearish BOS
Bullish/ bearish CHoCH
Swing Bullish/ bearish BOS
Swing Bullish/ bearish CHoCH
Second higher timeframe structure
Select timeframe {turn on/ off} / {amount to show}
Internal structure {turn on/ off} / {amount to show}
Swing structure {turn on/ off} / {amount to show}
POI {turn on/ off} / {amount to show}
OB Mitigation {wick/ close}
Alerts
Bullish/ bearish POI
Bullish/ bearish BOS
Bullish/ bearish CHoCH
Swing Bullish/ bearish BOS
Swing Bullish/ bearish CHoCH
Trading panel
Styling options

Order Blocks Finder By DrewAn Order Block is a technical analysis technique that tracks the accumulation of orders (when bullish) and distribution of orders (when bearish) of banks and institutional traders. In other words, it is an area or an indication of where big institutions would pile up their orders to enter the market – their order blocks.
If you know how order blocks works and know how to trade via order blocks, then this indicator will help you in finding order blocks by itself which you don't need to worry about finding any.
For settings, I personally use Box Length as 10 and Box Transparency 80. Hope this helps! Feel free to drop a comment for any questions :)
Would appreciate you all if you can LIKE and FAVOURITE this indicator.

[VC] Effort & Result Index V1.0V.C. Effort & Result Index draws the Price change, Volume, Delta & Delta % as a histogram. On the positive side of the histogram, it marks the price change & on the negative side of the histogram, it marks volume, delta & delta %. And the best part of the indicator is that it allows you to see all the mentioned data types simultaneously.
See the below chart for a comprehensive understanding.
Before moving further, understand the below analogy first.
Volume & Delta = Fule or Effort
Price Movement = Result
Think of Volume & Delta as FULE or EFFORT and Price Movement as Result.
If the price travels a significant distance with less fule & effort, it indicates that no barriers or inverse forces are stopping the price movement.
On the other hand, if the price is travelling a less distance & consuming comparatively more fule & effort, it indicates some barriers or inverse forces stopping the price movement.
V.C. Effort & Result Index empowers you to read, compare & analyse Volume, Delta & Price effortlessly. It helps to measure the relative price change in different combinations. Such as, you can compare the price change with total volume, delta volume & delta percentage.
See the below relative comparison analysis by using Price Change, Volume Change & Delta Change.
In the above example, you can see that on candle A, there is a very significant price move with a small volume & delta. But on the next candle B, there is a minor price move compared to the previous candle A, but the volume is relatively high & delta is almost the same. In simple words, the same effort was applied to candle B but got fewer results than candle A. It indicates that buyers applied the same effort but failed to get the same results. It reveals that sellers are taking control, leading to a trend reversal.
This comparative analysis method & approach can add an extra edge to your analysis spacially on key levels & breakouts.
V.C Effort & Result Index Settings & Inputs
Price Change:
Allow you to show/hide the price change bars on the positive side of the histogram.
Volume:
Allow you to show/hide the total volume on the negative side of the histogram.
Delta%:
Allow you to show/hide the delta % on the negative side of the histogram.
Delta:
Allow you to show/hide the delta on the negative side of the histogram.
Style Settings
The Style section allows you to change the colors & the view format of all data types.
Disclaimer Note:
V.C Effort & Result Index is not a BUY/SELL signal based indicator or a holy grail trading system.
It is purely Volume, Delta, Demand & Supply imbalance and comparative analysis based tool kit. Before applying this indicator to your analysis, you should know about Volume, Delta & Spread, and Demand & Supply.
Some basic understanding of Sir Richerd Wyckoff's Theory can also be helpful.

[VC] Box Chart Histogram V1.0V.C Box Chart Histogram draws the cumulative delta that correlates to another indicator named ''V.C Box Chart Index'' .
(In other words, ''V.C Box Chart Histogram'' & ''V.C Box Chart Index'' are correlated.)
V.C Box Chart Histogram draws the cumulative delta as histogram based on ''V.C Box Chart Index''. Combining these two indicators empowers you to see the cumulative demand & supply / cumulative buying & selling quantity of each box.
You can also switch from cumulative delta mode to cumulative delta % from input settings. See the difference between simple delta & delta % mode from these examples.
Simple Delta Mode (Cumulative Demand & Supply)
In the above example, green & red boxes on the histogram show the cumulative delta of each box from the main chart. In simple words, these boxes show the cumulative net demand & supply of the corresponding box from the main chart. In this example, Big green boxes indicate demand is increasing, whereas small red boxes indicate that supply is decreasing.
Delta % Mode (Cumulative Volume-Weighted Demand & Supply)
Similar to the simple delta mode, in the above example, blue & red boxes on the histogram show the cumulative delta % of each box from the main chart. In simple words, these boxes show the cumulative & volume-weighted demand & supply of the corresponding box from the main chart.
In this example, Big blue boxes indicate that demand is increasing, whereas small red boxes indicate that supply is decreasing.
V.C Box Chart Histogram Properties & Settings
Inputs
Choose Your Source:
Allow you to switch from simple delta to delta %
Choose color of the box on simple delta:
Allow you to change the color of the box
Choose color of the box on delta %:
Allow you to change the color of the box
Style
Positive & Negative Simple Delta:
Allow you to see the simple delta in the column format.
Positive & Negative Delta %:
Allow you to see the delta % in the column format.
Boxes:
Allow you to show/hide the boxes
NOTE: You can also see both delta formats in dual view mode. (in column & box at the same time to have a more precise & detailed look)
See Below Example
Disclaimer Note:
V.C Box Chart Histogram is not a Buy/Sell signal based indicator or a holy grail trading system. It is purely a leading indicator that can help you to analyse demand & supply and buying & selling forces of the market in a smart & effortless way. Before applying this indicator to your analysis, you should have some basic knowledge about volume, delta, & supply & demand. Some basic understanding of Sir Richerd Wyckoff's Theory can also be helpful.

Order Block and Daily Levels VTRENDThe Order Block and Daily Levels is my first script designed to add context with order blocks to how i trade.
I have included a volume weighted band in green, as it's use is core to my trading style. I have often found however, there needs to be more clarify in structure which some of my previous scripts did not provide, so i have coded up some custom order blocks, which can be altered along the lines of how sensitive they are.
There is also a high time frame volume average line to combine the green volume weighted band to identify a bullish or bearish trend.
The other key change I am experimenting with, is trading off the daily levels, this is reflected here with a change is barcolor, above or below the daily level and a 'cross' symbol.
Included are 'chance of reversal' diamonds.
You can see here with the trend, volume and structure information given, there is a clearer idea of where price might head to next. Combine this with yur own levels too.
This can be useful on low time frames too.
So far I have experimented with this script on the 4/2/1 hour and 25 / 5 minutes

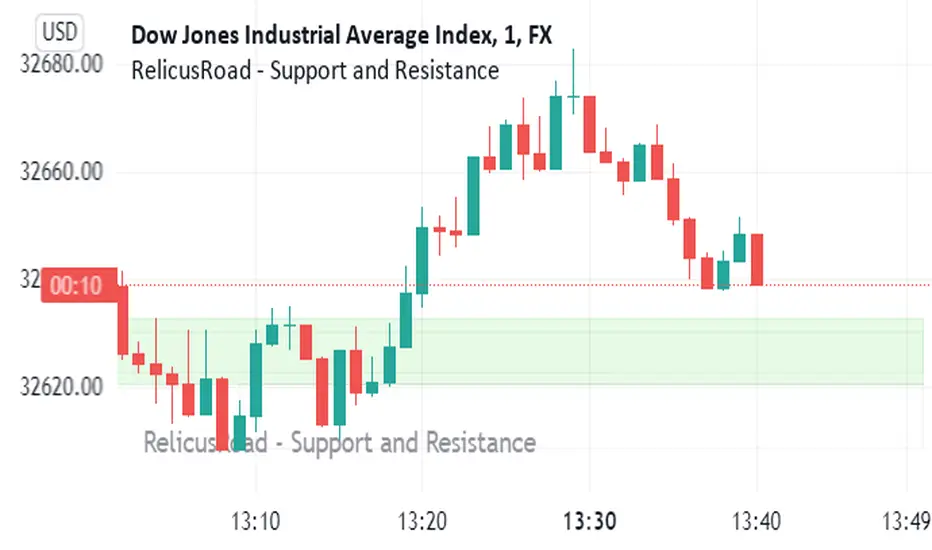
RelicusRoad - Support and ResistanceWe bring you dynamically created fundamental support and resistance analysis required for any instrument a trader trades.
Support & Resistance Concept
The concepts of trading level support and resistance are undoubtedly two of the most highly discussed attributes of technical analysis . As part of analyzing chart patterns, these terms are used by traders to refer to price levels on charts that tend to act as barriers, preventing the price of an asset from getting pushed in a certain direction.
At first, the explanation and idea behind identifying these levels seem easy, but as you'll find out, support and resistance can come in various forms, and the concept is more difficult to master than it first appears, this is where RelicusRoad - Support and Resistance comes in and draws them for you.
Technical analysts use support and resistance levels to identify price points on a chart where the probabilities favor a pause or reversal of a prevailing trend.
Support occurs where a downtrend is expected to pause due to a concentration of demand.
Resistance occurs where an uptrend is expected to pause temporarily, due to a concentration of supply.
Market psychology plays a major role as traders and investors remember the past and react to changing conditions to anticipate future market movement.
Support and resistance areas can be identified on charts using trendlines and moving averages.
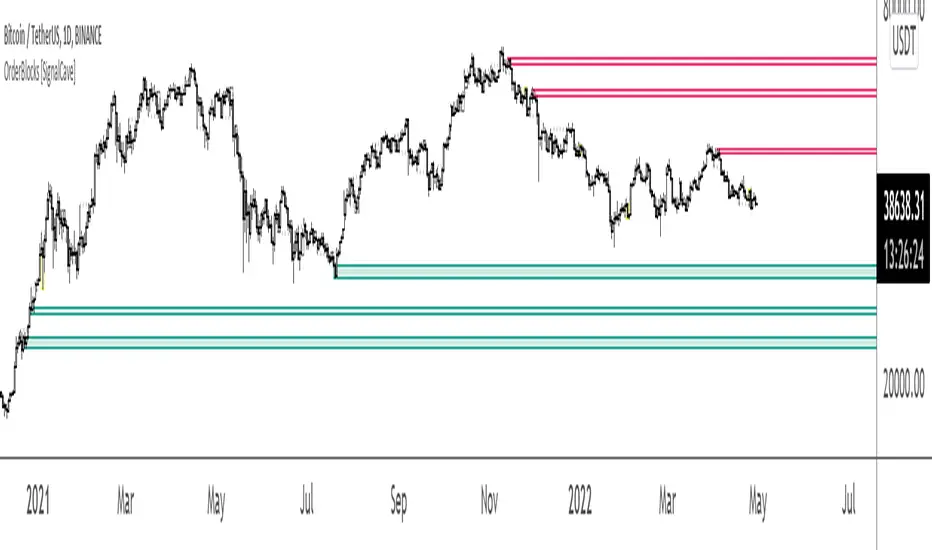
OrderBlocks [SignalCave]The OrderBlocks indicator is used to find the supply and demand zones that represent the support and resistance.
What it is Demand Zone?
A demand zone is the price area at which the traders usually buy. This area is present below the current price, where the highest buying interest or potential. This means the demand zone has many buyers available due to many buying orders at that level. When the price hits this level, the unfilled orders get completed and bring up the price.
What it is Supply Zone?
A supply zone is the price area at which the traders usually sell. This area is present above the current price, where the highest selling interest or potential. When the price hits this level, the unfilled orders get completed and bring down the price.
OrderBlocks Indicator
OrderBlocks indicator have four main visual output which are active demand zones (green), active supply zones (red), tested zones (yellow) and inactive zones (black).
Active Zones: Once the market structure breakout or breakdown, indicator draws a new zone (green or red). When the price enters in the active zone at the first time, price tends to bounce over it.
Tested Zones: If price touches the active zone but did not close any bar over or below it, indicator marks the tested zone as a yellow color. If the price touches multiple times, zone get weaker and tend to break when the price enters same zone once again.
Inactive Zones: If bar close over or below any active zone then indicator marks it as a black color and it turns an inactive zone afterwards. Inactive zones have less effective price turning points compare to active and tested zones.
Supply and Demand - Order Block - Energy CandlesSupply and Demand - Order Block - Energy Candles
Description
An experimental script, designed as a visual aid, to highlight the last up or down candle before a fractal break. We can assume these candles where the point of origin that generated enough strength to break recent structure. By using them as reference points, traders are expected to follow their own set of rules and mark higher probability supply and demand zones in the area.
How to use:
Expect a potential retest in these areas, and if they fail, a potential retest in the opposite direction. The greater the number of times a zone is tested, the more likely it is to break. A fresh zone that has not yet been tested will have a higher probability of a bounce.
Fractal period and candle break type can be personalised in settings. Can be used on all timeframes (higher the better).
Indicator in use:
Extras:
An option to flip candle colours if current price is above or below them has been added.
