Previous Key Levels (fadi)Previous Key Levels indicator is a highly configurable OHLC levels tool designed to provide traders with the ability to plot multiple levels while minimizing screen clutter. This indicator is perfect for those who want to monitor various timeframes simultaneously without overloading their charts with unnecessary information.
How to Use It
This indicator offers traders the flexibility to track up to 6 higher timeframes (HTFs) and multiple candles for each timeframe. For example, a trader can choose to monitor the OHLC of the last four 4-hour candles, providing a comprehensive view of significant price levels over different periods.
Key Features
Highly Configurable: Customize the number of timeframes and candles to suit your trading strategy.
Minimal Screen Clutter: Efficiently plot multiple levels without overwhelming your chart.
Flexible Application: Ideal for identifying support and resistance levels, liquidity sweeps, target levels, and more, adapting to various trading styles.
Traders have diverse trading styles and preferences. Some may use these levels to identify support and resistance zones, while others might look for liquidity sweeps or set target levels. By offering a high degree of customization, the Previous Key Levels indicator caters to the unique needs of individual traders, helping them make informed decisions based on historical price action across multiple timeframes.
Timeframe Settings
Toggle to track 6 HTF settings and the number of candles to track for each.
Limit to next HTFs only can be used to limit the HTF levels displayed based on the current timeframe.
Hide Above will disable the indicator above the specified interval.
Offset to Left and Right are used to specify where the level line starts and ends based on the current candle.
Offset between HTFs extends HTF levels to become more readable.
HTF Settings
Choice of the OHLC levels to track.
Specify the color, line style, and line width for each level.
Mark the start of that level, for example, draw a vertical line where the 4H candle has started.
Trace back to draw optional lines to track back to the origin of the level.
Label Settings
Highly configurable labels that allow traders to customize the labels to their liking.
Label color, background, and size.
Customize using up to 9 configurable parts.
Fading Levels
To prevent clutter, the indicator offers the option to change the transparency of the levels based on their distance from the current price. The distance is calculated based on a configurable Average True Range (ATR).
Change Transparency to a percentage of its current color.
Range should be within X candles will fade any level that is X candles length away from the current price.
ATR length used in calculation will calculate the average size of candles in the calculation.
Ohlcranges

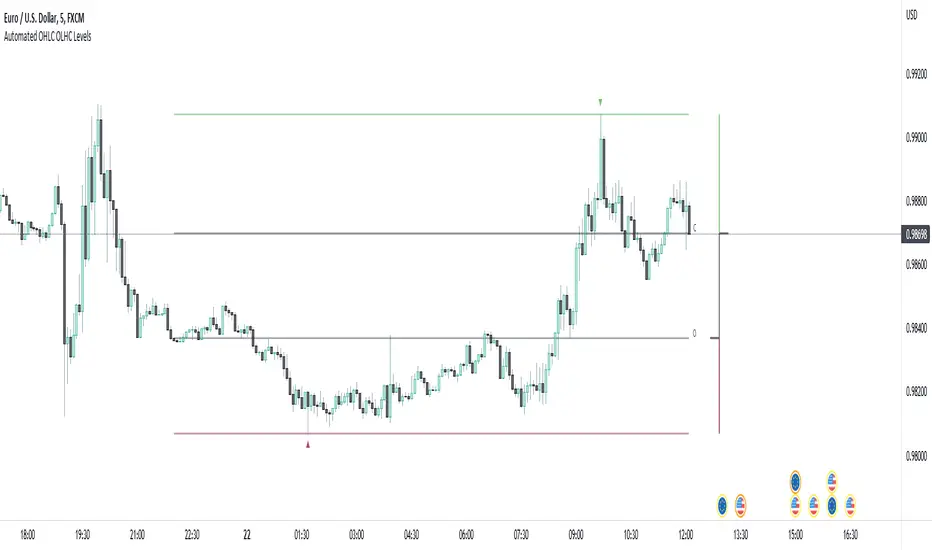
Automated OHLC OLHC LevelsA simple, clean, effective visualization tool, for the OHLC or OLHC of a chosen candle/timeframe.
Apply this indicator using a higher timeframe, in conjunction with other levels and the directional bias, to easily recognize trading opportunities at lower timeframes.
OHLC - H.D.W.MThis indicatos plots Open and Close of the Curernt and Previous Day, Week or Month. It also shows the Highs and Lows of the Hourly, Daily, Weekly and Monthly Timeframes.

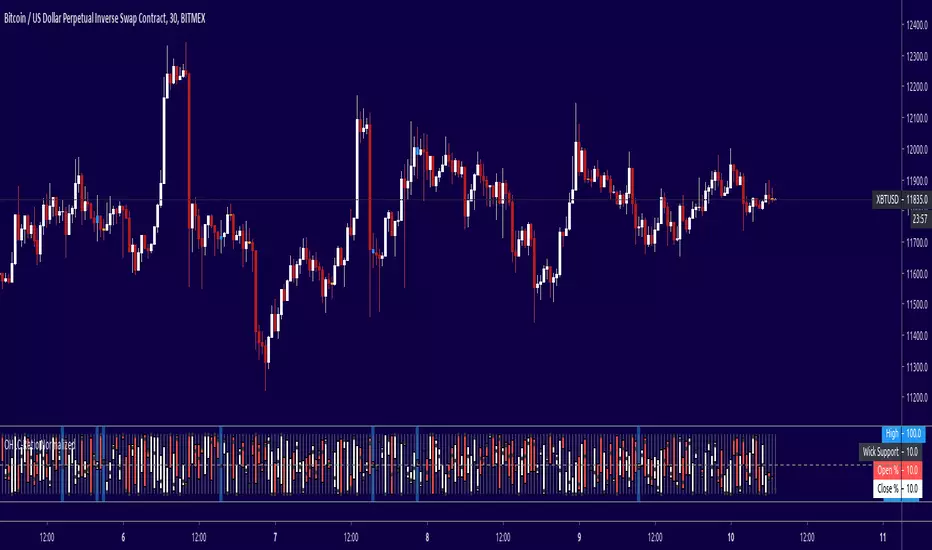
OHLC-RatioThis one is quite useful to quickly see candle length, full range compared to closing range and difference.
