Forex Sessions UTC + customise (DST Support)This Pine Script is designed to highlight forex trading sessions on a TradingView chart, showing which session (Asia, London, New York, Frankfurt, Sydney) is active based on your selected timezone offset and daylight saving time (DST) settings. It also includes an option to highlight session overlaps, like the London-New York and Asia-London overlaps.
Let's break down the script in detail:
### 1. **Inputs**:
* **`timezoneOffset`**:
* This input allows you to select your local timezone offset in hours relative to UTC (e.g., -2 for UTC-2 or +3 for UTC+3). It helps adjust the session times based on your local time.
* **`isDST`**:
* A boolean input that determines if Daylight Saving Time (DST) is active or not. If DST is enabled, the session times will be adjusted by one hour.
### 2. **Function: `timeInDailyRange`**:
This function checks if the current time (bar) is within a given session's start and end time.
* **`startH, startM`**: Start time of the session (hours and minutes).
* **`endH, endM`**: End time of the session (hours and minutes).
* **`tzOffset`**: The timezone offset in hours (which adjusts the start and end times for different regions).
The function handles sessions that cross over midnight. For example, the Asia session starts at 23:00 UTC and ends at 07:00 UTC, so it checks if the current time falls within that period.
### 3. **Session Times (in UTC)**:
Each trading session has specific times defined in UTC:
* **Asia Session**: 23:00 UTC to 07:00 UTC
* **London Session**: 08:00 UTC to 16:00 UTC
* **New York Session**: 13:00 UTC to 21:00 UTC
* **Frankfurt Session**: 07:00 UTC to 15:00 UTC
* **Sydney Session**: 21:00 UTC to 05:00 UTC
These times are defined in 24-hour format, and they represent the opening and closing hours for each market.
The script uses specific colors to represent different sessions:
* **Asia**: Yellow (`asiaColor`)
* **London**: Red (`londonColor`)
* **New York**: Navy Blue (`nyColor`)
* **Frankfurt**: Blue (`frankfurtColor`)
* **Sydney**: Green (`sydneyColor`)
* **Overlaps**:
* London-NY overlap: Purple (`overlapLN`)
* Asia-London overlap: Orange (`overlapAL`)
These colors are used to highlight the background during active sessions.
### 5. **Session Highlighting**:
The script uses the `bgcolor` function to change the background color of the chart when a session is active.
* For each session, it checks whether the current time (bar) falls within the session's time range (adjusted by the `timezoneOffset`).
* If a session is active, it will highlight the chart background in the corresponding session color.
### 6. **Overlaps**:
* **London-NY Overlap**: The script checks if both the London session and the New York session are active at the same time (i.e., if their time ranges overlap). If so, it highlights the overlap area in purple.
* **Asia-London Overlap**: Similarly, the script checks if both the Asia and London sessions are active at the same time, and if so, it highlights the overlap area in orange.
### 7. **Daylight Saving Time (DST) Adjustment**:
* If the **`isDST`** flag is enabled (i.e., DST is active), the script adjusts the session start and end times by adding one hour to each session. This is because during DST, trading hours shift by one hour (usually in regions that observe DST).
* This adjustment is applied to all session times, so the script accounts for the time change and ensures that the session times are correctly displayed.
### 8. **Final Background Color Logic**:
* The `bgcolor` function checks whether each session is active by calling `timeInDailyRange` for each session and then colors the chart accordingly.
* It also checks for overlapping sessions and colors the chart with the appropriate overlap color.
### Example Scenario:
1. **Timezone Offset**: If you select `timezoneOffset = 3` (UTC+3), the session times will be adjusted by adding 3 hours to the start and end times.
2. **Daylight Saving Time (DST)**: If `isDST = true` is selected, the session start times will shift by 1 hour forward (e.g., 23:00 UTC becomes 00:00 UTC for Asia).
3. **Visual Outcome**: The chart will display different colors in the background depending on which trading session is active (e.g., red for London, navy for New York), and purple or orange for overlap sessions.
### Key Features:
* **Customizable Timezone Offset**: Adjust session times to reflect your local timezone.
* **Daylight Saving Time Support**: Automatically adjusts session times during DST.
* **Highlighting Sessions**: Color the chart background to visualize when different trading sessions are active.
* **Overlap Highlighting**: Highlights the periods when certain sessions overlap (London-NY, Asia-London).
In summary, this script is useful for traders who want to visually see when different forex trading sessions are active on the chart, with flexibility for timezone and DST adjustments.
Newyork

Trading Sessions The sessions are individually selectable, meaning you can choose which sessions you want to display.
There is also a legend in the bottom left showing the corresponding trading hours.
Displayed sessions:
ASIA
LONDON
NEW YORK
#ZEBI

Sesion Operativa - Codigo InstitucionalThis indicator is designed for institutional and precision traders who need to visualize market liquidity and key session operating ranges without visual clutter.
Unlike standard session indicators, this tool focuses on clarity and the projection of key levels (Highs and Lows) to identify potential future reaction zones.
Key Features:
4 Customizable Sessions: Pre-configured with key institutional times (Pre-NY, NY Open, London, and Asia). Each session is fully adjustable in time, color, and style.
Minimalist Labeling: Displays the session name and operating range (in pips/points) in a clean, direct format (e.g., NY - 45), removing decimals and unnecessary text to keep the chart clean.
Range Projections: Option to project the Highs and Lows of each session forward (N candles) to use them as dynamic support or resistance levels.
Opening Highlight (NYSE): Special feature to highlight candle colors during specific high-volatility times (default 09:30 - 09:35 UTC-5), perfect for identifying manipulation or liquidity injections at the stock market open.
Adjustable Time Zone: Default setting is UTC-5 (New York), but fully adaptable to any user time zone.

SP500 Session Gap Fade StrategySummary in one paragraph
SPX Session Gap Fade is an intraday gap fade strategy for index futures, designed around regular cash sessions on five minute charts. It helps you participate only when there is a full overnight or pre session gap and a valid intraday session window, instead of trading every open. The original part is the gap distance engine which anchors both stop and optional target to the previous session reference close at a configurable flat time, so every trade’s risk scales with the actual gap size rather than a fixed tick stop.
Scope and intent
• Markets. Primarily index futures such as ES, NQ, YM, and liquid index CFDs that exhibit overnight gaps and regular cash hours.
• Timeframes. Intraday timeframes from one minute to fifteen minutes. Default usage is five minute bars.
• Default demo used in the publication. Symbol CME:ES1! on a five minute chart.
• Purpose. Provide a simple, transparent way to trade opening gaps with a session anchored risk model and forced flat exit so you are not holding into the last part of the session.
• Limits. This is a strategy. Orders are simulated on standard candles only.
Originality and usefulness
• Unique concept or fusion. The core novelty is the combination of a strict “full gap” entry condition with a session anchored reference close and a gap distance based TP and SL engine. The stop and optional target are symmetric multiples of the actual gap distance from the previous session’s flat close, rather than fixed ticks.
• Failure mode it addresses. Fixed sized stops do not scale when gaps are unusually small or unusually large, which can either under risk or over risk the account. The session flat logic also reduces the chance of holding residual positions into late session liquidity and news.
• Testability. All key pieces are explicit in the Inputs: session window, minutes before session end, whether to use gap exits, whether TP or SL are active, and whether to allow candle based closes and forced flat. You can toggle each component and see how it changes entries and exits.
• Portable yardstick. The main unit is the absolute price gap between the entry bar open and the previous session reference close. tp_mult and sl_mult are multiples of that gap, which makes the risk model portable across contracts and volatility regimes.
Method overview in plain language
The strategy first defines a trading session using exchange time, for example 08:30 to 15:30 for ES day hours. It also defines a “flat” time a fixed number of minutes before session end. At the flat bar, any open position is closed and the bar’s close price is stored as the reference close for the next session. Inside the session, the strategy looks for a full gap bar relative to the prior bar: a gap down where today’s high is below yesterday’s low, or a gap up where today’s low is above yesterday’s high. A full gap down generates a long entry; a full gap up generates a short entry. If the gap risk engine is enabled and a valid reference close exists, the strategy measures the distance between the entry bar open and that reference close. It then sets a stop and optional target as configurable multiples of that gap distance and manages them with strategy.exit. Additional exits can be triggered by a candle color flip or by the forced flat time.
Base measures
• Range basis. The main unit is the absolute difference between the current entry bar open and the stored reference close from the previous session flat bar. That value is used as a “gap unit” and scaled by tp_mult and sl_mult to build the target and stop.
Components
• Component one: Gap Direction. Detects full gap up or full gap down by comparing the current high and low to the previous bar’s high and low. Gap down signals a long fade, gap up signals a short fade. There is no smoothing; it is a strict structural condition.
• Component two: Session Window. Only allows entries when the current time is within the configured session window. It also defines a flat time before the session end where positions are forced flat and the reference close is updated.
• Component three: Gap Distance Risk Engine. Computes the absolute distance between the entry open and the stored reference close. The stop and optional target are placed as entry ± gap_distance × multiplier so that risk scales with gap size.
• Optional component: Candle Exit. If enabled, a bullish bar closes short positions and a bearish bar closes long positions, which can shorten holding time when price reverses quickly inside the session.
• Session windows. Session logic uses the exchange time of the chart symbol. When changing symbols or venues, verify that the session time string still matches the new instrument’s cash hours.
Fusion rule
All gates are hard conditions rather than weighted scores. A trade can only open if the session window is active and the full gap condition is true. The gap distance engine only activates if a valid reference close exists and use_gap_risk is on. TP and SL are controlled by separate booleans so you can use SL only, TP only, or both. Long and short are symmetric by construction: long trades fade full gap downs, short trades fade full gap ups with mirrored TP and SL logic.
Signal rule
• Long entry. Inside the active session, when the current bar shows a full gap down relative to the previous bar (current high below prior low), the strategy opens a long position. If the gap risk engine is active, it places a gap based stop below the entry and an optional target above it.
• Short entry. Inside the active session, when the current bar shows a full gap up relative to the previous bar (current low above prior high), the strategy opens a short position. If the gap risk engine is active, it places a gap based stop above the entry and an optional target below it.
• Forced flat. At the configured flat time before session end, any open position is closed and the close price of that bar becomes the new reference close for the following session.
• Candle based exit. If enabled, a bearish bar closes longs, and a bullish bar closes shorts, regardless of where TP or SL sit, as long as a position is open.
What you will see on the chart
• Markers on entry bars. Standard strategy entry markers labeled “long” and “short” on the gap bars where trades open.
• Exit markers. Standard exit markers on bars where either the gap stop or target are hit, or where a candle exit or forced flat close occurs. Exit IDs “long_gap” and “short_gap” label gap based exits.
• Reference levels. Horizontal lines for the current long TP, long SL, short TP, and short SL while a position is open and the gap engine is enabled. They update when a new trade opens and disappear when flat.
• Session background. This version does not add background shading for the session; session logic runs internally based on time.
• No on chart table. All decisions are visible through orders and exit levels. Use the Strategy Tester for performance metrics.
Inputs with guidance
Session Settings
• Trading session (sess). Session window in exchange time. Typical value uses the regular cash session for each contract, for example “0830-1530” for ES. Adjust if your broker or symbol uses different hours.
• Minutes before session end to force exit (flat_before_min). Minutes before the session end where positions are forced flat and the reference close is stored. Typical range is 15 to 120. Raising it closes trades earlier in the day; lowering it allows trades later in the session.
Gap Risk
• Enable gap based TP/SL (use_gap_risk). Master switch for the gap distance exit engine. Turning it off keeps entries and forced flat logic but removes automatic TP and SL placement.
• Use TP limit from gap (use_gap_tp). Enables gap based profit targets. Typical values are true for structured exits or false if you want to manage exits manually and only keep a stop.
• Use SL stop from gap (use_gap_sl). Enables gap based stop losses. This should normally remain true so that each trade has a defined initial risk in ticks.
• TP multiplier of gap distance (tp_mult). Multiplier applied to the gap distance for the target. Typical range is 0.5 to 2.0. Raising it places the target further away and reduces hit frequency.
• SL multiplier of gap distance (sl_mult). Multiplier applied to the gap distance for the stop. Typical range is 0.5 to 2.0. Raising it widens the stop and increases risk per trade; lowering it tightens the stop and may increase the number of small losses.
Exit Controls
• Exit with candle logic (use_candle_exit). If true, closes shorts on bullish candles and longs on bearish candles. Useful when you want to react to intraday reversal bars even if TP or SL have not been reached.
• Force flat before session end (use_forced_flat). If true, guarantees you are flat by the configured flat time and updates the reference close. Turn this off only if you understand the impact on overnight risk.
Filters
There is no separate trend or volatility filter in this version. All trades depend on the presence of a full gap bar inside the session. If you need extra filtering such as ATR, volume, or higher timeframe bias, they should be added explicitly and documented in your own fork.
Usage recipes
Intraday conservative gap fade
• Timeframe. Five minute chart on ES regular session.
• Gap risk. use_gap_risk = true, use_gap_tp = true, use_gap_sl = true.
• Multipliers. tp_mult around 0.7 to 1.0 and sl_mult around 1.0.
• Exits. use_candle_exit = false, use_forced_flat = true. Focus on the structured TP and SL around the gap.
Intraday aggressive gap fade
• Timeframe. Five minute chart.
• Gap risk. use_gap_risk = true, use_gap_tp = false, use_gap_sl = true.
• Multipliers. sl_mult around 0.7 to 1.0.
• Exits. use_candle_exit = true, use_forced_flat = true. Entries fade full gaps, stops are tight, and candle color flips flatten trades early.
Higher timeframe gap tests
• Timeframe. Fifteen minute or sixty minute charts on instruments with regular gaps.
• Gap risk. Keep use_gap_risk = true. Consider slightly higher sl_mult if gaps are structurally wider on the higher timeframe.
• Note. Expect fewer trades and be careful with sample size; multi year data is recommended.
Properties visible in this publication
• On average our risk for each position over the last 200 trades is 0.4% with a max intraday loss of 1.5% of the total equity in this case of 100k $ with 1 contract ES. For other assets, recalculations and customizations has to be applied.
• Initial capital. 100 000.
• Base currency. USD.
• Default order size method. Fixed with size 1 contract.
• Pyramiding. 0.
• Commission. Flat 2 USD per order in the Strategy Tester Properties. (2$ buying + 2$selling)
• Slippage. One tick in the Strategy Tester Properties.
• Process orders on close. ON.
Realism and responsible publication
• No performance claims are made. Past results do not guarantee future outcomes.
• Costs use a realistic flat commission and one tick of slippage per trade for ES class futures.
• Default sizing with one contract on a 100 000 reference account targets modest per trade risk. In practice, extreme slippage or gap through events can exceed this, so treat the one and a half percent risk target as a design goal, not a guarantee.
• All orders are simulated on standard candles. Shapes can move while a bar is forming and settle on bar close.
Honest limitations and failure modes
• Economic releases, thin liquidity, and limit conditions can break the assumptions behind the simple gap model and lead to slippage or skipped fills.
• Symbols with very frequent or very large gaps may require adjusted multipliers or alternative risk handling, especially in high volatility regimes.
• Very quiet periods without clean gaps will produce few or no trades. This is expected behavior, not a bug.
• Session windows follow the exchange time of the chart. Always confirm that the configured session matches the symbol.
• When both the stop and target lie inside the same bar’s range, the TradingView engine decides which is hit first based on its internal intrabar assumptions. Without bar magnifier, tie handling is approximate.
Legal
Education and research only. This strategy is not investment advice. You remain responsible for all trading decisions. Always test on historical data and in simulation with realistic costs before considering any live use.

Sessions Highs/LowsThis indicator plots the High and Low of the three main trading sessions:
Asia (20:00–03:00) – green lines
London (03:00–08:00) – blue lines
New York (08:00–13:00) – red lines
Features:
Levels update in real time during each session.
When a new session starts, the previous lines are deleted – only the latest active sessions remain visible.
Default session times are set to Asia (20:00–03:00), London (03:00–08:00), and New York (08:00–13:00), but you can adjust them to your own custom hours in the settings.
Colors can also be customized.
Use cases:
Quickly visualize session ranges.
Track session highs/lows for breakouts, fakeouts, and reactions around liquidity zones.

Sessions Full Markets [TradingFinder] Forex Stocks Index 7 Time🔵 Introduction
In global financial markets, particularly in FOREX and stocks, precise timing of trading sessions plays a crucial role in the success of traders. Each trading session—Asian, European, and American—has its own unique characteristics in terms of volatility and trading volume.
The Asian session (Tokyo), Sydney session, Shanghai session, European session (London and Frankfurt), and American session (New York AM and New York PM) are examples of these trading sessions, each of which opens and closes at specific times.
This session indicator also includes a Time Convertor, enabling users to view FOREX market hours based on GMT, UTC, EST, and local time. Another valuable feature of this indicator is the automatic detection of Daylight Saving Time (DST), which automatically applies time changes for the New York, London, and Sydney sessions.
🔵 How to Use
The indicator also displays session times based on the exact opening and closing times for each geographic region. Users can utilize this indicator to view trading hours either locally or in UTC time, and if needed, set their own custom trading times.
Additionally, the session information table includes the start and end times of each session and whether they are open or closed. This functionality helps traders make better trading decisions by using accurate and precise time data.
Key Features of the Session Indicator
The session indicator is a versatile and advanced tool that provides several unique features for traders.
Some of these features are :
• Automatic Daylight Saving Time (DST) Detection : This indicator dynamically detects Daylight Saving Time (DST) changes for various trading sessions, including New York, London, and Sydney, without requiring manual adjustments. This feature allows traders to manage their trades without worrying about time changes.
Below are the start and end dates for DST in the New York, London, and Sydney trading sessions :
1. New York :
Start of DST: Second Sunday of March, at 2:00 AM.
End of DST: First Sunday of November, at 2:00 AM
2. London :
Start of DST: Last Sunday of March, at 1:00 AM.
End of DST: Last Sunday of October, at 2:00 AM.
3. Sydney :
Start of DST: First Sunday of October, at 2:00 AM.
End of DST: First Sunday of April, at 3:00 AM.
• Session Display Based on Different Time Zones : The session indicator allows users to view trading times based on different time zones, such as UTC, the local time of each market, or the user’s local time. This feature is especially useful for traders operating in diverse geographic regions.
• Custom Trading Time Setup : Another notable feature of this indicator is the ability to set custom trading times. Traders can adjust their own trading times according to their personal strategies and benefit from this flexibility.
• Session Information Table : The session indicator provides a complete information table that includes the exact start and end times of each trading session and whether they are open or closed. This table helps users simultaneously and accurately monitor the status of all trading sessions and make better trading decisions.
🟣 Session Trading Hours Based on Market Mode and Time Zones
The session indicator provides precise information on the start and end times of trading sessions.
These times are adjusted based on different market modes (FOREX, stocks, and TFlab suggestions) and time zones (UTC and local time) :
🟣 (FOREX Session Time) Forex Market Mode
• Sessions in UTC (DST inactive) :
Sydney: 22:00 - 06:00
Tokyo: 23:00 - 07:00
Shanghai: 01:00 - 09:00
Asia: 22:00 - 07:00
Europe: 07:00 - 16:00
London: 08:00 - 16:00
New York: 13:00 - 21:00
• Sessions in UTC (DST active) :
Sydney: 21:00 - 05:00
Tokyo: 23:00 - 07:00
Shanghai: 01:00 - 09:00
Asia: 21:00 - 07:00
Europe: 06:00 - 15:00
London: 07:00 - 15:00
New York: 12:00 - 20:00
• Sessions in Local Time :
Sydney: 08:00 - 16:00
Tokyo: 08:00 - 16:00
Shanghai: 09:00 - 17:00
Asia: 22:00 - 07:00
Europe: 07:00 - 16:00
London: 08:00 - 16:00
New York: 08:00 - 16:00
🟣 Stock Market Trading Hours (Stock Market Mode)
• Sessions in UTC (DST inactive) :
Sydney: 00:00 - 06:00
Asia: 00:00 - 06:00
Europe: 07:00 - 16:30
London: 08:00 - 16:30
New York: 14:30 - 21:00
Tokyo: 00:00 - 06:00
Shanghai: 01:30 - 07:00
• Sessions in UTC (DST active) :
Sydney: 23:00 - 05:00
Asia: 23:00 - 06:00
Europe: 06:00 - 15:30
London: 07:00 - 15:30
New York: 13:30 - 20:00
Tokyo: 00:00 - 06:00
Shanghai: 01:30 - 07:00
• Sessions in Local Time:
Sydney: 10:00 - 16:00
Tokyo: 09:00 - 15:00
Shanghai: 09:30 - 15:00
Asia: 00:00 - 06:00
Europe: 07:00 - 16:30
London: 08:00 - 16:30
New York: 09:30 - 16:00
🟣 TFlab Suggestion Mode
• Sessions in UTC (DST inactive) :
Sydney: 23:00 - 05:00
Tokyo: 00:00 - 06:00
Shanghai: 01:00 - 09:00
Asia: 23:00 - 06:00
Europe: 07:00 - 16:00
London: 08:00 - 16:00
New York: 13:00 - 21:00
• Sessions in UTC (DST active) :
Sydney: 22:00 - 04:00
Tokyo: 00:00 - 06:00
Shanghai: 01:00 - 09:00
Asia: 22:00 - 06:00
Europe: 06:00 - 15:00
London: 07:00 - 15:00
New York: 12:00 - 20:00
• Sessions in Local Time :
Sydney: 09:00 - 16:00
Tokyo: 09:00 - 15:00
Shanghai: 09:00 - 17:00
Asia: 23:00 - 06:00
Europe: 07:00 - 16:00
London: 08:00 - 16:00
New York: 08:00 - 16:00
🔵 Setting
Using the session indicator is straightforward and practical. Users can add this indicator to their trading chart and take advantage of its features.
The usage steps are as follows :
Selecting Market Mode : The user can choose one of the three main modes.
Forex Market Mode: Displays the forex market trading hours.
oStock Market Mode: Displays the trading hours of stock exchanges.
Custom Mode: Allows the user to set trading hours based on their needs.
TFlab Suggestion Mode: Displays the higher volume hours of the forex market in Asia.
Setting the Time Zone : The indicator allows displaying sessions based on various time zones. The user can select one of the following options:
UTC (Coordinated Universal Time)
Local Time of the Session
User’s Local Time
Displaying Comprehensive Session Information : The session information table includes the opening and closing times of each session and whether they are open or closed. This table helps users monitor all sessions at a glance and precisely set the best time for entering and exiting trades.
🔵Conclusion
The session indicator is a highly efficient and essential tool for active traders in the FOREX and stock markets. With its unique features, such as automatic DST detection and the ability to display sessions based on different time zones, the session indicator helps traders to precisely and efficiently adjust their trading activities.
This indicator not only shows users the exact opening and closing times of sessions, but by providing a session status table, it helps traders identify the best times to enter and exit trades. Moreover, the ability to set custom trading times allows traders to easily personalize their trading schedules according to their strategies.
In conclusion, using the session indicator ensures that traders are continuously and accurately informed of time changes and the opening and closing hours of markets, eliminating the need for manual updates to align with DST changes. These features enable traders to optimize their trading strategies with greater confidence and up-to-date information, allowing them to capitalize on opportunities in the market.

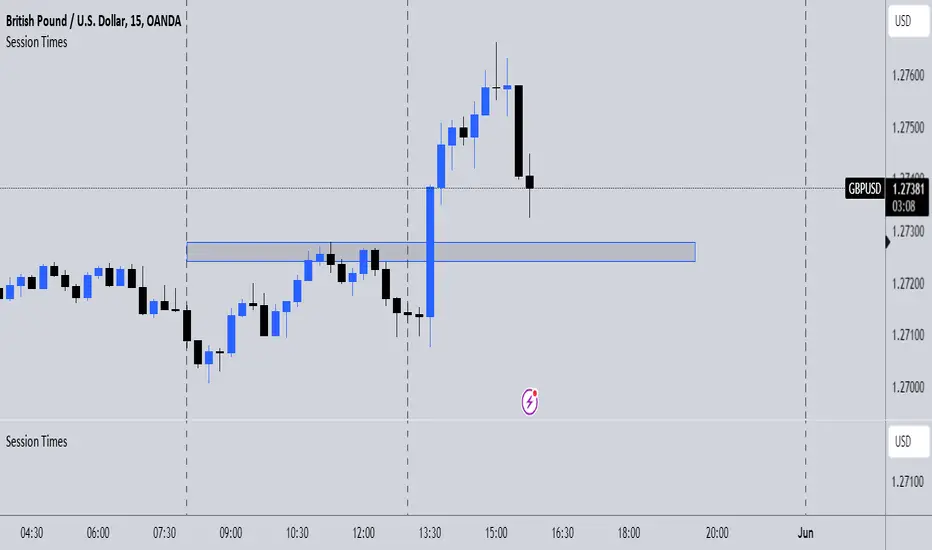
B A N K $ - Advanced Session RangesThis is a simple indicator that has been designed to aid intraday trading and has a few components;
Key Features
Session Ranges + Optimal Exit Time
Asia Pip Range
New York Midnight Open Line
Session Ranges + Optimal Exit Time
Information ℹ️
This is a visual depiction of the 3 main sessions in the markets. Asia, London & New York. The default timings are set to perfectly align with each session however the Start & End times for each session can be changed in the settings. (I've added a website on the tooltip to easily convert timezones)
I have also added a 4th session range called "Optimal Exit Time". This is statistically the most probable time window for the opposite High / Low of Day to form is within this window. It helps the trader understand when they should look to take profit.
How It Works 🔑
The indicator automatically maps on two lines for the High & Low of the range between the selected Start & End time, it also colours the background.
The individual lines & background can be toggled & customised to the traders preference.
Asia Pip Range
Information ℹ️
This displays the Asia Range in pips beneath the Asia Session Low.
How It Works 🔑
This calculates the distance between the Asia High - Asia Low in pips. It will automatically recalibrate to the timings the trader sets in the settings if they change the Start / End.
New York Midnight Open Line
Information ℹ️
This helps look for Buys beneath the line for a Bullish Expansion day 📈 & Sells above the line for a Bearish Expansion day 📉
How It Works 🔑
This adds a horizontal line to the chart that is anchored to New York Midnight Open (00:00) by default. It can be changed in the settings in required. You can also toggle on the time being shown above the line.

Session TimesDescription:
This indicator simply when enabled will draw dashed lines at each of the session openings. This is based on UTC+1 Time. There will be lines at 00:00 & 08:00 (Asian Session), lines at 08:00 & 13:00 (London Session) and finally lines at 13:00 & 00:00 (New York Session).
Potential Use:
There are many ways you could use this indicator to benefit your trading, but the best way I find is that it makes it clear where the previous highs and lows are of a session, which are potential areas you could trade off. Obviously, there are many other ways you can use this to help you.
How The Script Works:
The way the script works isn't too complicated as it is only a short script. Simply it firstly calculates what are the weekdays (Whenever it isn't Saturday or Sunday). Then from there simply finds the times which I mentioned above, and adds a vertical dashed line there.
Future Updates:
In the future I will mainly be looking to make the indicator more customisable. Firstly, I will look to make it so that the user can adjust the times that the lines are drawn at so it still works wherever you are in the world. I would also like to make it so the user can choose the colour of the lines. If you have any other additions you would like added to this, then feel free to message me.
Sessions [TradingFinder] New York, London, Tokyo & Sydney ForexTiming is one of the influential factors in a trader's position. This indicator categorizes transactions into three sessions (Asia, Europe, and America). Five significant trading cities (New York, London, Frankfurt, Tokyo, and Sydney) are selectable.
I recommend using the tool on a 5-minute time frame, but it is usable on all time frames.
Settings:
• Trading sessions: Display or hide each trading session as needed.
• Color: Change the color of each box.
• Session time intervals: The default is based on the main working hours for each time interval and can be adjusted.
• Information table: Delete or display additional information table.
Information Table:
• Trading sessions
• Opening and closing times of each trading session
How to Use:
Initiating trading sessions involves entering with increased liquidity, and the market usually experiences significant movements. Many trading strategies are based on "time" and "session openings." This tool empowers traders to focus intensely on each time interval.
These trading sessions are crucial for all Forex, stock, and index traders:
The total price ceiling and floor in the Asia session (Tokyo and Sydney) are crucial for traders in the European session.
The European session starts with Frankfurt, and an hour later, London begins, collectively forming the European session.
The dashboard provides additional information, displaying hours based on UTC.
Customization options are considered in all sections so that everyone can apply their own settings.
Important: Default times are the most accurate for each region, and in most indicators, this time is not correctly selected. Therefore, the level of influence and time intervals are specified at the beginning of each session. If you are using another indicator, match its default time to the announced time and share the results with me in the comments.

Sessions[Lenny Kiruthu]The script below is designed to show up to 4 different trading sessions i.e. London, New York, Tokyo and Sydney sessions, it also displays the days each session is taking place in as well as two horizontal lines one for the previous days high and the other for the previous days low.
It also displays a table that shows the user the highest and lowest price for 4 different currency pairs the previous day as well as their current prices and below it a confirmation row that shows whether price is currently above, below or within yesterdays range. Note that it only states "High Broken" or "Low Broken" if the current close is above or below the lines.
What you can change
Your time zone for example GMT -4 or GMT +3
The session start and end time
The colors, border type and border width of the session ranges
Displaying the table
Ability to choose the 4 symbols to view on the table

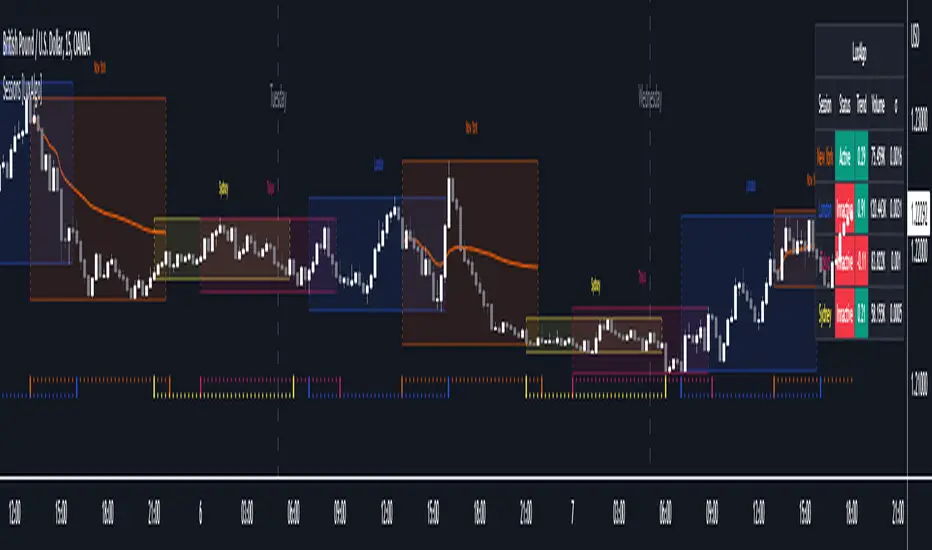
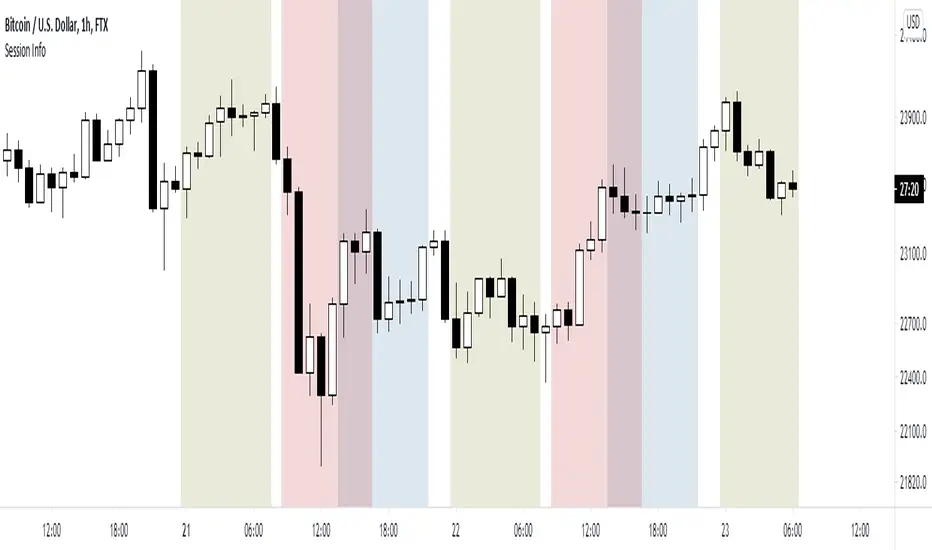
Sessions [LuxAlgo]This indicator shows when user set sessions are active and returns various tools + metrics using the closing price within active sessions as an input. Users have the option to change up to 4 session times.
The indicator will increasingly lack accuracy when the chart timeframe is higher than 1 hour.
Settings
Sessions
Enable Session: Allows to enable or disable all associated elements with a specific user set session.
Session Time: Opening and closing times of the user set session in the hh:mm format.
Range: Highlights the associated session range on the chart.
Trendline: Returns the associated session trendline on the chart.
Mean: Returns the associated session mean average on the chart.
VWAP: Returns the associated session volume weighted average price on the chart.
Ranges Settings
Range Area Transparency: Transparency of the area highlighting sessions ranges.
Range Outline: Highlights the borders of the session range area.
Range Label: Shows the session label at the mid-point of the session interval.
Dashboard
Show Dashboard: Enables sessions dashboard on the chart.
Advanced Dashboard: Returns more information regarding user set sessions on the dashboard.
Dividers
Show Session Divider: Highlights active sessions using intervals on the bottom of the chart (this can lead to less responsive charts)
Show Daily Divider: Highlights days on the chart.
Usage
This tool is versatile and allows the user to perform a wide variety of tasks all focusing on highlighting and analyzing price movements within a specific user set session in a periodic fashion.
Significant forex trading sessions are used by default, but the users are free to choose the opening and closing time of their choices.
Using ranges can indicate which sessions returned the most volatile price movements.
Trendlines can be useful to estimate the underlying trend of a specific session, but they can also offer a quick way to see which session started a trend reversal.
The session Mean highlights the equilibrium level within a session, extrapolating these levels can provide potential support and resistances levels of interest.
Finally, users can use the sessions VWAP's for real time applications, using them as trailing supports and resistances.
Using The Advanced Dashboard
The advanced dashboard returns useful information regarding the user set sessions. Each dashboard elements are described below:
Status: Highlights whether the user set session is active (open) of inactive (closed).
Trend: Shows correlation coefficient between the session prices and a linear sequence of values. Values above 0 indicates an up-trending session, while values under 0 indicates a down-trending session. Values closer to (1, -1) indicates a more trending session.
Volume: Shows accumulated volume within the session
σ (Standard Deviation): Shows standard deviation of the session, while this value is not bounded it can be useful to compare it with the other ones to see which session was the most volatile.
Note that when a session becomes inactive the value on the dashboard will hold until the specific session becomes active again.
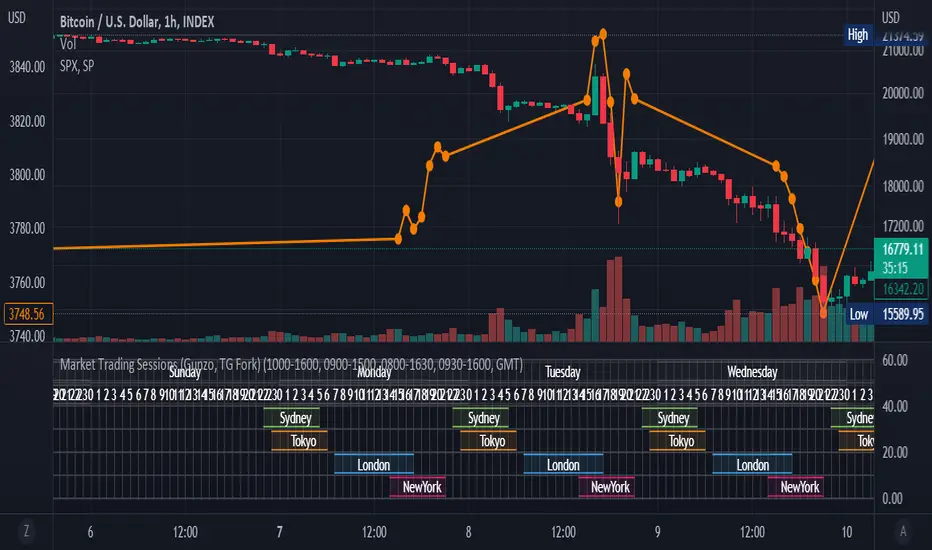
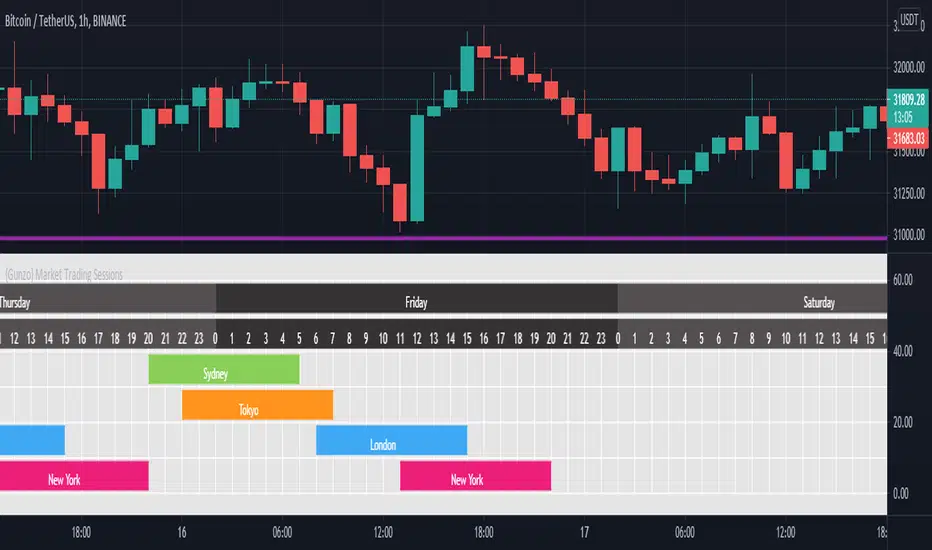
Market Trading Sessions (TG Fork)Visualize trading sessions opening hours of several international exchanges on a grid. Contrary to other indicators, this one automatically aligns the session with the current chart's timezone.
This is helpful for bar replay or manual backtesting, to spot patterns of correlations (this can also be used in conjunction with correlation indicators, see my other indicators).
Original indicator by Gunzo, if you like this indicator, please show the original author some love:
This indicator is also inspired by the following indicators:
ZenAndTheArtOfTrading with
UnknownUnicorn468659 with
This fork implements the following features:
Converted to PineScript v5.
Adapted default color palette to dark mode, as is the default in TradingView now.
Fix drawing issues, now the design shows as it was originally meant to be.
Fixed mistiming issue that made some sessions display with a delay compared to the real session, especially the first session was bar at the start of the session was not displayed.
Inputted the accurate timings for each session, instead of the default 0800-1600 in the original indicator.
Essentially, you can just add this indicator and it should work out of the box. If not, please let me know, and I'll try to fix it!
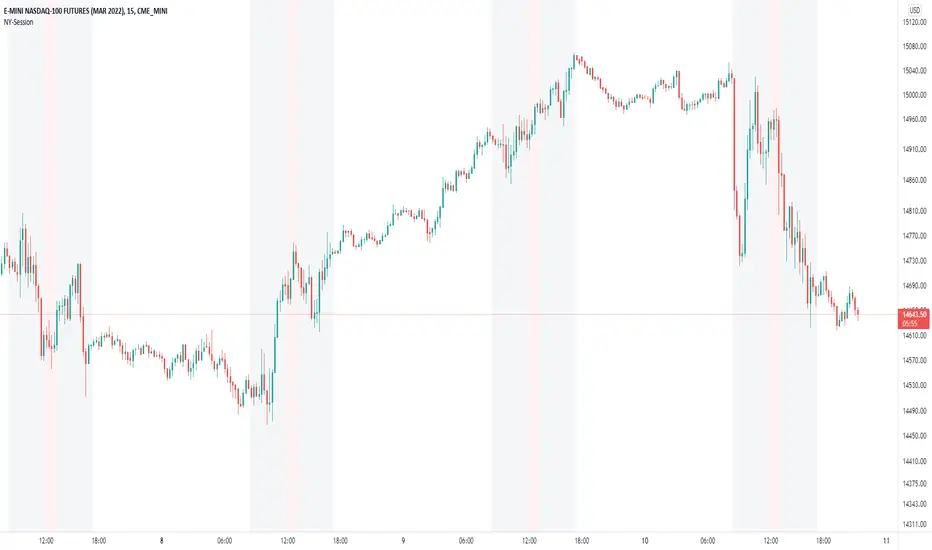
Forex bot full strategy with risk managementThis is a full strategy designed for forex major pairs, specially EUR/USD using 1h time frame chart.
Its components are
200 EMA
MACD
OBV
PSAR
RIsk management with tp and sl movements
Rules for entry
For long = Previous histogram from MACD was below 0 and current one is above 0. CLose of a candle is above EMA 200 , OBV oscillator is negative and we have an uptrend from PSAR
For short = Previous histogram from MACD was above 0 and current one is below 0. CLose of a candle is below EMA 200 , OBV oscillator is positive and we have an downtrend from PSAR
Rules for exit
For tp and sl values we calculate the distance from the close of candle until the psar values.
If you have any questions, let me know !

{Gunzo} Market Trading Sessions (Tokyo, London, New York)Market Trading Sessions is a tool designed to help traders to find the best times of the day for price action trading. It displays non-overlapping visuals for the major trading sessions : Oceania, Asia, Europe, and USA.
OVERVIEW :
This tool has been designed to match all the following requirements that I needed for optimal usage :
Display opening and closing of main markets
See clearly market sessions (non-overlapping colors)
Display Sydney session if wanted
Display GMT hours and days
Visually pleasing design and colors
Highly configurable
As I had trouble finding a script matching all these criteria, I created this tool and I'm sharing it with the TradingView community, hoping you will find it useful too.
SETTINGS :
Display market sessions on weekends : Display theoretical market sessions times on the weekend which can be useful for non forex markets.
Display session for Oceania\Sydney : Display "Oceania\Sydney" trading session
Display session for Asia\Tokyo : Display "Asia\Tokyo" trading session
Display session for Europe\London : Display "Europe\London" trading session
Display session for USA\New York : Display "USA\New York" trading session
Display session names : Display names of the session on the visual
Oceania color : Configurable color for the "Oceania\Sydney" sessions
Asia color : Configurable color for the "Asia\Tokyo" sessions
Europe color : Configurable color for the "Europe\London" sessions
USA color : Configurable color for the "USA\New York" sessions
Background color : Configurable color for the table background
Border color : Configurable color for the table borders
Text color : Configurable color for the table text
Header color : Configurable color for the table header (even days)
Header color (alternate) : Configurable color for the table header (odd days)
London Breakout/Session GBP/USD Forex DaytradeThis is a forex strategy suited for day traders, specialized in the london breakout session
The key elements for this strategy are the specific london time session, together with an exit time(before asian trade/at the end of new york session).
At the same time, as logic elements we only use price action inside like :
For long we have 3 ascending candles, and for short we have 3 descending candles.
For exit we have both TP/SL based on price percentage movement, or we exit if we reach the end of the day.
If you have any questions message me in private !

World market Session Information for bitcoinIt marks out different world markets active timings on the bitcoin charts.
You can also modify the script to a strategy and test out different strategies.
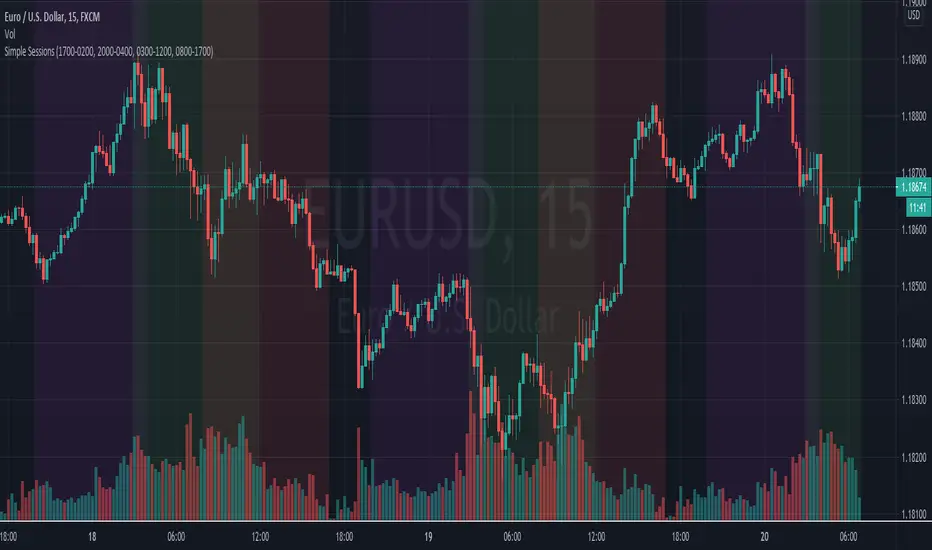
Simple Sessions## Background ##
Simple Sessions is based on the very awesome "Sessions on Chart" by Aurocks_AIF.
I really liked how the background colours worked but wanted to simplify it by removing some parts that I didn't use. I then simplified much of the code, put it into my standard template format and re-published. Hopefully the code is a bit cleaner and easier to read now.
## Usage ##
The default indicator shows the following sessions:
* Sydney in Navy
* Tokyo in Purple
* London in Green
* New York in Red
The good news is that using Green and Red for London and New York, gives a nice distinct yellow for the overlapping sessions. Sydney and Tokyo are by in similar colors by design.
By default, only London and New York show, but you may turn on Sydney and Tokyo in the settings.
## Use, Share, Like, etc #
Have fun!
-- chilts
Amazing scalper for majors with risk managementHello,
Today I am glad to bring you an amazing simple and efficient scalper strategy.
Best suited for 1M time frame and majors currency pairs.
Its made of :
Ema (exponential moving average) , long period 25
Ema(exponential moving average) Predictive, long period 50,
Ema(exponential moving average) Predictive, long period 100
Risk management , risking % of equity per trade using stop loss and take profits levels.
Long Entry:
When the Ema 25 cross up through the 50 Ema and 100 EMA. and we are in london or new york session( very important the session, imagine if we have only american or european currencies, its best to test it)
Short Entry:
When the Ema 25 cross down through the 50 Ema and 100 EMA, and we are in london or new york session( very important the session, imagine if we have only american or european currencies, its best to test it)
Exit:
TargetPrice: 5-10 pips
Stop loss: 9-12 pips
Hope you enjoy it :)

Wavetrend strategy with trading session for any time chartHello there
Today I am glad to provide you a strategy based on the wave trend oscillator. If you want to use it as an indicator, just disable long and short to not make any shops.
It works on all time frames.
The way it works its like an RSI .
We have overbought and oversold levels, and together with a channel and length we calculate the wave trend.
And then like in RSI, when we cross those lines we buy or sell depending on which lines we cross.
For risk management, so far its not implemented, but it can be done in many ways.
The only thing I applied is to always close a trade at the end of friday day. At the same time it can be applied the rule to sell when % of equity is lost, or at the end of a trading session like london,neywork and so on.
For any questions or doubts, let me know.
Hope you enjoy it :)

Simple and efficient 1h strategyThis strategy is made from a crossover of 2 ema : 4 and 8 in this case, together with a RSI of lenght 10 applied to hl2
The strategy is simple : we enter when we have a cross between the 2 ma's and rsi at the same time is in ascending or descending position crossing the middle line of 50.
For exit we have : at the end of a session( we trade only between london and newyork in this case, so we exit newyork), or through a tp/sl pip point system.
Hope you enjoy it.

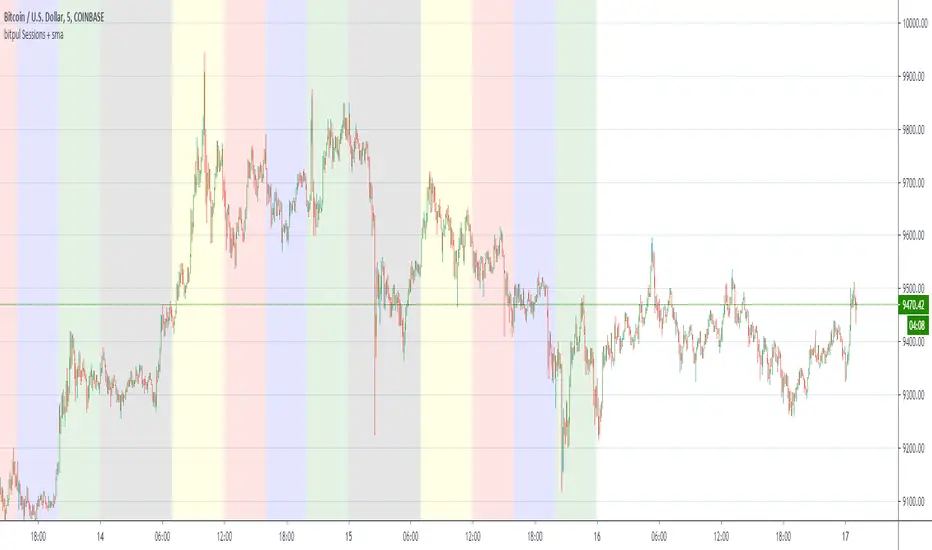
bitpul Sessions + sma [MHMK]Background colors that show open-close of the major market sessions ( Tokyo, London, joint time, New York, free time).
I added two sma to get more confirmation for the reversal - You can hide smas
London_NYThis is a session indicator that is one color from beginning of London Session to end of New York Session.
