Candle FMTFMultitimeframe candlesticks with shadows. Script draws each next candle gradually. Sorry for bad english. Good Luck in tradework!
Multi

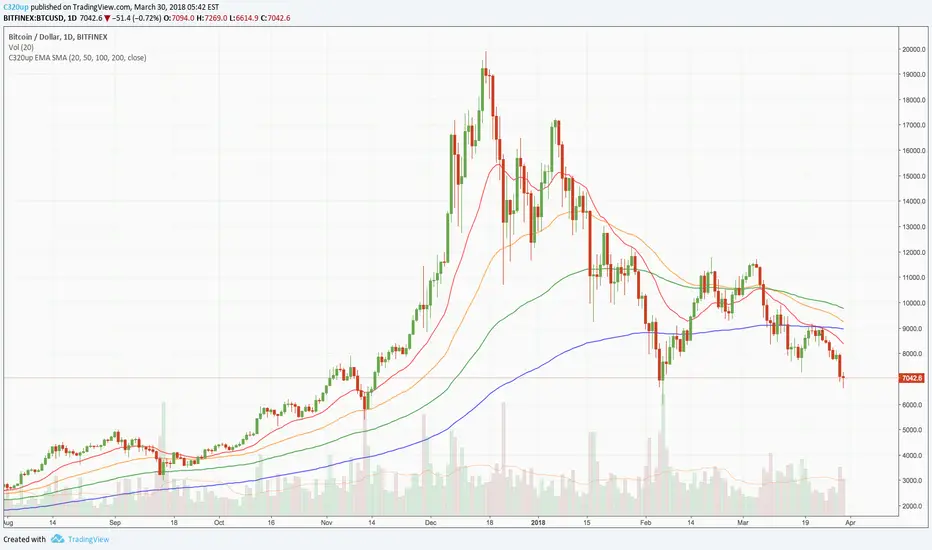
C320up Moving Average Exponential or Simple with 4 LinesC320up EMA SMA
Eight indicators in one.
You can set four of your favourite EMA’s or SMA’s or both on the screen at once, or set just one.
Easily switch between EMA or SMA and display as many or little as you want.
Default settings are 20, 50, 100, and 200 EMA’s.
You can switch them on or off individually and change the colours to suit your preferences.
BTC World Volume (Multi-Exchange)Release: 2018-03-29
__________________________
WHAT IT DOES
Bitcoin is listed on multiple exchanges. Many people have called for a single global index that would quote BTC volume across all exchanges: this script is such a virtual volume aggregate of the 17 largest fiat exchanges on TradingView (listed in the script comments, and in Format > Inputs for you to select). It includes USD, EUR, JPY, KRW and USDT sources.
It will, independently for each tick, quote the volume from all selected exchanges and display a stacked representation, freely inspired from CoinMarketCap charts; also a Moving Average. Each fiat/continent has its own general color, to be able to quickly glance at where volume is coming from, e.g. BitMEX or Asia. (colors are based on Google's Material Design).
By default:
Grey: BitMEX
Green: USD
Yellow: Tether (USDT)
Red: Asia (JPY, KRW)
Blue: Europe (EUR)
No more "on Coinbase this" or "on Bitstamp that", you've now got a global overview! It becomes easy to debunk a few common myths.
See CoinMarketCap for reference.
Note: Bitmex is not taken into account in CoinMarketCap (afaik) since it's trading a derivative asset (XBTUSD contracts), but it usually amounts to ~50% of the overall BTC volume in USD value. The 16 other exchanges quote their volume in BTC, and they represent 30~40% of the overall BTC volume. I believe the whole is good enough to smooth out exchanges variations, and get a fair representation of real-time activity.
__________________________
HOW TO USE IT
Just add it to your chart, it will appear as a separate indicator. By default, it appears as stacked colored "areas". There is also a total volume Histogram, which is transparent by default: you can tweak that in Format > Style.
The darker and lighter backgrounds are respectively indicative of a downward price candle (open > close), or an upward price candle (close > open). They are unrelated to volume and simply help interpreting the indicator.
You can check/uncheck exchanges in the Format > Inputs tab to remove/add some of them from computation. All are enabled by default.
You can check/uncheck exchanges in the Format > Style tab to hide them (usually you would hide all or none).
You can edit colors and transpareny as well for each exchange.
You can edit "Volume histogram" transparency to have it show (it's a simpler representation than areas).
Moving Average: You can select the type (SMA, EMA, DEMA or TEMA) and length.
__________________________
Please leave feedback below or pm me directly for bugs and suggestions.

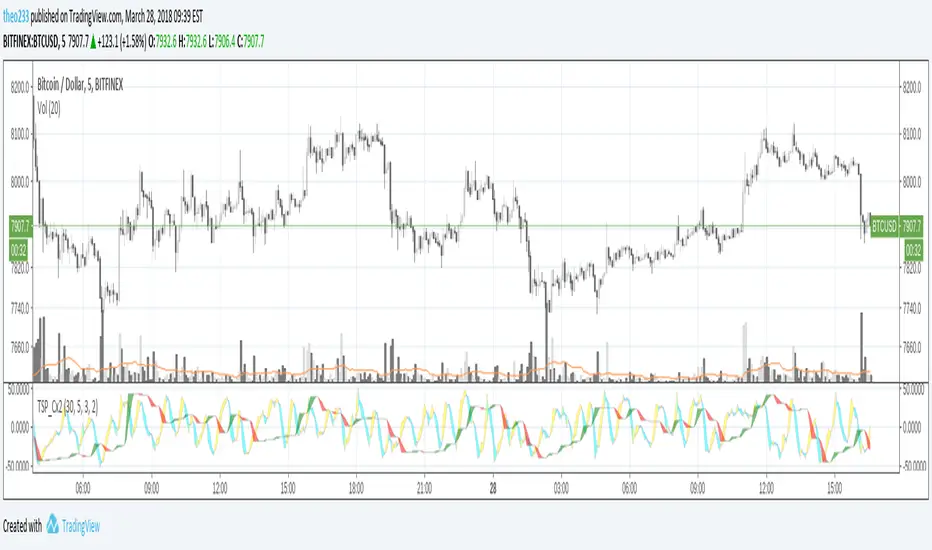
TSP Cycles DoubleDouble Cycles
You can setup higher timeframe cycle period's as argument, default is M30
BTC World Price: Multi-Exchange VWAPBTC World Price: Multi-Exchange VWAP
__________________________
WHAT IT DOES
What you see above are not Bitmex candles, but this indicator's.
Bitcoin is listed on multiple exchanges. Many people have called for a single global index that would quote BTC price and volume across all exchanges: this script is such a virtual aggregate (formerly: Multi-Listed , Volume-Weighted Average Price ).
It will, independently for each tick, for any time-frame:
- Quote the price (O, H, L, C) and volume from Bitfinex (USD), Binance (USDT), bitFlyer (Yen), Bithumb (S. Korean Won), Coinbase (USD), Kraken (EUR) and even Bitmex (USD Contracts).
- Weight each price with the corresponding volume of the exchange.
- Quote the FOREX conversion rate in USD for each currency (USDJPY etc.)
- Finally return global average price (candles) in USD.
- Additionally provide (H+L)/2 etc. values.
No more "on Coinbase this" or "on Bitstamp that", you've now got a global overview!
See CoinMarketCap: Markets for reference. I've included alternative exchanges in the comments at the top of the script.
__________________________
HOW TO USE IT
Basically just add it to your chart and use the indicator's candles instead of the chart's main ticker.
By default, BTC World Price will display candles only, but you can also display OHLC & averages (in whichever style you want).
You may indeed want to hide the main symbol (top-left corner, click the 'eye' button next to its name), or switch it to something else than candles/bars (e.g. line).
Make sure "Scale Price Chart Only" is disabled if you want to use the auto-zoom feature. (if other indicators are messing your zoom, you can try to select "Line with Breaks" or "Area with Breaks" to allow these to overflow from the main window)
By clicking the triangle next to the indicator's name, you can select "Visual Order" (e.g "Bring to Front").
You can select regular Candles or Heikin-Ashi in Options.
In the Format > Inputs tab, you can select which exchanges to quote. By default, all of them are enabled.
The script also exposes the following typical values to the backend, which you can use as Price Source for other indicators: (e.g. MA, RSI, in their "Format > Input" tab)
Open Price (grey)
High Price (green)
Low Price (red)
Close Price (white)
(H + L)/2 (light blue)
(H + L + C)/3 (blue)
(O + H + L + C)/4 (purple)
They are all hidden by default (by means of maximum transparency).
In the Format > Style tab, you can change their color, transparency and style (line, area, etc), as well as uncheck Candles and Wicks to hide these.
If you are using "Indicator Last Value" and want to clear the clutter from all these values, simply uncheck them in Style. They will still be available as Price Source for other indicators.
You can also choose to scale it to the left, right (default) or "screen" (no scaling).
Once you're satisfied with your Style, you may click "Default"> "Save as default" in the botton-left. Everytime you load the indicator, it will look the same. ("Reset Settings" will reset to the script's defaults)
__________________________
Please leave feedback below in comments or pm me directly for bugs and suggestions.

Correlate 3 - Correlation IndicatorThe code in contains a simple correlation indicator that can be used as an alternative to Tradingview’s built-in “Correlation Coefficient” indicator. The indicator allows users to correlate up to 3 separate instruments on the same subplot. This allows you, for example, to easily see the correlation of your instrument with stocks, bonds and FX. Alternatively, a user can also see the correlation with sector, industry peers or any other data available in Tradingview.
Features
Level Guides to easily see the key correlation coefficient levels
Multi-instrument:

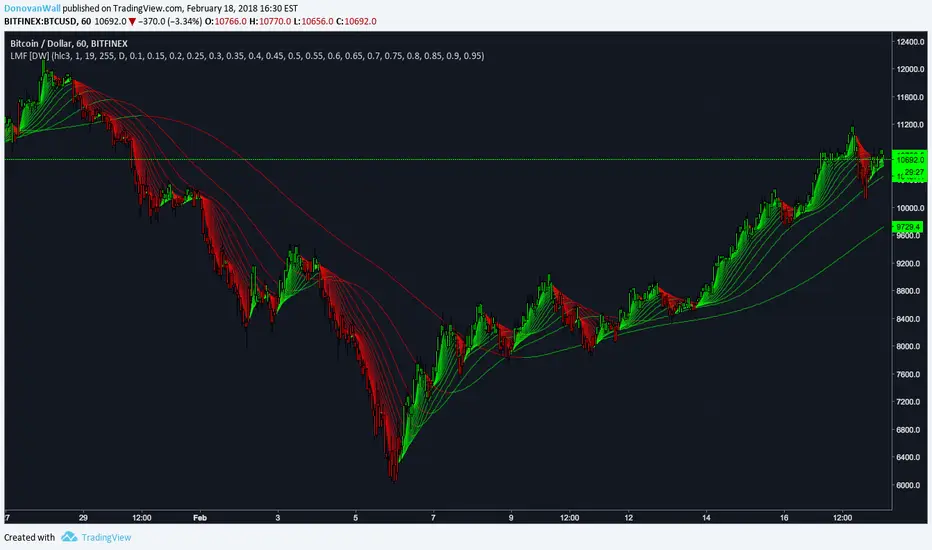
Volume Weighted Average Range Bands [DW]This is an experimental study designed to identify the underlying trend bias and volatility of an instrument over any custom interval TradingView supports.
First, reset points are established at points where the opening price of the interval changes.
Next, Volume Weighted Average Price (VWAP) is calculated. It is the cumulative sum of typical price times volume divided by the cumulative volume. The cumulation starts over upon each reset point.
After that, Volume Weighted Average Range (VWAR) is calculated. The formula structure is the same as VWAP, except using range rather than typical price.
Lastly, the bands are calculated by multiplying the VWAR by the specified multiplier (approximate Golden Ratio by default) and by 1 through 5, then adding to and subtracting from the VWAP.
Custom Bar Colors are included.

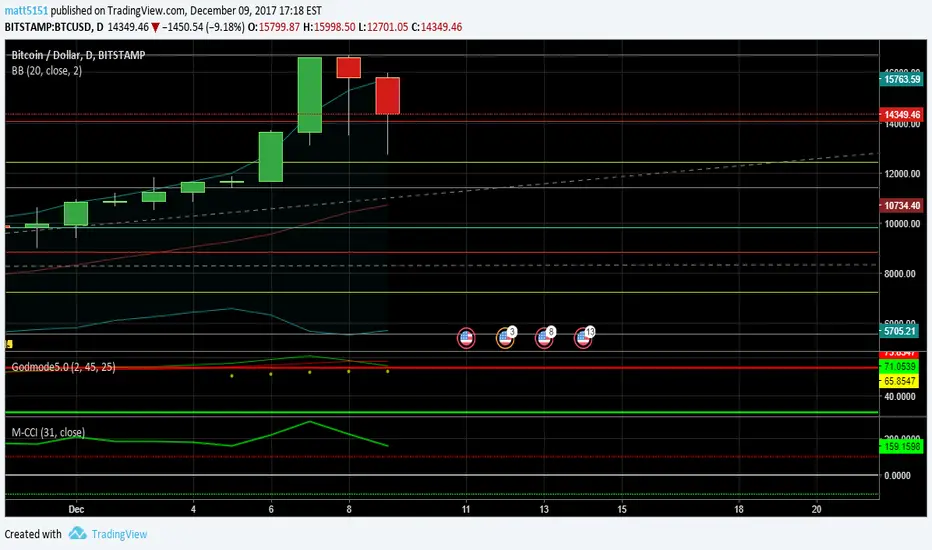
Multi-Bollinger [DW]This is an experimental study designed to visualize trend activity and volatility using a set of two Bollinger Bands calculated with a basis moving average type of your choice.
The available moving averages in this script are:
-Exponential Moving Average
-Simple Moving Average
-Weighted Moving Average
-Volume Weighted Moving Average
-Hull Moving Average
-Least Squares Moving Average
-Arnaud Legoux Moving Average
-Coefficient of Variation Weighted Moving Average
-Fractal Adaptive Moving Average
-Kaufman's Adaptive Moving Average
In addition, a middle filter is calculated by taking the median of the two basis lines.
Multi-Timeframe functionality is included. You can choose any timeframe that Tradingview supports as the basis resolution for the bands.
Custom bar color scheme is included with four options to choose from.

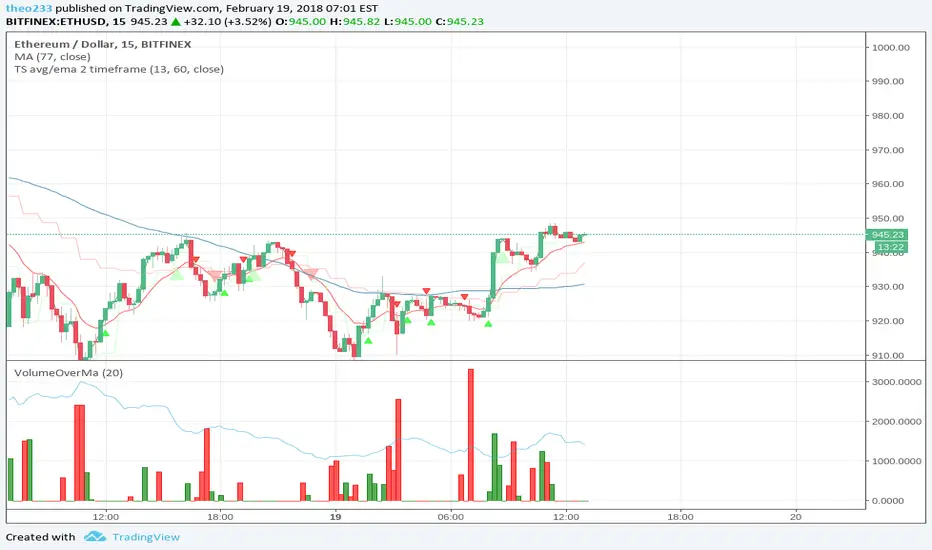
TS avg/ema 2 timeframeChart alerts of Cross between Average price and EMA on 2 timeframe
First timeframe comes from period
Second timeframe comes from input (default 1hour)
Laguerre Multi-Filter [DW]This is an experimental study designed to identify underlying price activity using a series of Laguerre Filters.
Two different modes are included within this script:
-Ribbon Mode - A ribbon of 18 Laguerre Filters with separate Gamma values is calculated.
-Band Mode - An average of the 18 filters generates the basis line. Then, Golden Mean ATR over the specified sampling period multiplied by 1 and 2 are added and subtracted to the basis line to generate the bands.
Multi-Timeframe functionality is included. You can choose any timeframe that TradingView supports as the basis resolution for the script.
Custom bar colors are included. Bar colors are based on the direction of any of the 18 filters, or the average filter's direction in Ribbon Mode. In Band Mode, the colors are based solely on the average filter's direction.
SuperTrend MultiTimeFrame with Alerts V.1SuperTrend Multi Time Frame with Multi Alerts ... you can insert alerts for all supertrend viewed on graph.
Different alerts for long and short.
This script plot 5min, 1H and 1D!
Enjoy!

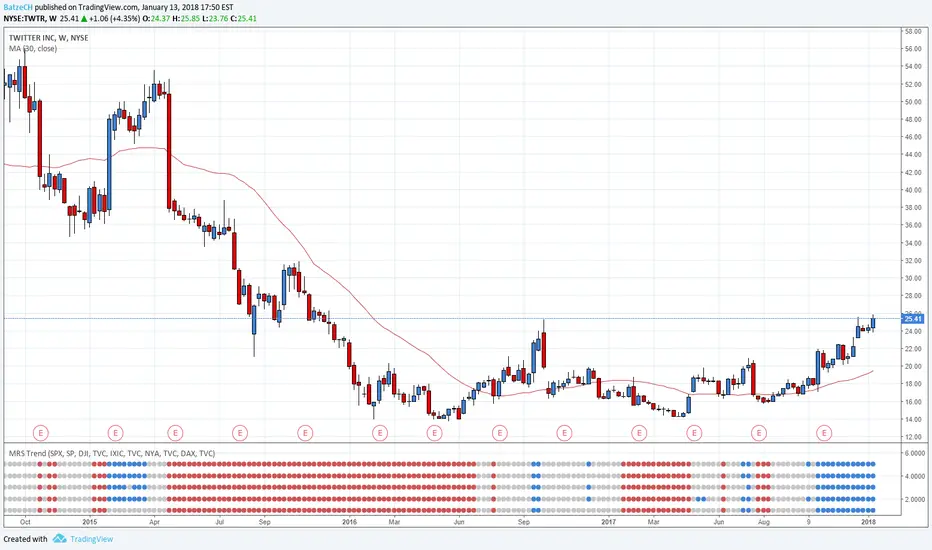
Mansfield Relative Strength Multi TrendThis indicator is an advanced studie of 'Mansfield Relative Strength Trend' indicator
Since it is too time consuming to constantly change the index, I have developed a multi-index indicator.
The default order of the indexes is:
1. S&P 500
2. Dow Jones Industrial Average
3. Nasdaq Composite
4. NYSE Composite
5. DAX
You can change all indexes in the settings if you want.
*********************************
'Stan Weinstein' developed an indicator called Relative Strength which compares the relative strength of a stock with the associated index.
This indicator combines the relative strength with Weinstein's stage analysis.
The indiacator was made for weekly stock charts only!
BUY & HOLD Conditions (green):
1. Mansfield Relative Strength is above the zero line
2. Price is above the Simple Moving Average (30)
3. Simple Moving Average (30) is rising
SELL & HOLD Conditions (red):
1. Mansfield Relative Strength is below the zero line
2. Price is below the Simple Moving Average (30)
3. Simple Moving Average (30) is falling
It is recommended to end the trade when the trend changes.
*********************************
Please always remember, there is no holy grail indicator!
MTF Polarity Grid [DW]This is an experimental study designed to track directional polarities across multiple timeframes and express them as a simple two color grid.
The polarity in this calculation is determined by divergence between a fast and slow McGinley Dynamic.
Your current resolution's polarity is the top row, the rows below are are for higher timeframes of your choice.

MTF Donchian Quadrants [DW]This is a simple Donchian Channel variation that separates the the channels into quadrants, and enables MTF calculation.
Average open and close plots are included for additional confirmation of a trend.

Multi. Exchange CCIBasic CCI script that takes the average close price data across popular crypto exchanges.
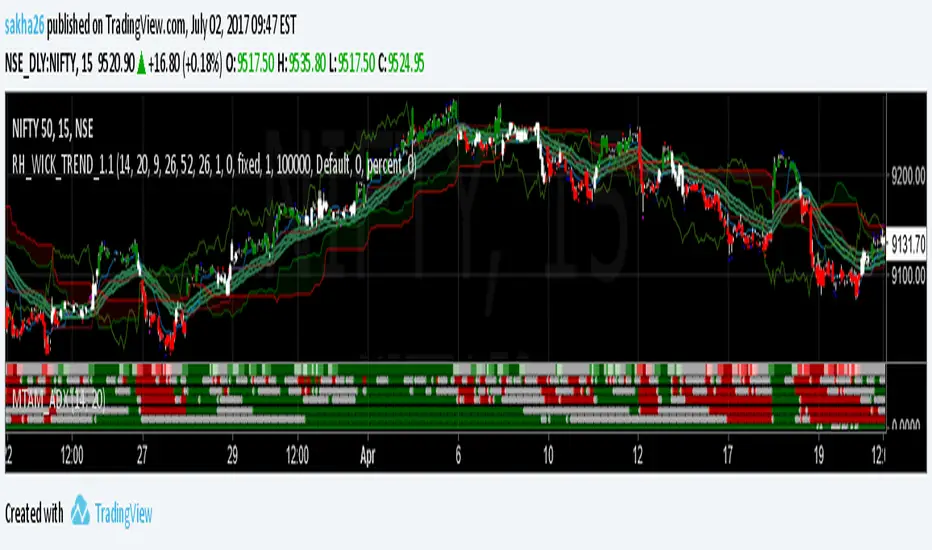
Hawkeye RoadkillWait for the Roadkill signal – then dive for the perfect kill!
Hawkeye Roadkill looks at multiple timeframes simultaneously, and then provides two entry signals, one based on the trend and the other on volume.
One of the biggest problems traders face is that whenever they see a signal or set up in one timeframe, they immediately look at a lower or higher timeframe chart to validate the signal for the confidence to enter the trade. This is a classic problem, and one that can be seen on virtually every trader’s screen, which can be cluttered with several charts, all with different timeframes and all giving different signals to the confused trader. Ultimately, the trader loses both money and confidence, and is no longer able to trade.
For example, if you are looking at a daily chart, does the weekly chart also suggest that your trade is valid? Or, if you are looking at a 15 minute timeframe, does the one-hour chart confirm your analysis? Often the two charts will differ in their signals, since a trend that has begun in one timeframe, may already be ending in another.
So you have two clear signals to get you into the market in your preferred timeframe.

Multi SMA'sRepublished: The original script violated house rules by including an external link to Backtest Rookies.
Background
This is a simple “multi” SMA indicator so that multiple SMA’s can be monitored whilst only using a single indicator slot. It also has a couple of features that let you mix time frames and de-clutter the chart.
The code is open for anyone to modify and a copy
About the Indicator
Although the indicator does nothing more than it says on the tin, There are a couple of points worth mentioning:
The indicator will let you view up to 4 SMA’s
You can set the period for each SMA independently
You can set the resolution for each SMA independently (So you can see the see the daily SMA level when on the 15-minute chart for example)
Each SMA can be turned on/off independently to avoid clutter.
Screenshot - Default Settings


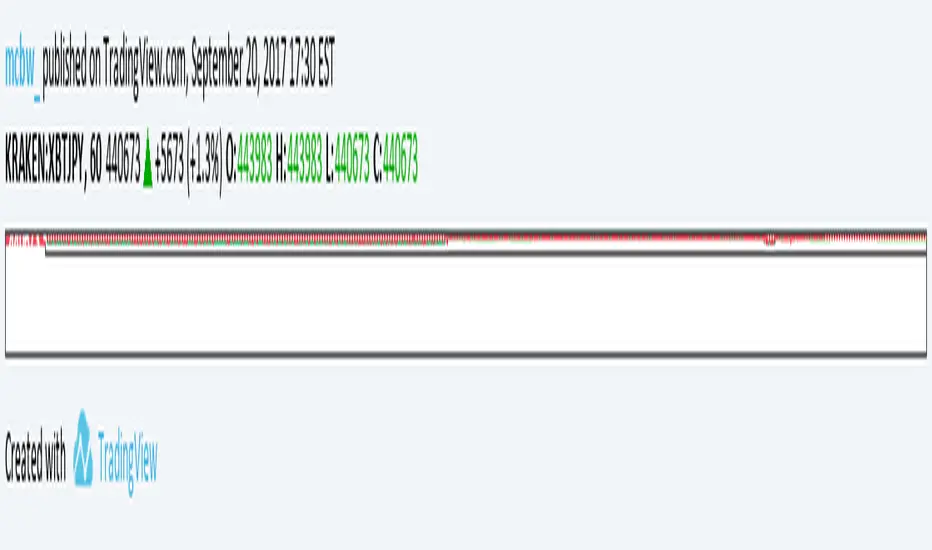
Multiple Ichimoku CloudsFor anyone that uses the Ichimoku Cloud there is a consistent need to flip between timeframes to get information about this at all levels. However, that trouble is now over. In this script there are 4 Ichimoku Clouds that operate in 4 different time frames. To change the timeframe simply change the multiplication factor to the desired levels. How this script works is that it takes your current timeframe as an input then it applies multiplication factors to it to achieve larger timescales. In the example here we are looking at the XBTJPY pair on the 1 hour. Our first cloud is 1x scaling, meaning that it is the 1 hour cloud. The second and third are 2x and 4x respectively meaning that we are looking at the 2 hour cloud and the 4 hour cloud. Lastly the largest cloud is the 24x cloud, aka the daily cloud. Now you only really need one look at the clouds for all the essential information.
As always feel free to message me about anything regarding this script.
Be happy :)
MTF Previous Open/Close/RangeThis indicator will simply plot on your chart the Daily/Weekly/Monthly previous candle levels.
The "Auto" mode will allow automatic adjustment of timeframe displayed according to your chart.
Otherwise you can select manually.
Indicator plots the open/close and colors the high-low range area in the background.
Hope this simple indicator will help you !
You can check my indicators via my TradingView's Profile : @PRO_Indicators

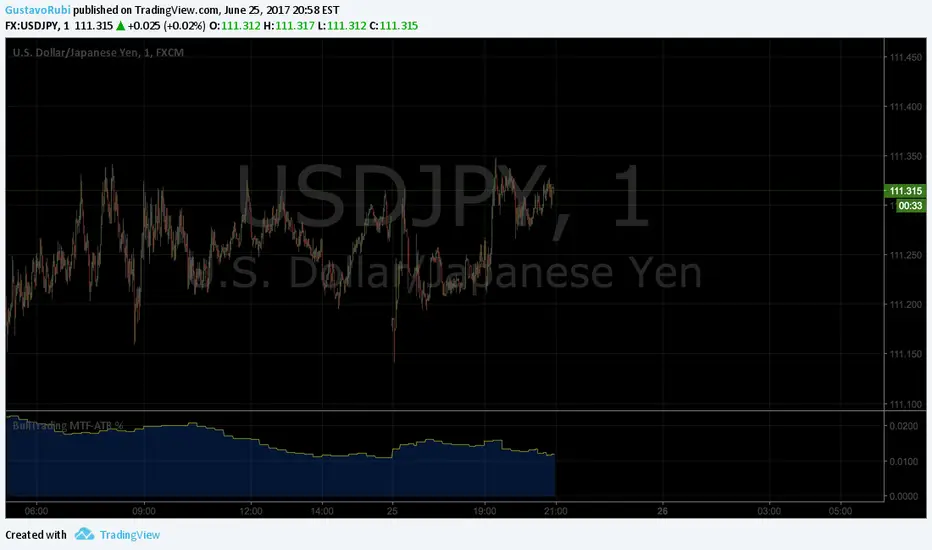
BullTrading MultiTimeFrame ATR %Good afternoon traders.
Have you ever got trapped on the middle of a consolidation? Well, it just happened to me trading the 1 minute chart last friday!
So, I coded this script to display a percentage of ATR for a given resolution.
Now, how can you benefit using this information?
For example:
Using the standard settings (resolution is calibrated 15 minutes in order to trade 1minute charts), just draw your prefered support and resistance. Then measure the number of pips between support and resistance. This number should be approximately the same the indicator is displaying. If the indicator is displaying a lower value, maybe it will be a good idea to tighten your support/resistance levels (if the price goes against you, you will have confidence and probability on your side to open an opposite position and reach your Take profit before a new reversal take place.
Change colors and resolution for your desired timeframe until you find your particular "sweet spot"
Have a nice trading week.