1H/3m Concept [RunRox]🕘 1H/3m Concept is a versatile trading methodology based on liquidity sweeps from fractal points identified on higher timeframes, followed by price reversals at these key moments.
Below, I will explain this concept in detail and provide clear examples demonstrating its practical application.
⁉️ WHAT IS A FRACTALS?
In trading, a fractal is a technical analysis pattern composed of five consecutive candles, typically highlighting local market turning points. Specifically, a fractal high is formed when a candle’s high is higher than the highs of the two candles on either side, whereas a fractal low occurs when a candle’s low is lower than the lows of the two adjacent candles on both sides.
Traders use fractals as reference points for identifying significant support and resistance levels, potential reversal areas, and liquidity zones within price action analysis. Below is a screenshot illustrating clearly formed fractals on the chart.
📌 ABOUT THE CONCEPT
The 1H/3m Concept involves marking Higher Timeframe (HTF) fractals directly onto a Lower Timeframe (LTF) chart. When a liquidity sweep occurs at an HTF fractal level, we remain on the same LTF chart (since all HTF fractals are already plotted on this lower timeframe) and wait for a clear Market Structure Shift (MSS) to identify our potential entry point.
Below is a schematic illustration clearly demonstrating how this concept works in practice.
Below is another 💡 real-chart example , showing liquidity in the form of a 1H fractal, swept by a rapid impulse move. Immediately afterward, a clear Market Structure Shift (MSS) occurs, signaling a potential entry point into the trade.
Another example is shown below, where we see our hourly fractal, from which price clearly reacts, providing an opportunity to search for an entry point.
As illustrated on the chart, the fractal levels from the higher timeframe are clearly displayed, but we’re working directly on the 5-minute chart. This allows us to remain on one timeframe without needing to switch back and forth between charts to spot such trading setups.
🔍 MTF FRACTALS
This concept can be applied across various HTF-LTF timeframe combinations. Although our examples illustrate 1H fractals used on a 5-minute chart, you can effectively utilize many other timeframe combinations, such as:
30m HTF fractals on 1m chart
1H HTF fractals on 3m chart
4H HTF fractals on 15m chart
1D HTF fractals on 1H chart
The key idea behind this concept is always the same: identify liquidity at fractal levels on the higher timeframe (HTF), then wait for a clear Market Structure Shift (MSS) on the lower timeframe (LTF) to enter trades.
⚙️ SETTINGS
🔷 Trade Direction – Select the preferred trading direction (Long, Short, or Both).
🔷 HTF – Choose the higher timeframe from which fractals will be displayed on the current chart.
🔷 HTF Period – Number of candles required on both sides of a fractal candle (before and after) to confirm fractal formation on the HTF.
🔷 Current TF Period – Sensitivity to the impulse that sweeps liquidity, used for identifying and forming the MSS line.
🔷 Show HTF – Enable or disable displaying HTF fractal lines on your chart. You can also customize line style and color.
🔷 Max Age (Bars) – Number of recent bars within which fractals from the selected HTF will be displayed.
🔷 Show Entry – Enable or disable displaying the MSS line on the chart.
🔷 Enable Alert – Activates TradingView alerts whenever the MSS line is crossed.
You can also enable 🔔 alerts, which notify you whenever price crosses the MSS line. This significantly simplifies the process of identifying these setups on your charts. Simply configure your preferred timeframes and wait for notifications when the MSS line is crossed.
🔶 We greatly appreciate your feedback and suggestions for improving the indicator!
Mtfanalysis

MTF Moving Averages (only EMA)MTF Moving Averages (only EMA)
This script provides a Multi-Timeframe (MTF) Exponential Moving Average (EMA) indicator for traders to visualize multiple EMAs across different timeframes directly on a single chart.
The indicator dynamically calculates and plots up to four EMAs per timeframe (15-minute, 30-minute, 1-hour, and Daily) with user-defined lengths, offering valuable insight into price trends and potential entry or exit points.
Key Features:
Multiple Timeframe Support: The script allows you to view EMAs from different timeframes simultaneously. This is especially useful for traders who follow trends across different timeframes to make more informed decisions.
Customizable Lengths: For each timeframe, the lengths of the EMAs are fully customizable. You can adjust the length of up to four EMAs per timeframe to suit your strategy.
EMA Calculation: The Exponential Moving Average (EMA) is used, which gives more weight to recent prices and reacts faster to price changes compared to the simple moving average (SMA).
Timeframe Flexibility: The indicator supports the following timeframes:
15-minute: Ideal for short-term traders and scalpers.
30-minute: For intraday trading with a slightly longer perspective.
1-hour: Suitable for swing traders and those who prefer a more medium-term view.
Daily: Great for longer-term trend-following strategies.
Interactive and User-Friendly: You can toggle the visibility of each EMA on each timeframe, allowing you to choose exactly which EMAs you wish to display, depending on your trading strategy.
Color-Coded for Clarity: The script uses distinct colors for each EMA on the chart:
Blue: EMA1
Green: EMA2
Red: EMA3
Purple: EMA4
Line Width Customization: Each plotted EMA line has a customizable width for better visual clarity.
Use Case:
Traders who use multiple timeframes for analysis (e.g., those using the "multi-timeframe analysis" technique) will find this script particularly useful. For example, a trader may look at the 15-minute chart to catch short-term movements, the 30-minute chart for intraday trends, the 1-hour chart for swing positions, and the Daily chart for identifying the overarching market trend. The script enables them to view the EMAs for all these timeframes in one glance without having to manually switch between them.
By observing the relationships between EMAs across multiple timeframes, traders can gain valuable insights into market conditions such as:
Crossovers: When a shorter-term EMA crosses above or below a longer-term EMA, it can signal a potential trend reversal or continuation.
Trend Strength: Multiple EMAs in alignment across different timeframes can indicate strong trend strength.
Support and Resistance: EMAs can act as dynamic support and resistance levels, guiding traders on price action levels to watch for potential price reversals.
Instructions:
Enable/Disable EMAs: Toggle on or off the EMAs for each timeframe (15-min, 30-min, 1-hour, Daily) using the script’s settings.
Adjust EMA Lengths: Change the default lengths for each EMA to match your preferred settings for different timeframes.
Monitor Key Levels: Watch how price interacts with the plotted EMAs to spot potential trading signals based on your strategy.
This indicator is designed to enhance your multi-timeframe analysis and help make more informed, data-driven trading decisions.

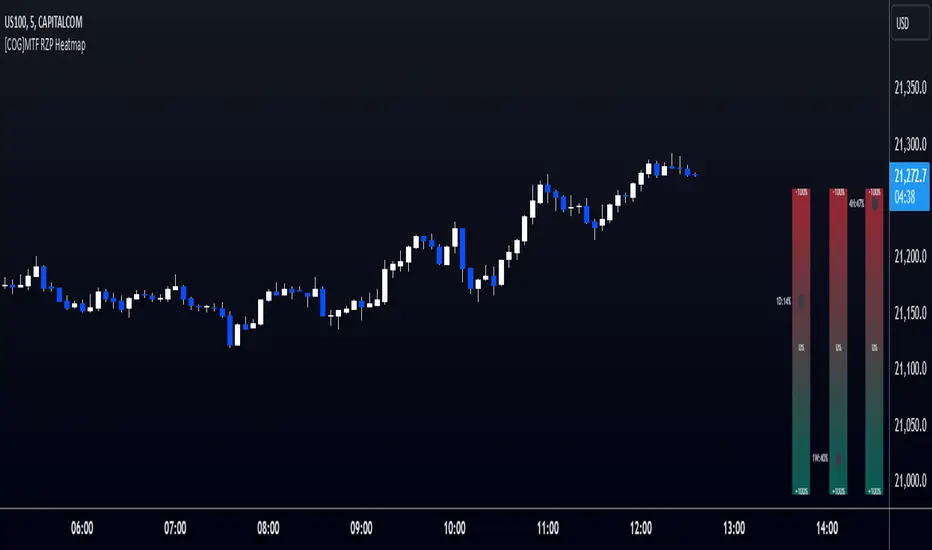
[COG]MTF RZP Heatmap MTF RZP Heatmap (Range Zone Pulse)
What It Does
This indicator creates three visual heatmaps that show how current price movement compares to the average range of different timeframes. It helps traders:
Identify when price moves are overextended
Compare momentum across different timeframes
Spot potential reversal points
Understand the relative strength of price movements
How It Works
Range Calculation:
For each selected timeframe, it calculates an average range based on the specified number of periods
The range is measured from high to low for each period
A moving average of these ranges creates a dynamic "normal" range for that timeframe
Position Calculation:
Measures how far price has moved from the period's opening price
Compares this movement to the average range
Converts the movement into a percentage (-100% to +100%)
Visual Display:
Shows three vertical heatmaps, one for each timeframe
Colors graduate from bearish (typically red) to bullish (typically green)
A dot indicator shows the current position within each range
Percentage labels show exact movement relative to average range
Trading Applications
Trend Trading:
Multiple timeframes aligned in the same color suggest strong trend
Use larger timeframes (Daily/Weekly) for trend direction
Use smaller timeframes (4H/1H) for entry timing
Mean Reversion:
Extreme readings (near +100% or -100%) suggest overextended moves
Look for divergences between timeframes
Use when shorter timeframes show extremes but larger timeframes don't
Volatility Trading:
Compare current moves to average ranges
Identify when markets are more volatile than usual
Adjust position sizes based on range expansion/contraction
Multi-Timeframe Analysis:
Compare price action across different time horizons
Identify conflicting signals between timeframes
Use for timeframe alignment in trading decisions
Best Practices for Usage
Timeframe Selection:
Set the first timeframe to your trading timeframe
Set the second timeframe to your trend timeframe
Set the third timeframe to your entry timeframe
Range Period Settings:
Default is 5 periods
Increase for more stable readings
Decrease for more responsive readings
Color Interpretation:
Darker colors indicate stronger moves
Look for alignment across timeframes
Watch for extremes in any timeframe
Trading Setups:
Wait for alignment in multiple timeframes
Use extreme readings for counter-trend trades
Combine with other indicators for confirmation
SSL Channel MTFSSL Channel with MTF support, This eliminates the noise of a basic SSL Channel script which is based on ErwinBeckers SSL Channel. So i have used a Multi Time Frame approach to have a clear confirmation of trend and reduce Noise and False signals unlike basic SSL Channel.
This script can be used to determine.
Support/Resistance
High/Low Breakout
Trend Direction
MA candles for Entry
The high and low sma are plotted as SSL CHANNEL when ever the high and low sma cross each other a direction change is observed.
The direction of SSL channel determines the trend of the price. The length of the channel can be changed as required a low value has a high noise and direction can be determined with low accuracy. Increasing the length of SSL channel has high accuracy trend confirmation.
The MTF SSL Channel uses plot from higher timeframe this helps in using SSL Channel as a Price Action Tool. Price when ever crosses over or below the channel determines a breakout. Price tries to move between the High SMA line and Low SMA Line of the SSL Channel rejection, breakouts can be easily observed on a lower timeframe using SSL Channel Plot from a higher timeframe.
I have used 5min/15min chart with MTF SSL from a 1Hr/4Hr and a length of 5 instead of 10. This helps quick direction changes over a period of 1hr to 4hr. Price is trapped within the High SMA and Low SMA lines of SSL Channel. In addition to SSL High Low and average mid line is plotted to additional reference.
Buy Sell Signals are plotted based on crossover of SMA High and Low.
Candle are Plotted Using a SMA with length of 5. This Candle Plot can be used to make an entry based on direction confirmation of SSL. keep in mind the direction of SSL Plot and the candle must be same. Preferably Entry can made above or below the midline of SSL Channel. The Candle Plot eliminates the Noise of traditional Japanese Candlesticks.
Additionally MACD Crossover and MACD Trend line confirmations can be used to confirm a Buy Sell and Entry signals
Alerts are also plotted accordingly.

HMA Fibonacci Rainbow Waves[FibonacciFlux]HMA Fibonacci Rainbow Waves
Overview
The HMA Fibonacci Rainbow Waves script is designed for traders who strive for simplicity in their trading strategies while navigating the complexities of chart analysis. By utilizing the Hull Moving Average (HMA) for smoothing, this indicator provides a refined view of price action. However, over-smoothing can sometimes filter out essential market noise. To address this, the indicator incorporates a unique approach by applying Fibonacci weighting to seven HMA200 calculations. This enables traders to capture noise while effectively following market trends.
BTCUSDT 4hour
Key Features
1. Hull Moving Average (HMA)
- The HMA is known for its responsiveness and ability to filter out noise, providing a clear view of the underlying trend.
- The indicator balances smoothness with responsiveness, making it suitable for various trading styles, from day trading to swing trading and scalping.
2. Fibonacci Weighting
- By applying Fibonacci numbers to the HMA calculations, the indicator enhances its ability to adapt to market dynamics.
- This unique approach allows traders to maintain clarity while accommodating fluctuations in price action, ensuring they do not miss critical entry points.
3. Multi-Timeframe Functionality
- The HMA Fibonacci Rainbow Waves indicator operates effectively across multiple timeframes, including daily, 4-hour, 5-minute, and 1-minute charts.
- This adaptability makes it a valuable tool for traders, regardless of their preferred trading style, facilitating seamless transitions between different market conditions.
4. Noise Capture and Trend Following
- The indicator is designed to capture essential market movements while filtering out excessive noise.
- It helps traders follow trends without being overwhelmed by market fluctuations, allowing them to act on advantageous entry conditions that might otherwise be obscured.
Signal Generation and Alerts
- The indicator generates buy and sell signals based on the relationship between the HMAs, providing clear entry and exit points.
- Customizable alerts keep traders informed of significant changes in market conditions, enabling timely decisions that reflect the nuances of market behavior.
BTCUSDT 15min
Benefits
1. Simplified Trading Approach
- Traders can focus on core market movements without being distracted by excessive noise, enhancing decision-making efficiency and minimizing emotional trading.
2. Flexibility Across Timeframes
- The ability to function across different timeframes allows traders to apply the same principles in various trading scenarios, from quick scalps to strategic swing trades.
3. Enhanced Market Insights
- The combination of HMA smoothing and Fibonacci weighting offers a comprehensive view of market trends, aiding traders in identifying potential opportunities, including those that institutional investors might exploit.
4. Resolving Complexity with Simplicity
- This indicator elegantly bridges the gap between simplicity and complexity, providing a single tool that addresses the inherent contradictions in trading psychology. It allows traders to simplify their strategies while still capturing the dynamic nature of the market.
BTCUSDT 1min
Conclusion
The HMA Fibonacci Rainbow Waves script is a powerful tool for traders seeking to streamline their analysis while effectively capturing market dynamics. By integrating advanced smoothing techniques with Fibonacci weighting, this indicator empowers traders to follow market trends confidently across various timeframes. Its design makes it an essential asset for both novice and experienced traders alike, offering insights that can reveal entry points often missed by traditional indicators.
Open Source Collaboration
This script is released as an open-source project on TradingView, inviting the global trading community to contribute and enhance its functionality. By collaborating on this project, traders can help improve its capabilities, ensuring it remains a valuable resource for market participants around the world.
Important Note
As with any trading tool, it is crucial to conduct thorough analysis and risk management when using this indicator. Past performance does not guarantee future results, and traders should always be prepared for potential market fluctuations.

Multi-Average Trend Indicator (MATI)[FibonacciFlux]Multi-Average Trend Indicator (MATI)
Overview
The Multi-Average Trend Indicator (MATI) is a versatile technical analysis tool designed for traders who aim to enhance their market insights and streamline their decision-making processes across various timeframes. By integrating multiple advanced moving averages, this indicator serves as a robust framework for identifying market trends, making it suitable for different trading styles—from scalping to swing trading.
MATI 4-hourly support/resistance
MATI 1-hourly support/resistance
MATI 15 minutes support/resistance
MATI 1 minutes support/resistance
Key Features
1. Diverse Moving Averages
- COVWMA (Coefficient of Variation Weighted Moving Average) :
- Provides insights into price volatility, helping traders identify the strength of trends in fast-moving markets, particularly useful for 1-minute scalping .
- DEMA (Double Exponential Moving Average) :
- Minimizes lag and quickly responds to price changes, making it ideal for capturing short-term price movements during volatile trading sessions .
- EMA (Exponential Moving Average) :
- Focuses on recent price action to indicate the prevailing trend, vital for day traders looking to enter positions based on current momentum.
- KAMA (Kaufman's Adaptive Moving Average) :
- Adapts to market volatility, smoothing out price action and reducing false signals, which is crucial for 4-hour day trading strategies.
- SMA (Simple Moving Average) :
- Provides a foundational view of the market trend, useful for swing traders looking at overall price direction over longer periods.
- VIDYA (Variable Index Dynamic Average) :
- Adjusts based on market conditions, offering a dynamic perspective that can help traders capture emerging trends.
2. Combined Moving Average
- The MATI's combined moving average synthesizes all individual moving averages into a single line, providing a clear and concise summary of market direction. This feature is especially useful for identifying trend continuations or reversals across various timeframes .
3. Dynamic Color Coding
- Each moving average is visually represented with color coding:
- Green indicates bullish conditions, while Red suggests bearish trends.
- This visual feedback allows traders to quickly assess market sentiment, facilitating faster decision-making.
4. Signal Generation and Alerts
- The indicator generates buy signals when the combined moving average crosses above its previous value, indicating a potential upward trend—ideal for quick entries in scalping.
- Conversely, sell signals are triggered when the combined moving average crosses below its previous value, useful for exiting positions or entering short trades.
Insights and Applications
1. Scalping on 1-Minute Charts
- The MATI excels in fast-paced environments, allowing scalpers to identify quick entry and exit points based on short-term trends. With dynamic signals and alerts, traders can react swiftly to price movements, maximizing profit potential in brief price fluctuations.
2. Day Trading on 4-Hour Charts
- For day traders, the MATI provides essential insights into intraday trends. By analyzing the combined moving average and its relation to individual moving averages, traders can make informed decisions on when to enter or exit positions, capitalizing on daily price swings.
3. Swing Trading on Daily Charts
- The MATI also serves as a valuable tool for swing traders. By evaluating longer-term trends through the combined moving average, traders can identify potential swing points and adjust their strategies accordingly. The flexibility of adjusting the lengths of the moving averages allows for tailored approaches based on market volatility.
Benefits
1. Clarity and Insight
- The combination of diverse moving averages offers a clear visual representation of market trends, aiding traders in making informed decisions across multiple timeframes.
2. Flexibility and Customization
- With adjustable parameters, traders can adapt the MATI to their specific strategies, making it suitable for various market conditions and trading styles.
3. Real-Time Alerts and Efficiency
- Built-in alerts minimize response times, allowing traders to capitalize on opportunities as they arise, regardless of their trading style.
Conclusion
The Multi-Average Trend Indicator (MATI) is an essential tool for traders seeking to enhance their technical analysis capabilities. By seamlessly integrating multiple moving averages with dynamic color coding and real-time alerts, this indicator provides a comprehensive approach to understanding market trends. Its versatility makes it an invaluable asset for scalpers, day traders, and swing traders alike.
Important Note
As with any trading tool, thorough analysis and risk management are crucial when using this indicator. Past performance does not guarantee future results, and traders should always be prepared for market fluctuations.

Adaptive Fibonacci Trend Ribbon[FibonacciFlux]Adaptive Fibonacci Trend Ribbon (FibonacciFlux)
Overview
The Adaptive Fibonacci Trend Ribbon is a versatile technical analysis tool designed for traders who want to leverage the power of multiple moving averages while integrating Fibonacci numbers. This indicator provides a dynamic visual representation of market trends, enhancing decision-making processes in trading.
Key Features
1. Multi-Moving Averages
- The indicator calculates eight different moving averages based on user-defined periods, including Fibonacci numbers such as 5, 8, 13, 21, 34, 55, 89, and 144.
- Traders can choose from various moving average types, including EMA, HMA, WMA, VWMA, ALMA, SMA, RMA, and TMA , allowing for tailored analysis based on market conditions.
2. Trend Detection
- Each moving average is color-coded based on its trend direction, with green indicating an upward trend and red indicating a downward trend.
- This visual clarity helps traders quickly assess market sentiment and make informed decisions.
3. Fill Areas for Enhanced Insight
- The indicator features fill areas between the moving averages, which dynamically change color according to their relative positions.
- This provides a clear visual cue of trend strength and potential reversal points, allowing traders to identify key areas of interest.
4. Customizable Inputs
- Users can easily adjust the source data, moving average lengths, and ALMA parameters (offset and sigma) to fit their trading strategies.
- This flexibility ensures that traders can adapt the tool to various market conditions and personal preferences.
Insights and Applications
1. Fibonacci Integration
- By incorporating Fibonacci numbers into the moving average periods, this indicator allows traders to align their strategies with key levels of support and resistance.
- This can enhance the accuracy of entry and exit points, particularly in trending markets.
2. Trend Continuation and Reversal Analysis
- The adaptive nature of the moving averages provides insights into potential trend continuations or reversals.
- Traders can use the indicator to identify when to enter or exit positions based on the interaction between the moving averages.
3. Visual Clarity for Quick Decisions
- The color-coded moving averages and fill areas offer immediate visual feedback on market conditions, helping traders react swiftly to changing dynamics.
- This is especially useful in fast-moving markets where timely decisions are critical.
Conclusion
The Adaptive Fibonacci Trend Ribbon is an essential tool for traders looking to enhance their technical analysis capabilities. By combining multiple moving averages with Fibonacci integration and dynamic visual cues, this indicator offers a robust framework for understanding market trends. Its flexibility and clarity make it an invaluable asset for both novice and experienced traders alike.
Open Source Contribution
This indicator is open source, inviting contributions and improvements from the trading community. Feel free to fork, enhance, and share your insights with the world, helping to foster a collaborative environment for traders everywhere.

DP-OCR MTF & MA 2024This script developed is designed for multi-timeframe analysis of previous open, close, and range, with additional signal plots based on various percentage extension levels. It also incorporates EMA calculations for crossover strategies. Here's a quick breakdown of what the script does:
Key Features:
1. Timeframes:
o Two separate timeframes (TF1 and TF2), which can be set by the user (e.g., 15 mins, 30 mins, daily, etc.). The script computes price actions and extensions for both timeframes. For better analysis, use Daily in TF1 and Weekly in TF2
2. Extension Levels:
o Calculates and plots 10%, 21%, 31%, 51%, and 61% extensions (both positive and negative) for each timeframe.
o The most commonly used extension levels are 61%, 31%, -61%, and -21%.
o These extension levels can be turned on or off by the user.
3. Open/Close/Range:
o Tracks the high, low, open, and close for both timeframes.
o Highlights open/close gaps.
o Plots the previous high/low range for both timeframes with a fill and different colors based on price movement.
How to Use:
• You can toggle specific extension levels on or off in the script’s settings.
• For example, when price hits a +61% extension, it could signal a breakout, and when it hits a -61% extension, it may indicate a potential retracement.
• Use these levels in conjunction with your price action analysis to set entry/exit points or stop-loss levels.
4. Today’s Open:
o Plots today’s opening price for both timeframes.
How to Use:
• Use today’s open as a key reference point to determine the day’s price action.
• Compare today’s open with the previous high/low or extension levels to evaluate possible trends or reversals.
5. EMA Calculations:
o The script calculates 5, 15, and 20 period EMAs and plots them on the chart.
o Additional EMA crossover signals can be included for strategy optimization.
How to Use:
• Observe the EMAs for potential crossover signals. For example, a 5-period EMA crossing above a 15-period or 20-period EMA may signal a buy opportunity, while a crossover in the opposite direction may signal a sell.
• Combine the EMA crossovers with extension levels or previous price data to refine your entries and exits.
Customizations Available:
• Users can select whether to display extension levels for either timeframe.
• The script allows automatic adaptation to intraday, daily, weekly, or monthly timeframes based on the current chart settings.
Moreover, the extension levels are calculated based on the previous period’s range, with the most commonly usable extension levels being 61, 31, -61, and -21. These levels are often used for identifying potential price retracements, breakouts, or reversal points in technical analysis.

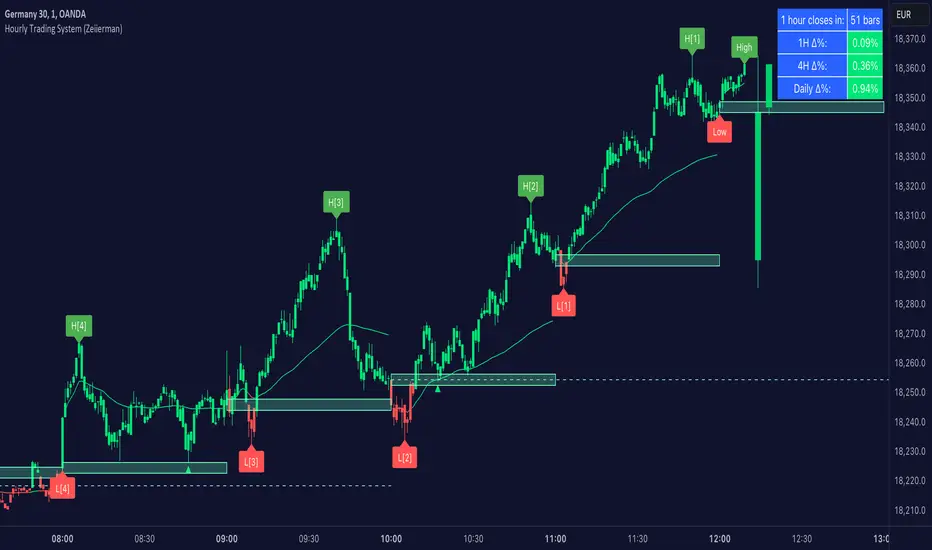
Hourly Trading System (Zeiierman)█ Overview
The Hourly Trading System (Zeiierman) is designed to enhance your trading by highlighting critical price levels and trends on an hourly basis. This indicator plots the open prices of hourly and 4-hour candles, visualizes retests, displays average price lines, and overlays higher timeframe candlesticks. It is particularly beneficial for intraday traders seeking to capitalize on short-term price movements and volume patterns.
█ How It Works
This indicator works by plotting significant price levels and zones based on hourly and 4-hour candle opens. It also includes functionalities for identifying retests of these levels, calculating and displaying average prices, and showing high and low labels for each hour.
█ Timeframe
The Hourly Trading System is designed to be used on the 1-minute or 5-minute timeframe. This system is tailored for intraday trading, allowing traders to find optimal entries around hourly opening levels and providing an easy method to identify the hourly trend. It works effectively on any market.
█ How to Use
Trend Analysis
Quickly gauge where the current price stands relative to key hourly and 4-hour levels. The plotted lines and zones serve as potential support and resistance areas, helping traders identify crucial points for entry or exit.
Utilize the 1-hour average and higher timeframe candles to understand the overall market trend. Aligning intraday strategies with larger trends can enhance trading decisions.
Use the bar coloring to quickly gauge the 1-hour trend on a lower timeframe. The bar colors indicate whether the hourly trend is bullish (green) or bearish (red), helping traders make quicker decisions in alignment with the overall trend.
Retest Identification
Enable retest signals to see where the price retested the hourly open levels. These retest points often signal strong price reactions, offering opportunities for trades based on support/resistance flips.
One effective strategy to incorporate is looking for price flips when a new hour starts. This approach involves monitoring price action at the beginning of each hour. If the price breaks and retests the hourly open level with strong momentum, it could indicate a potential trend reversal or continuation. This strategy is effective in volatile markets where price movements are significant at the start of each new hour.
Liquidity Sweep Strategy
Another common and effective strategy is the liquidity sweep. This involves identifying key levels where liquidity is likely to accumulate, such as previous hour highs and lows, and observing how the price interacts with these price levels. When the price sweeps through these levels, triggering stop-loss orders or pending orders, it often results in a sharp price movement followed by a reversal. Traders can capitalize on these movements by entering trades in the direction of the reversal once the liquidity sweep has occurred.
Equal Highs and Lows Strategy
The Equal Highs and Lows strategy leverages the concept of identifying levels where the price forms multiple highs or lows at the same level over different hourly periods. These equal highs and lows often indicate strong support or resistance levels where liquidity is accumulated. When the price approaches these levels, it is likely to trigger stop-loss orders and lead to significant price movements. Traders can look for breakouts or reversals around these levels to enter trades with higher probability setups.
█ Settings
Zone Width: Specifies the width of the zone around the 1-Hour Open as a percentage. Adjust this to widen or narrow the zone.
Show Retests: Enables or disables the display of retest markers. Retest markers show where the price has retested the 1-Hour Open line.
Number of Retests: Sets the number of retests to display. Adjust this to see more or fewer retest markers.
Volume Filter: Enables or disables the volume filter for retests. Use this to highlight retests with significant volume.
Volume Filter Length: Sets the length of the volume filter, smoothing the volume data to reduce noise.
1-Hour Average Line: Enables or disables the 1-hour average price line. This line shows the average price over the past hour.
Hourly High & Low Labels: Enables or disables the display of hourly high and low labels, marking the highest and lowest prices within each hour.
Candlesticks: Enables or disables the display of candlesticks on the chart, providing a detailed view of price action.
Bar Color: Enables or disables bar coloring based on price direction, with up bars in green and down bars in red.
Timeframe: Sets the timeframe for higher timeframe candles. Adjust this to match the period you want to analyze.
Number of Candles: Sets the number of higher timeframe candles to display. Increase this to see more candles on the chart.
Location: Sets the location for higher timeframe candles, allowing you to position them left or right on the chart.
-----------------
Disclaimer
The information contained in my Scripts/Indicators/Ideas/Algos/Systems does not constitute financial advice or a solicitation to buy or sell any securities of any type. I will not accept liability for any loss or damage, including without limitation any loss of profit, which may arise directly or indirectly from the use of or reliance on such information.
All investments involve risk, and the past performance of a security, industry, sector, market, financial product, trading strategy, backtest, or individual's trading does not guarantee future results or returns. Investors are fully responsible for any investment decisions they make. Such decisions should be based solely on an evaluation of their financial circumstances, investment objectives, risk tolerance, and liquidity needs.
My Scripts/Indicators/Ideas/Algos/Systems are only for educational purposes!
Supply & Demand (MTF) | Flux Charts💎 GENERAL OVERVIEW
Introducing our new Supply and Demand (MTF) Indicator! This new indicator renders Supply and Demand zones based on momentum candles. It can detect Supply and Demand zones across up to 3 diferent timeframes. It's capable of combining zones, retest & break labels and it's customizable with invalidation and style settings.
Features of the new Supply and Demand (MTF) Indicator:
Renders Supply and Demand Zones Across 3 Timeframes
Combination Of Overlapping Zones
Retest & Break Labels
Retest & Break Alerts
Enable / Disable Historic Zones
Visual Customizability
📌 HOW DOES IT WORK ?
Supply and Demand is a key concept in trading. It helps traders see the zones that market-makers buy & sell the asset in large amounts. It's detected by finding momentum candles (candles that have large bodies) in a row.
Momentum candles are defined to have a larger body than the average candle in the chart, and at least 4 of them in a row is required to draw a supply or demand zone. The zone is drawn from the high wick to low wick of two candles before the first momentum candle in the row.
Check this example :
These zones are usually where market makers trade the asset in larger amounts. Thus, they act as support & resistance zones by their nature. A retest of these zones can make the price bounce to the opposite direction, while a breakout usually means strong price action momentum is incoming in that direction. Supply zones indicate bearish momentum while demand zones indicate bullish momentum.
Check this example :
Here a Supply Zone (Bearish) forms. Then price comes back up to test the zone, and it fails to break. After the failed attemp, a stong bearish momentum takes the price back to a lower level. Then another test of the zone occurs and successfully breaks the zone this time. This breakout starts a bullish momentum that takes the price to a higher level.
🚩UNIQUENESS
This indicator provides Supply and Demand zones in your chart with pure simplicity. It supports up to 3 different timeframes as we believe supporting your trades with higher timeframes can improve your trading experience. It also gets rid of complexity by combining overlapping zones into a single zone, even if they are from different timeframes! You can also set-up alerts to get notified when a supply or demand zone is being retested, or is broken. Overall, this indicator is the ultimate kit for supply and demand zones.
⚙️SETTINGS
1. General Configuration
Max Distance To Last Bar -> The maximum distance that the indicator will render supply and demand zones from. Higher settings mean rendering older supply and demand zones.
Zone Invalidation -> Select between Wick & Close price for Supply and Demand Zone Invalidation.
Retests & Breaks -> Enable retest & break labels in your chart.
Show Historic Zones -> This will show historic supply & demand zones which are invalidated if enabled. You can disable this to only see active supply and demand zones for a simpler chart.
2. Timeframes
You can set up to 3 different timeframes and enable / disable them using the checkboxes in this section.

MTF OB Supply Demand ZonesHello everyone,
This exceptional indicator provides you with visual representations of bullish and bearish order blocks or supply and demand zones across multiple timeframes. In simple terms, bullish order blocks are represented by a small red candle followed by a large red candle, while bearish order blocks are depicted as a small green candle followed by a large red candle. Supply and demand zones are drawn by using order blocks.
Features:
Display order blocks from up to three different timeframes.
Customize the maximum number of boxes shown and the colors of the zones.
Choose from three different modes: OB (Order Block), Extended OB, and Supply/Demand.
Mode Descriptions:
OB: Includes the body of the candle.
Extended OB: Encompasses the body and wick of the candle.
Supply/Demand: Covers the body, wick, and half the body of the large candle.
Usage:
Ensure that charts 2 and 3 are set to a higher timeframe. For modes 2 and 3, it’s recommended to reduce the maximum number of boxes shown. The zones or boxes are transparent, allowing for overlap. This feature aids in identifying reversal zones or confirmed zones. The more intense the color, the stronger the confirmation. If a green zone overlaps a red zone (or vice versa), it signifies a reversal zone.
Thank you for checking out this indicator!
---
Additional Information:
Order blocks refer to specific price areas where large market participants, such as institutional traders, have previously placed significant buy or sell orders. These clusters of orders can impact price movement, liquidity, and market sentiment.
Order blocks are a strategic approach to identifying key levels of support and resistance based on the behavior of institutional traders. These key levels are then utilized as entry or exit points for trades.
An order block is an area where there has been a large concentration of limit orders awaiting execution. These blocks are identified on a chart by observing previous price action and pinpointing areas where the price experienced significant movement or abrupt changes in direction.
Order blocks are used in the following popular trading philosophies:
Smart Money Concepts (SMC)
Inner Circle Trading (ICT)
Price Action
---
Credits to: @AGFXTRADING

EMA Cross Dashboard | Flux Charts💎 GENERAL OVERVIEW
Introducing our new Exponential Moving Average (EMA) Cross Dashboard! This dashboard let's you select a source for the calculation of the EMA of it, then let's you enter 2 lengths for up to 5 timeframes, plotting their crosses in the chart.
Features of the new EMA Cross Dashboard :
Shows EMA Crosses Across Up To 5 Different Timeframes.
Select Any Source, Including Other Indicators.
Customizable Dashboard.
📌 HOW DOES IT WORK ?
EMA is a widely used indicator within trading community, it is similar to a Simple Moving Average (SMA) but places more weight on recent prices, making it more reactive to current trends. Crosses of EMA lines can be helpful to determine strong bullish & bearish movements of an asset. This indicator shows finds crosses across 5 different timeframes in a dashboard and plots them in your chart for ease of use.
🚩UNIQUENESS
This dashboard cuts through the hassle of manual EMA cross calculations and plotting. It offers flexibility by allowing various data sources (even custom indicators) and customization through enabling / disabling individual timeframes. The clear visualization lets you see EMA crosses efficiently.
⚙️SETTINGS
1. Timeframes
You can set up to 5 timeframes & 2 lenghts to detect crosses for each timeframe here. You can also enable / disable them.
2. General Configuration
EMA Source -> You can select the source for the calculation of the EMA here. You can select sources from other indicators as well as more general sources like close, high and low price.

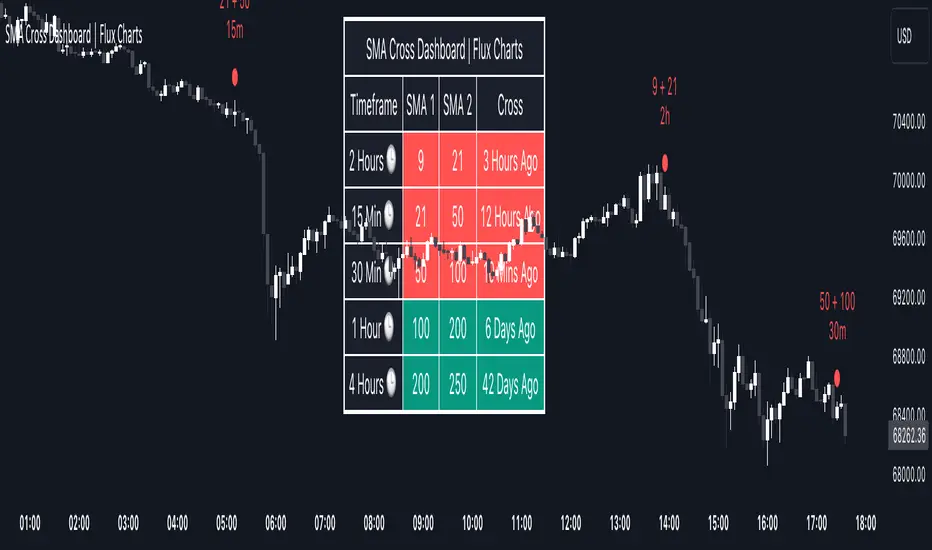
SMA Cross Dashboard | Flux Charts💎 GENERAL OVERVIEW
Introducing our new Simple Moving Average (SMA) Cross Dashboard! This dashboard let's you select a source for the calculation of the SMA of it, then let's you enter 2 lengths for up to 5 timeframes, plotting their crosses in the chart.
Features of the new SMA Cross Dashboard :
Shows SMA Crosses Across Up To 5 Different Timeframes.
Select Any Source, Including Other Indicators.
Customizable Dashboard.
📌 HOW DOES IT WORK ?
SMA is a widely used indicator within trading community, it simply works by taking the mathematical average of a source by desired length. Crosses of SMA lines can be helpful to determine strong bullish & bearish movements of an asset. This indicator shows finds crosses across 5 different timeframes in a dashboard and plots them in your chart for ease of use.
🚩UNIQUENESS
This dashboard cuts through the hassle of manual SMA cross calculations and plotting. It offers flexibility by allowing various data sources (even custom indicators) and customization through enabling / disabling individual timeframes. The clear visualization lets you see SMA crosses efficiently.
⚙️SETTINGS
1. Timeframes
You can set up to 5 timeframes & 2 lenghts to detect crosses for each timeframe here. You can also enable / disable them.
2. General Configuration
SMA Source -> You can select the source for the calculation of the SMA here. You can select sources from other indicators as well as more general sources like close, high and low price.
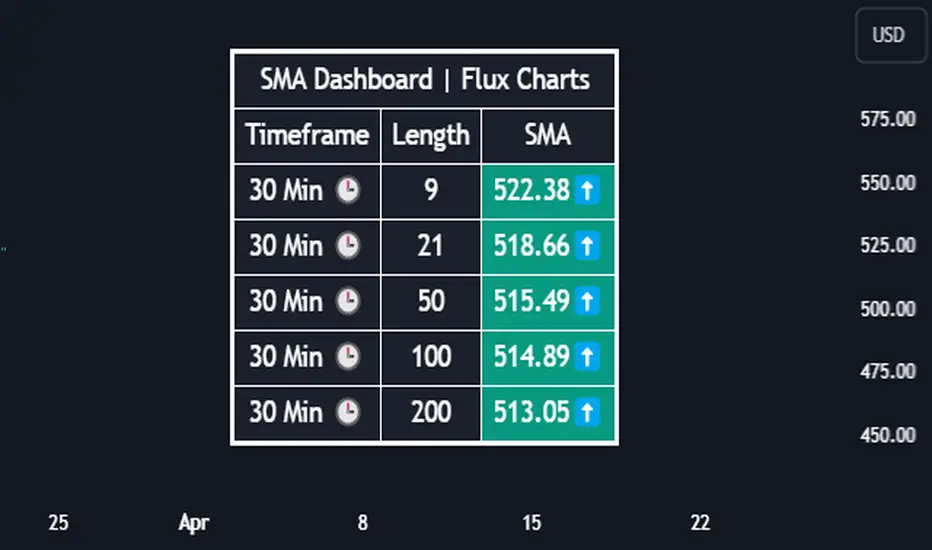
SMA Dashboard | Flux Charts💎 GENERAL OVERVIEW
Introducing our new Simple Moving Average (SMA) Dashboard! This dashboard let's you select a source for the calculation of the SMA of it, then shows it across 5 different lengths and timeframes.
Features of the new SMA Dashboard :
Shows SMA Across 5 Different Lengths & Timeframes.
Select Any Source, Including Other Indicators.
Enable / Disable Plotting Lines.
Customizable Dashboard.
📌 HOW DOES IT WORK ?
SMA is a widely used indicatior within trading community, it simply works by taking the mathematical average of a source by desired length. This indicator then shows it across 5 different timeframes in a dashboard and plots them in your chart for ease of use.
🚩UNIQUENESS
This dashboard cuts through the hassle of manual SMA calculations and plotting. It offers flexibility by allowing various data sources (even custom indicators) and customization through enabling / disabling SMA lines. The clear visualization lets you compare multiple SMAs efficiently.
⚙️SETTINGS
1. Timeframes
You can set up to 5 timeframes & lengths for the dashboard to show here. You can also turn on plotting and enable / disable them.
2. General Configuration
SMA Source -> You can select the source for the calculation of the SMA here. You can select sources from other indicators as well as more general sources like close, high and low price.
Trend Channels (MTF) | Flux Charts💎 GENERAL OVERVIEW
Introducing our new Trend Channels (MTF) indicator! Latest trends play an important role for traders and sometimes it can be hard to spot trends in other timeframes. This indicator can plot latest trend channels across different timeframes, so you can spot trends and their channels easier. More info about the process in the "How Does It Work" section.
Features of the new Trend Channels (MTF) indicator :
Plot Trend Channels Across Up To 3 Different Timeframes
Broad Customizability Of Trend Detection
Variety Of Trend Invalidation Options
High Visual Customizability
🚩UNIQUENESS
While the detection of trend channels is a common concept among traders, trend channels across different timeframes can be as crucial as the ones in the current timeframe. This indicator can find them from up to 3 different timeframes. While the general settings will perform well enough most of the time, the indicator also provides fine-tuning options for trend detection and trend invalidation for more experienced traders.
📌 HOW DOES IT WORK ?
Trend channels occur when the price of an asset starts making a strong movement in a bullish or a bearish direction. This indicator detects trend channels using the Simple Moving Average (SMA). When the slope of the SMA line exceeds the user-defined size, a trend channel will occur.
To understand how individual settings work, you can check the "⚙️SETTINGS" section.
⚙️SETTINGS
1. General Configuration
SMA Length -> Determines the length used in the SMA function. Higher values mean that an average of a longer timespan will be taken into account when spotting trends.
Slope Length -> Used while finding the slope of the trend channel. Check this example for slope length :
ATR Size -> This setting is taken into calculation while checking if a trend channel is worth plotting. The higher this setting is, the higher the slope of the trend channel must be to get rendered. You can take a look at the chart provided above for a visual explanation.
Channel Expander -> When a trend channel occurs, the top and the bottom of the channel are initally determined by the latest highest highs / lowest lows. This setting expands the channel vertically by X times Average True Range (ATR). Check this example :
Trend Invalidation -> The trend channel gets invalidated when the bar closes / wicks above the top of the channel, or below the bottom of the channel. With this setting, you can switch the behaviour between bar close / bar wick.
Avoid False Invalidation -> This setting makes it harder for trend channels to get invalidated to prevent false invalidations.
Retries : The trend channel will have 5 chances for invalidation. First 4 invalidations will not invalidate the channel. The trend channel will only invalidate once the 5th invalidation occur.
Volume : The bar that invalidates the trend channel must have a volume higher than 1.5x the average bar volume of the current chart. Otherwise the trend channel will not be invalidated.
None : The trend channel will invalidate at the first invalidation.

Time Based Comparison Tool [TFO]The goal of this indicator is to show how multiple assets are trading relative to their Previous Highs and Lows. Many traders have probably seen charts resembling this that may plot how asset prices are trading as a percent change over time, or something similar.
The key difference with this indicator is that all prices are normalized to reflect how they are trading with respect to the previous range of a user-defined timeframe. Without the normalization process, we would simply be observing some percent change from a given point in time; but this does not provide enough information to describe where price is trading relative to our desired frame of reference.
For example, if the timeframe setting was chosen to be 1 day, the indicator would plot the Previous High (PH) and Previous Low (PL) of the current symbol on the daily timeframe, denoted here by the black lines and labels. Then, the adjusted price of all selected symbols would be shown to visualize how each one is moving with respect its own PH and PL, using the current symbol's PH and PL as reference points.
In the above chart, we can see that CL was trading below its PDL from about 10:00-11:00 am EST, then broke above and retested it at around 11:20 am EST, before trading higher. To verify that this comparison works as intended, we can check to see that CL did in fact retest its PDL at this time before trading higher. Note that we are using the close price for this evaluation.
Since limiting the output to close prices can leave out some vital information, we can change the Plot Type setting from "Close" to "High to Low," which will instead show the range of prices from high to low instead of just the close.
We can expand on this by detecting when PH's and PL's have been raided (traded through), by displaying the text PHR (Previous High Raid) or PLR (Previous Low Raid) next to the symbol's label on the right. In this case below, where we're using the 1 week timeframe, we can observe that NQ1! (purple) traded through the PL level and thus its label (right) is updated to indicate a PLR.
Similarly, YM1! traded through its PH level and was updated to indicate a PHR; and ES1! raided both levels, with its label reflecting just that.
Due to the native limitation of output series in a single pine script, alerts have been consolidated to "Any PHR" or "Any PLR," meaning these alerts would fire if any of the selected symbols raided a PH or PL, respectively. If one wanted to be alerted for just a specific symbol, this could be achieved by deselecting all symbols except that which is desired, then setting an alert and adjusting its title for easier user recognition.

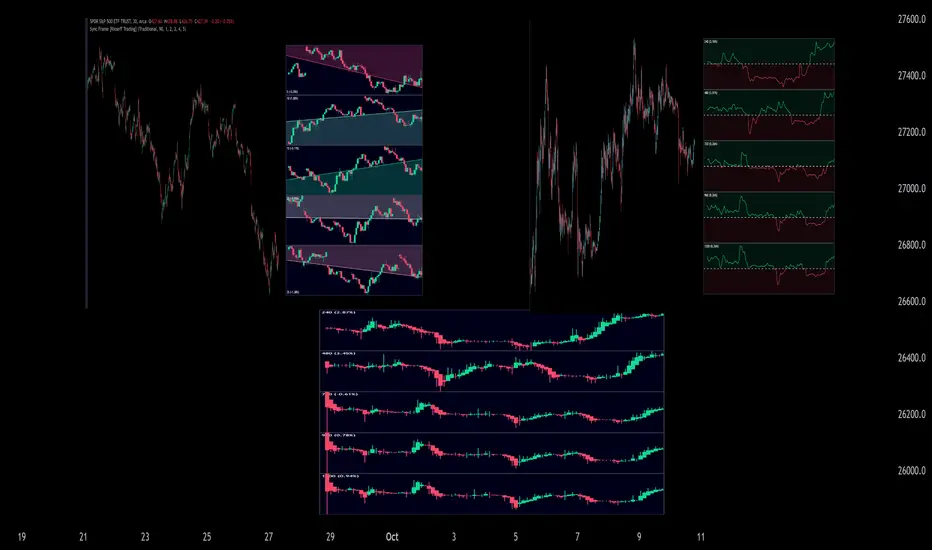
Sync Frame (MTF Charts) [Kioseff Trading]Hello!
This indicator "Sync Frame" displays various lower timeframe charts for the asset on your screen!
5 lower timeframe candle charts shown
Timeframes auto-calculated using the new timeframe.from_seconds() function
Heikin-Ashi candles available
Baseline chart type available
Dynamic Scaling for ease of use
User customizable timeframes
Simple script (:
The image above shows the baseline chart type.
Time image above shows a traditional candlestick chart.
The image above shows a hekin-ashi chart.
The image above shows the indicator when nearly zoomed in as much as possible. The lower timeframe charts adjust to my chart positioning.
The image above shows my screen fully zoomed out; the lower timeframe charts adjust in both height and width to accommodate my chart positioning!
Thank you for checking this out (:
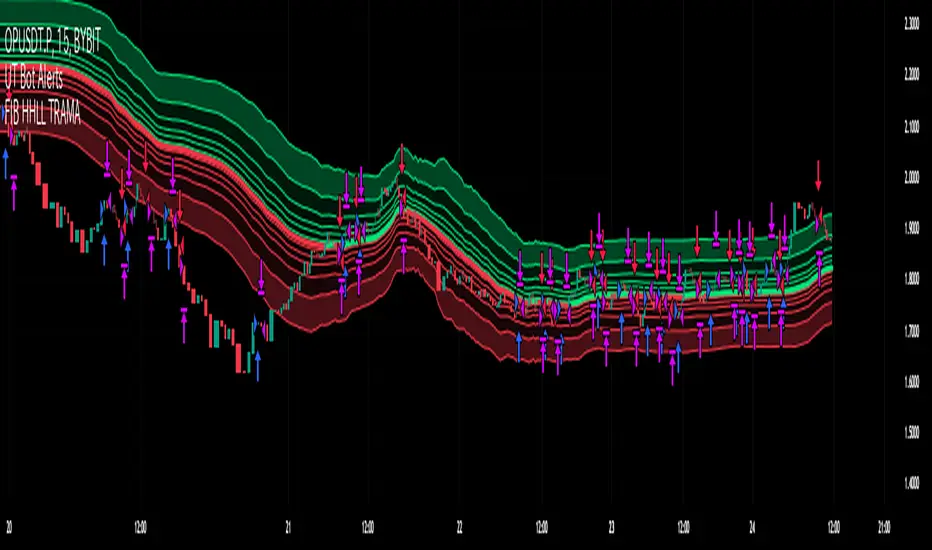
Fibonacci HH LL TRAMA BandLuxAlgo's Trend Moving Adaptive Moving Average was used as a reference to create bands by reading the highest and lowest prices of past bars based on Fibonacci numbers and then multiplying them by the Fibonacci ratio.
LuxAlgo/ LuxAlgo/
In particular, the so-called TRAMA is characterized by its adaptation to the average of the highest and lowest prices over a specific period of time and is used to identify support/resistance.
In order to apply this feature to the maximum extent possible, I used the high or low prices as the source of input, rather than the closing price.
For example,
src = high
not original like
src = close
In addition, I created 6 levels by multiplying the Fibonacci ratio
//Midline
mah = ama1
mal = ama2
m = (mah + mal)/2
//Half Mean Range
dist = (mah - mal)/2
//Levels
h6 = m + dist * 11.089
h5 = m + dist * 6.857
h4 = m + dist * 4.235
h3 = m + dist * 2.618
h2 = m + dist * 1.618
h1 = m + dist * 0.618
l1 = m - dist * 0.618
l2 = m - dist * 1.618
l3 = m - dist * 2.618
l4 = m - dist * 4.235
l5 = m - dist * 6.857
l6 = m - dist * 11.089
If you want to use it for scalping, such as 15 minutes, you can include Fibonacci numbers such as 21,34,55 for a quick reaction type to detect the trend. Also, by including Fibonacci numbers such as 89,144,233, you can see where you stand in the larger trend. Some examples are included below.
For Investors
BTCUSDT 1day Chart Fibonacci number "55"
For Daytraders
BTCUSDT 4hour Chart Fibonacci number "34"
For Scalpers
BTCUSDT 15min Chart Fibonacci number "55"
BTCUSDT 15min Chart Fibonacci number "89"
BTCUSDT 15min Chart Fibonacci number "233"
Fibonacci numbers are 1, 1, 2, 3, 5, 8, 13, 21, 34, 55, 89, 144, 233, 377, 610, etc.,
Fibonacci ratios are 0.618, 1.618, 2.618, 4.236, 6.854, 11.089, etc.,
The Opening Range / First Bar By Market Mindset - Zero To EndlesThe script shows the opening range of the instrument based on different resolutions and timeframes.
Inputs :
1. Resolution
It decides the calculation frequency of the script.
In Auto resolution, Standard values have been used.
2. Timeframe
It decides the timeframe for the OHLC values.
By default, it will use the chart timeframe and so chart OHLC values.
3. Lookback
It decides the no. of ranges shown on the chart.
Middle Line can be hidden from the settings.
The script can be used for any instrument and on any timeframe.
If price is above the opening range or the middle line, a trader should look for long opportunities.
If price is below the opening range or the middle line, a trader should look for short opportunities.
A sideways or choppy move is exoected if Middle line is crossed again and again.
For trading, wait for atleast 1st bar to close. and let the opening range build up first.
Happy Trading

MTF Smoothable RSI Nexus [DarkWaveAlgo]🧾 Description:
A nexus is a connection, link, or neuronal junction where signals and information are transmitted between different elements.
The MTF Smoothable RSI Nexus indicator serves as a nexus between smoothable, MTF RSIs by facilitating the visualization and interaction of up to six multi-timeframe RSIs, each with its own customizable timeframe, period, coloring customization, and price source. By combining these various RSIs, it helps you create a comprehensive view of MTF momentum trends and dynamics.
It acts as a control center that brings together multiple MTF RSIs and allows you to visualize the interactions between them with exceptional ease-of-use and customizability, helping to provide you with valuable insights into potential trend reversals, momentum shifts, and trading opportunities.
💡 Originality and Usefulness:
While there are other multi-timeframe RSI indicators available, MTF Smoothable RSI Nexus' global smoothing settings offer a flexible take on the development of price momentum across various timeframes. Its semi-transparent overbought and oversold fill zones create a compounding opaqueness when RSIs from multiple timeframes coalesce - making visual assessment of momentum extremes incredibly easy. We also believe it stands above the rest with its sheer quantity and quality of settings, features, and usability.
✔️ Re-Published to Avoid Misleading Values
This script has been re-published to ensure that it does not use `request.security()` calls using lookahead_on to access future data when referencing RSIs from other timeframes. This decreases the likelihood that the indicator will provide deceiving values. This change has been made in accordance with the PineScript documentation: "Using barmerge.lookahead_on at timeframes higher than the chart's without offsetting the `expression` argument like in `close [ ]` will introduce future leak in scripts, as the function will then return the `close` price before it is actually known in the current context" and the Publishing Rule: "Do not use `request.security()` calls using lookahead to access future data". Historical and real-time values may differ when referencing timeframes other than the chart's.
💠 Features:
6 toggleable MTF Smoothable RSIs with customizable timeframes, periods, and price sources
Compounding overbought/oversold filled areas for easy MTF momentum analysis
Aesthetic and flexible coloring and color theme styling options
End-of chart labels and options for ease-of-use and legibility
⚙️ Settings:
Use a Color Theme: When this setting is enabled, all manual 'Bullish and Bearish Colors' are overridden. All plots will use the colors from your selected Color Theme - excepting those plots set to use the 'Single Color' coloring method.
Color Theme: When 'Use a Color Theme' is enabled, this setting allows you to select the color theme you wish to use.
Hide RSIs on Timeframes Lower Than the Chart: When this setting is enabled, any MTF RSI with a timeframe smaller than that of the chart the indicator is applied to will be hidden from view.
Overbought Level: Set the level value for the overbought line.
Oversold Level: Set the level value for the oversold line.
Overbought Color: When 'Use a Color Theme' is disabled, this will set the color for the Overbought Level line.
Oversold Color: When 'Use a Color Theme' is disabled, this will set the color for the Oversold Level line.
Fill Overbought/Oversold Areas: When enabled, the area between any MTF RSI and the Overbought/Oversold level will be filled with semi-transparent coloring if that RSI is above/below the respective level.
Smooth RSIs: When enabled, all MTF RSIs will be processed through an additional smoothing average calculation.
Smoothing Type: Set the calculation type for the smoothing process. Options include: Exponential, Simple, Weighted, Volume-Weighted, and Hull.
Enable: Show/hide a specific MTF RSI.
Timeframe: Set the timeframe for a specific MTF RSI.
Period: Set the lookback period for a specific MTF RSI.
Source Price: Set the source value used for a specific MTF RSI's calculation.
Coloring Method: Set the coloring method for this specific RSI. The coloring method defines how the RSI should be dynamically colored. Options include: 'Single Color' and 'Increasing/Decreasing'.
Bullish Color: When 'Use a Color Theme' is disabled, this will set the 'bullish color' for this specific MTF RSI.
Bearish Color: When 'Use a Color Theme' is disabled, this will set the 'bearish color' for this specific MTF RSI.
Single Color: When the 'Coloring Method' is set to Single Color for this specific RSI, this color option will set the RSI's color.
Enable Label: When enabled, a label will show at the end of the chart displaying the timeframe, period, smoothing type (if any), and current price value of this specific MTF RSI.
Size: Sets the font size of this specific MTF RSI's label.
Label Offset (in Bars): Sets the distance from the latest bar, in bars, at which this specific MTF RSI's label is displayed.
Show Label Line: When enabled, this specific MTF RSI's label will be accommodated by a dashed line connecting it to its plot.
📈 Chart:
The chart shown in this original publication displays the 15 minute chart on ETHUSDT. Displayed on the chart are 4 MTF RSIs: the 15m 14 WMA-Smoothed RSI, 1h 14 WMA-Smoothed RSI, 4h 14 WMA-Smoothed RSI, and the 1D 14 WMA-Smoothed RSI - offering an exemplary view of how you can easily use these MTF RSIs to your advantage in analyzing momentum relationship across multiple timeframes.

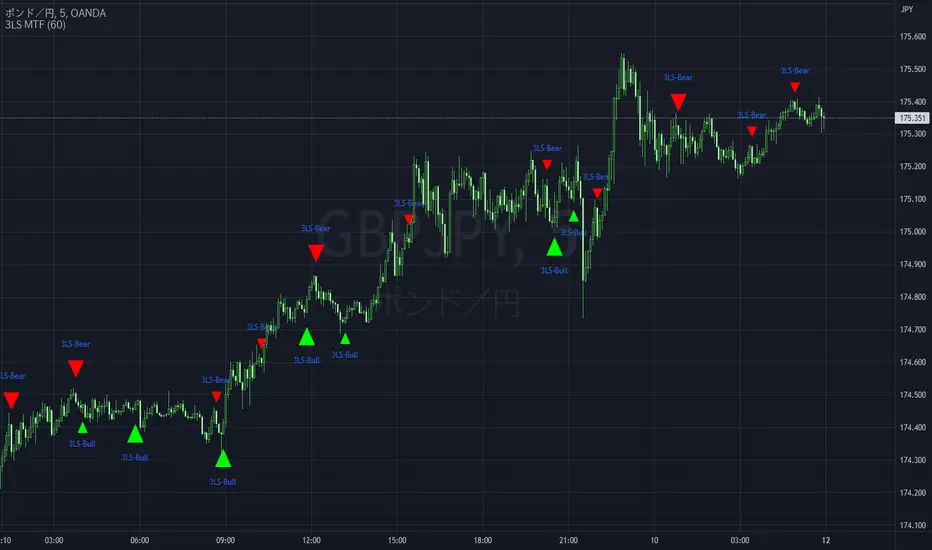
3 Line Strike MTF [MsF]Japanese below / 日本語説明は英文の後にあります。
-------------------------
*This indicator is based on TheTrdFloor's "3 Line Strike ". It's a very cool indicator. thank you.
In addition to the original indicator, it will be judged Engulfing only when the display of the MTF signal and the candle have a difference of 2 times or more.
=== Function description ===
1. Display of the MTF signal
Detects Engulfing of the specified Multi Time Frame. MTF Engulfing is displayed with 🍆 and 🍑.
2. Judged Engulfing on a difference of 2 times or more
Show a signal if the body of the current candle is more than twice as large as the body of the previous candle. This will make the signal mark appear larger than normal.
=== Parameter description ===
- COMMON SETTING
- Show Signal on MTF ? … If the check this, you can get MTF 3 Line Strike
- Judge Double Engulfing ? … If you check it, the signal will come up only when the Engulfing has doubled or more.
- 3 LINE STRIKE
- Show Bearish 3 Line Strike … The Bearish 3 Line Strike (3LS-Bear) is a candlestick pattern comprised of 3 bullish (green) candles, followed by a bearish engulfing candle (see 'Big A$$ Candles' below). This pattern tends to be best used as a signal of the end of a retracement period as part of a trend continuation strategy. Default: Checked
- Show Bullish 3 Line Strike … The Bullish 3 Line Strike (3LS-Bull) is a candlestick pattern comprised of 3 bearish (red) candles, followed by a bullish engulfing candle (see 'Big A$$ Candles' below). This pattern tends to be best used as a signal of the end of a retracement period as part of a trend continuation strategy. Default: Checked
- BIG A$$ CANDLES
- Show Bearish Big A$$ Candles … Bearish 'Big A$$ Candles' are the same as Bearish Engulfing candles.
- Show Bullish Big A$$ Candles … Bullish 'Big A$$ Candles' are the same as Bullish Engulfing candles.
-------------------------
本来のインジケーターに、①MTFシグナルの表示と②ローソク足の表示に2倍以上の差がある場合のみ包み足の判定を追加しました。
=== 機能説明 ===
1. MTFシグナルの表示
指定された時間足の包み足を検出します。 🍆 と 🍑 で表示されます。
2. 2倍以上の差で包み足判定
現在のローソクの実体が前のローソクの実体よりも 2 倍以上大きい場合にシグナルを表示します。マークは通常よりも大きく表示されます。
=== パラメータの説明 ===
- COMMON SETTING
- Show Signal on MTF ? … MTFシグナルを表示します
- Judge Double Engulfing ? … 包み足が前の足の2倍以上になった場合のみシグナルを発報します
- 3 LINE STRIKE
- Show Bearish 3 Line Strike … 陰線が3連続続いた後の包み足を検出します
- Show Bullish 3 Line Strike … 陽線が3連続続いた後の包み足を検出します
- BIG A$$ CANDLES
- Show Bearish Big A$$ Candles … 陽線の包み足を検出します
- Show Bullish Big A$$ Candles … 陰線の包み足を検出します
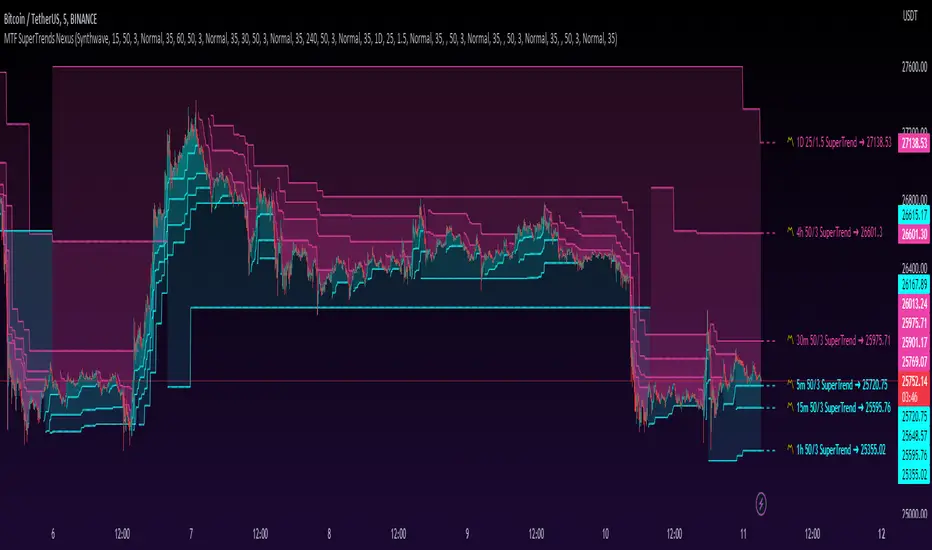
MTF SuperTrends Nexus [DarkWaveAlgo]🧾 Description:
A nexus is a connection, link, or neuronal junction where signals and information are transmitted between different elements.
The MTF SuperTrends Nexus indicator serves as a nexus between MTF SuperTrends by facilitating the visualization of up to eight multi-timeframe SuperTrends, each with its own customizable timeframe, period, factor, and coloring customization. By combining these various SuperTrends, it helps you create a comprehensive view of MTF trend dynamics and cross-timeframe confluence according to the SuperTrend indicator.
It acts as a utility/control center that brings together multiple MTF SuperTrends and allows you to visualize the interactions between them with exceptional ease-of-use and customizability, helping to provide you with valuable insights into potential trend reversals, momentum shifts, and trading opportunities.
💡 Originality and Usefulness:
While there are other multi-timeframe SuperTrend indicators available, MTF SuperTrends Nexus' semi-transparent fills create a compounding opaqueness when SuperTrends from multiple timeframes coalesce - making visual assessment of cross-timeframe confluence extremely easy. We also believe it stands above the rest with its sheer quantity and quality of settings, features, and usability.
✔️ Re-Published to Avoid Misleading Values
This script has been re-published to ensure that it does not use `request.security()` calls using lookahead_on to access future data when referencing SuperTrend calculations from other timeframes. This decreases the likelihood that the indicator will provide deceiving values. This change has been made in accordance with the PineScript documentation: "Using barmerge.lookahead_on at timeframes higher than the chart's without offsetting the `expression` argument like in `close [ ]` will introduce future leak in scripts, as the function will then return the `close` price before it is actually known in the current context" and the Publishing Rule: "Do not use `request.security()` calls using lookahead to access future data". Historical and real-time values may differ when referencing timeframes other than the chart's.
💠 Features:
8 toggleable MTF SuperTrends with customizable timeframes, periods, and factors
Compounding filled areas for easy MTF SuperTrend confluence analysis
Aesthetic and flexible coloring and color theme styling options
End-of chart labels and options for ease-of-use and legibility
⚙️ Settings:
Use a Color Theme: When this setting is enabled, all manual 'Bullish and Bearish Colors' are overridden. All plots will use the colors from your selected Color Theme - excepting those plots set to use the 'Single Color' coloring method.
Color Theme: When 'Use a Color Theme' is enabled, this setting allows you to select the color theme you wish to use.
Fill SuperTrend Areas: When enabled, the area between any MTF SuperTrend and the price bars will be filled with semi-transparent coloring.
Hide SuperTrends on Timeframes Lower Than the Chart: When this setting is enabled, any MTF SuperTrend with a timeframe smaller than that of the chart the indicator is applied to will be hidden from view.
Enable: Show/hide a specific MTF SuperTrend.
Timeframe: Set the timeframe for a specific MTF SuperTrend.
Period: Set the lookback period for a specific MTF SuperTrend.
Factor: Set the multiplier factor used for a specific MTF SuperTrend's calculation.
Bullish Color: When 'Use a Color Theme' is disabled, this will set the 'bullish color' for this specific MTF SuperTrend.
Bearish Color: When 'Use a Color Theme' is disabled, this will set the 'bearish color' for this specific MTF SuperTrend.
Enable Label: When enabled, a label will show at the end of the chart displaying the timeframe, period, factor, and current price value of this specific MTF SuperTrend.
Size: Sets the font size of this specific MTF SuperTrend's label.
Label Offset (in Bars): Sets the distance from the latest bar, in bars, at which this specific MTF SuperTrend's label is displayed.
Show Label Line: When enabled, this specific MTF SuperTrend's label will be accommodated by a dashed line connecting it to its plot.
📈 Chart:
The chart shown in this original publication displays the 5 minute chart on BTCUSDT. Displayed on the chart are 6 MTF SuperTrends: the 5m 50-period/3-factor SuperTrend, 15m 50-period/3-factor SuperTrend, 30m 50-period/3-factor SuperTrend, 1h 50-period/3-factor SuperTrend, 4h 50-period/3-factor SuperTrend, and the 1D 25-period/1.5-factor SuperTrend - offering an exemplary view of how you can easily use these MTF SuperTrends to your advantage in analyzing SuperTrend relationships across multiple timeframes.
MTF MAs and Crosses Nexus [DarkWaveAlgo]🧾 Description:
A nexus is a connection, link, or neuronal junction where signals and information are transmitted between different elements.
The MTF MAs and Crosses Nexus indicator serves as a nexus between MTF Moving Averages by facilitating the visualization and interaction of up to eight multi-timeframe moving averages, each with its own customizable timeframe, period, cross-over and cross-under alerts and plot markers, moving average calculation type, and price source.
It acts as a utility/control center that brings together multiple MTF moving averages (MTF MAs) and allows you to visualize the interactions between them with exceptional ease-of-use and customizability, helping to provide you with valuable insights into potential trend reversals, momentum shifts, and trading opportunities.
💡 Originality and Usefulness:
While there are other multi-timeframe moving average indicators available, MTF MAs and Crosses Nexus' customizable alert and signal settings offer intra-indicator MTF moving average cross markers and alerts not seen in other MTF MA indicators, allowing you to visualize the cross-over and cross-under relationships between the indicator's MAs with an 'all-in-one' experience. We also believe it stands above the rest with its sheer quantity and quality of settings, features, and usability.
✔️ Re-Published to Avoid Misleading Values
This script has been re-published to ensure that it does not use `request.security()` calls using lookahead_on to access future data when referencing moving averages from other timeframes. This decreases the likelihood that the indicator will provide deceiving values. This change has been made in accordance with the PineScript documentation: "Using barmerge.lookahead_on at timeframes higher than the chart's without offsetting the `expression` argument like in `close ` will introduce future leak in scripts, as the function will then return the `close` price before it is actually known in the current context" and the Publishing Rule: "Do not use `request.security()` calls using lookahead to access future data".
💠 Features:
8 toggleable MTF Moving Averages with customizable timeframes, periods, moving average calculation types, and price sources
Customizable cross-over and cross-under alert and chart signal options for each MTF MA (toggleable cross alerts and signals for crosses between intra-indicator MAs and bar price values)
Aesthetic and flexible coloring and color theme styling options
End-of chart labels and options for ease-of-use and legibility
⚙️ Settings:
Use a Color Theme: When this setting is enabled, all manual 'Bullish and Bearish Colors' are overridden. All plots will use the colors from your selected Color Theme - excepting those plots set to use the 'Single Color' coloring method.
Color Theme: When 'Use a Color Theme' is enabled, this setting allows you to select the color theme you wish to use.
Hide MAs on Timeframes Lower Than the Chart: When this setting is enabled, any MTF MA with a timeframe smaller than that of the chart the indicator is applied to will be hidden from view.
Enable: Show/hide a specific MTF MA.
Timeframe: Set the timeframe for a specific MTF MA.
Period: Set the lookback period for a specific MTF MA.
Type: Set the calculation type for a specific MTF MA. Options include: Exponential, Simple, Weighted, Volume-Weighted, and Hull.
Source Price: Set the source value used for a specific MTF MA's calculation.
Enable Cross Over Signals & Alerts: When enabled, cross-over chart signals (markers) and alerts are enabled for when this specific MTF MA crosses above its respective 'Cross Over Cross Source'.
Enable Cross Under Signals & Alerts: When enabled, cross-under chart signals (markers) and alerts are enabled for when this specific MTF MA crosses below its respective 'Cross Under Cross Source'.
Cross Source: Set the target plot which this specific MTF MA must cross (for either a cross-over or cross-under event) to trigger a chart signal and alert.
Marker Position: Set the position where this specific MTF MA's cross chart signal should appear. Options include: Above Bar, Below Bar, and On MA Line.
Coloring Method: Set the coloring method for this specific MA. The coloring method defines how the MA should be dynamically colored. Options include: Single Color, Increasing/Decreasing, and Over/Under Price.
Bullish Color: When 'Use a Color Theme' is disabled, this will set the 'bullish color' for this specific MTF MA.
Bearish Color: When 'Use a Color Theme' is disabled, this will set the 'bearish color' for this specific MTF MA.
Single Color: When the 'Coloring Method' is set to Single Color for this specific MA, this color option will set the MA's color.
Enable Label: When enabled, a label will show at the end of the chart displaying the timeframe, period, MA type, and current price value of this specific MTF MA.
Size: Sets the font size of this specific MTF MA's label.
Label Offset (in Bars): Sets the distance from the latest bar, in bars, at which this specific MTF MA's label is displayed.
Show Label Line: When enabled, this specific MTF MA's label will be accommodated by a dashed line connecting it to its plot.
📈 Chart:
The chart shown in this original publication displays the 15 minute chart on BTCUSDT. Displayed on the chart are 4 MTF MAs: the 15m 20 WMA, 30m 100 EMA, 1h 11 EMA, and 1D 7 VWMA - offering an exemplary view of how you can use these MTF MAs and crosses to your advantage in gauging trend relationships across multiple timeframes.
