3-Minute RSI and EMA Crossover Strategy 3-Minute RSI and EMA Crossover Sell Strategy with Exit Conditions and Re-entry
Rata-Rata Pergerakan / Moving Averages

Robust Scaled Dema | OquantOverview
The Robust Scaled DEMA indicator is a tool designed for traders seeking to identify potential trend directions in financial markets. It combines the smoothing capabilities of a Double Exponential Moving Average (DEMA) with a robust scaling mechanism to normalize the data, making it more resilient to outliers and extreme price movements. This scaling helps in generating long and short signals based on predefined thresholds, visualized through color-coded plots and bars. The indicator aims to provide a balanced view of market momentum, reducing the impact of noise while highlighting significant shifts in price behavior.
Key Factors/Components
DEMA (Double Exponential Moving Average): Serves as the core smoothing component, reducing lag compared to simple averages by emphasizing recent price action more effectively.
Robust Scaling Mechanism: Utilizes statistical measures like median and interquartile range to normalize the DEMA values, ensuring the indicator is less sensitive to extreme values or price spikes.
Thresholds: User-defined upper and lower levels that trigger long or short signals when the scaled DEMA crosses them.
Visual Elements: Includes plotted lines for the scaled DEMA and thresholds, plus color-coded candlestick bars for intuitive interpretation.
Alerts: Built-in conditions for notifying users of potential entry points for long or short positions.
How It Works
The indicator starts by applying a DEMA to the chosen price source to create a smoothed representation of the market's direction. This smoothed value is then scaled using a robust statistical approach that accounts for the distribution of recent DEMA values, centering it around a median and adjusting for variability to minimize the influence of outliers. The resulting scaled metric is compared against user-set upper and lower thresholds: crossing above the upper suggests a bullish momentum (long signal), while dipping below the lower indicates bearish conditions (short signal). A state variable tracks these conditions to color the chart accordingly, helping traders visualize regime changes. Optional alerts fire on transitions.
For Who Is Best/Recommended Use Cases
This indicator is ideal for traders who employ trend-following or momentum-based strategies and need tools that perform well in non-normal market conditions, such as during high volatility or in assets prone to spikes. Use cases include identifying entry/exit points in trending environments, confirming breakouts, or integrating into multi-indicator systems for added confirmation. Quantitative traders or those backtesting strategies will appreciate its customizable parameters for optimization.
Settings and Default Settings
Source: The price data input for calculations, such as close, open, high, or low. Default: close.
DEMA Length: Controls the period for the DEMA smoothing; shorter values increase responsiveness but may add noise, longer ones provide more lag but smoother signals. Default: 25.
Robust Scaling Length: Defines the lookback period for the scaling statistics; affects how adaptive the normalization is to recent data distributions. Default: 40.
Upper Threshold: The level above which a long signal is triggered; higher values make signals rarer but potentially more reliable. Default: 0.5.
Lower Threshold: The level below which a short signal is triggered; lower values allow for more aggressive bearish detection. Default: 0.
Conclusion
The Robust Scaled DEMA offers an outlier-resistant alternative to traditional moving average indicators, empowering traders to navigate volatile markets. By blending exponential smoothing with statistical robustness, it provides actionable insights into trend shifts while minimizing false positives from extreme events..
⚠️ Disclaimer: This indicator is intended for educational and informational purposes only. Trading/investing involves risk, and past performance does not guarantee future results. Always test and evaluate indicators/strategies before applying them in live markets. Use at your own risk.

Dual EMA Status Table (15m & 30m)It checks whether the 9 EMA is above or below the 21 EMA on:
the 15-minute chart, and
the 30-minute chart,
and then displays their alignment in a table:
Timeframe 9 vs 21 Status
15 min 9 > 21 Bullish
30 min 9 > 21 Bullish
CONFIRM ✅ Bullish
✅ “Bullish Confirm” → 9 EMA > 21 EMA on both → uptrend bias
❌ “Bearish Confirm” → 9 EMA < 21 EMA on both → downtrend bias
⚠️ “Mixed” → 15 m and 30 m disagree → stay neutral or wait
💡 How to Use It as a Trading Signal
You can treat it as a buy/sell framework with confirmation rules:
🔹 Buy (Long) bias
Table shows ✅ Bullish confirmation
9 EMA > 21 EMA on both timeframes
Ideally, price pulls back near one of the EMAs and then bounces
You could enter after a bullish candle close above the EMAs
📍 Example entry rule:
Enter long when “✅ Bullish” appears and price closes above both EMAs on the 15 min chart.
Stop-loss below the 21 EMA or recent swing low.
🔹 Sell (Short) bias
Table shows ❌ Bearish confirmation
9 EMA < 21 EMA on both timeframes
Price retraces upward and rejects near EMAs
📍 Example entry rule:
Enter short when “❌ Bearish” appears and price closes below both EMAs on the 15 min chart.
Stop-loss above 21 EMA or recent swing high.

HTF MACD Dual Zero Cross + First EMA PullbackThis script aims to get the trader on the right side of the momentum and get better entries by only alerting when price pulls back to the trader's specified EMA.
This script isnt meant to catch tops or bottoms but to trade with the momentum once it starts.
This script will alert whe nthe MACD and signal line both cross the zero line, after that the script waits for price to make a pullback and then alet either a sell or buy. Ive found this works best when you trade with the trend on a higher timeframe.
You can use whatever MACD settings you prefer and really customize this to the asset youre trading.
You can also change whether you get an alert based on a wick touch of the EMA or a candle close.

Moving Averages DTMoving Averages Combo: SMA 30-50-100-200 + EMA 5-8-21 (Golden & Death Cross Ready)
This clean and lightweight indicator plots the most used simple and exponential moving averages in one single script — perfect for swing traders, position traders, and scalpers.
— Simple Moving Averages (Daily timeframe focus):
• SMA 30 (Red) — Early trend detection
• SMA 50 (Blue) — Classic medium-term trend
• SMA 100 (Green) — Institutional reference
• SMA 200 (Orange) — The legendary Golden/Death Cross line
— Fast Exponential Moving Averages (Perfect for pullbacks & entries):
• EMA 5 (Purple) — Ultra-fast reaction
• EMA 8 (Yellow) — Fibonacci-based favorite
• EMA 21 (Black) — 21-day cycle + Fibonacci
Why this combination works so well:
• EMA 8 + EMA 21 = Powerful short-term trend filter (used by thousands of crypto & forex traders)
• SMA 50/200 = Classic Golden & Death Cross signals
• SMA 30/100 = Extra confirmation layers used by banks and funds
Features:
✓ All MAs on a single indicator (no chart clutter)
✓ Clean colors with perfect contrast on light/dark themes
✓ Ready for alerts: set alert on EMA 8 crossing EMA 21 or SMA 50 crossing SMA 200
✓ Works on all markets & timeframes (stocks, forex, crypto, futures)
How to use:
• Bullish signal: Price above SMA 200 + EMA 8 > EMA 21 + SMA 50 > SMA 200
• Bearish signal: Price below SMA 200 + EMA 8 < EMA 21
• Pullback entries: Wait for price to touch EMA 21 in uptrend
BCM Trend Map Pro v3BCM Trend Map Pro v3
Visual trend detection and cycle confirmation system.
The BCM Trend Map is a trend-following and momentum-confirmation indicator designed to clearly detect trend transitions with minimal noise.
It combines a dynamic EMA Ribbon with optional RSI filtering and confirmation logic to reduce false signals, offering a clean, reliable read of market structure and momentum shifts.

SD Levels + EMASD Levels + EMA
Overview:
The SD Levels + EMA indicator combines volatility-based standard deviation levels with dual EMA signals to help traders identify potential breakout zones, overextended regions, and trend shifts. It overlays key market structure levels directly on the chart, giving a clear visual roadmap of intraday and daily strength zones.
🧠 Core Features
1. Standard Deviation Levels (SD Module)
Calculates volatility using annualized standard deviation from the selected source (hlc3 by default).
Automatically plots:
Settlement level
±0.33 SD, ±0.66 SD, ±1 SD, ±1.33 SD, ±1.66 SD, ±2 SD bands
Optionally displays:
Previous day’s high/low
Current day’s running high/low
These levels help spot volatility extremes, mean reversion zones, and breakout potential.
2. EMA Module
Plots two customizable EMAs (default = 5 and 10 periods).
Highlights bullish/bearish crossovers with clear up/down triangles.
Generates alerts for crossover events.
Includes an optional $-spaced grid (default $25) with user-defined levels above and below current price.
3. Visual & Utility Options
Optional info table showing:
Current Price
EMA 5
EMA 10
Real-time trend direction (Bullish ↑, Bearish ↓, Neutral)
Lightweight, non-repainting logic optimized for intraday timeframes.
User-friendly inputs to toggle each module independently.
⚙️ Recommended Use
Combine SD zones with EMA crossovers to confirm volatility-based breakouts or fade reversions near extremes.
The extended ±SD ladder helps traders map confluence areas between volatility expansion and EMA momentum.
🛠 Customization
Adjust SD sensitivity via level toggles and settlement source.
Modify grid spacing, number of levels, and EMA periods.
Enable/disable tables, labels, and individual components to match your charting style.
📢 Alerts
🔔 Bullish EMA Cross: EMA 5 crosses above EMA 10
🔔 Bearish EMA Cross: EMA 5 crosses below EMA 10
⚡ Summary
A hybrid indicator that merges volatility-based structure (SD levels) with trend-based momentum (EMA crosses)—ideal for traders who want to visualize both mean-reversion zones and trend continuation opportunities within a single tool.

Daily MA — Higher-Timeframe Daily Moving Average OverlayThis indicator plots a clean, higher-timeframe daily moving average directly on any chart, so you can always see where price sits relative to the daily trend — even while trading on lower timeframes (1m, 5m, etc.).
It’s designed to be:
Simple – a single, configurable daily MA line
Consistent – always anchored to the 1D timeframe
Flexible – choose EMA or SMA and customize line width/color
⸻
What This Indicator Does
Pulls the 1-Day (1D) moving average of the current symbol, regardless of your chart timeframe.
Lets you choose between EMA (Exponential Moving Average) or SMA (Simple Moving Average).
Plots that daily MA as a smooth overlay on your current chart.
Keeps the line visually clean and continuous, making it easy to see daily trend and dynamic support/resistance.
This is not a signals/strategy script. It doesn’t generate buy/sell arrows or backtest logic. It’s a context tool for visualizing the daily trend while you execute your own strategy.
⸻
Why a Daily MA Overlay Is Useful
Traders commonly use a daily moving average to:
Anchor intraday trades to the higher-timeframe trend
Longs when price is holding above the Daily MA
Shorts or caution when price is rejecting from the Daily MA
Identify dynamic support/resistance
Price often reacts around well-watched daily MAs (e.g., 50, 100, 200)
Filter setups
Only take long setups when price is above the daily trend line
Avoid counter-trend trades when price is extended far from the Daily MA
Because this script forces the MA to always be computed on 1D, you don’t have to switch back and forth between intraday and daily charts to keep track of the bigger picture.
⸻
Inputs & Settings
MA Length
Default: 200
Any positive integer (min 1)
Common examples: 50, 100, 200 for trend structure
MA Type
EMA – reacts faster to recent price (default)
SMA – smoother, slower, more “classic” feel
Line Width
Default: 2
Range: 1 to 10
Increase if you want the Daily MA to stand out clearly against other indicators
Color
Default: Purple tone
Fully customizable – pick any color that works with your chart theme
⸻
How to Use It in Your Workflow
Intraday traders (scalpers/day-traders):
Apply the indicator to your 1m/5m/15m charts.
Use the Daily MA as a trend filter :
Only look for long scalps when price is above the Daily MA.
Be more cautious with longs or consider shorts when price is below it.
Swing traders :
Use it on 1H/4H charts to see where price sits relative to a longer-term daily trend.
Watch for:
Pullbacks to the Daily MA in an uptrend as potential demand zones.
Rejections at the Daily MA in a downtrend as potential supply zones.
Risk management & context :
Avoid chasing extended moves far from the Daily MA.
Mark confluence with other tools (support/resistance, volume profile, etc.) around the Daily MA.
⸻
Notes & Limitations
The moving average itself is calculated from daily candles , then displayed on your current timeframe.
This is a visual aid only . It does not guarantee future performance or provide financial advice.
Always combine this indicator with your own analysis, risk management, and trading plan.
⸻
Disclaimer :
This script is provided for educational and informational purposes only. It is not financial advice and does not constitute a recommendation to buy or sell any financial instrument. Always do your own research and trade at your own risk.

QQQ TimingThis is a trend-following position trading strategy designed for the QQQ and the leveraged ETF QLD (ProShares Ultra QQQ). The primary goal is to capture multi-month holds for maximal profit.
Key Instruments & Performance
The strategy performs best with QLD, which yields far superior results compared to QQQ.
TQQQ (triple-leveraged) results in higher drawdowns and is not the optimal choice.
Important: The system is not intended for use with other indexes, individual stocks, or investments (like crypto or gold), as performance can vary widely.
Buy Signals
The strategy's signals are rooted in the S&P 500 Index (SPX), as testing showed it provides more reliable triggers than using QQQ itself.
Primary Buy Signal (Credit to IBD/Mike Webster): The SPX triggers a buy when its low closes above the 21-day Exponential Moving Average (EMA) for three consecutive days.
Refinement with Downtrend Lines: During corrective or bear periods, results and drawdowns can be significantly improved by incorporating downtrend lines. These lines connect lower highs. The strategy waits for the price to close above a drawn downtrend line before executing a buy. This refinement can modify the primary signal, either by allowing for an earlier entry or, in some cases, completely nullifying a false signal until the trend change proves itself.
Risk Management & Exit Strategy
Initial Buy Risk: A 3.7% stop loss is applied immediately upon the initial entry.
Initial Exit Rule: An exit is required if the QQQ's low drops below the 50-day Simple Moving Average (SMA).
Note: The 3.7% stop often provides protection when the initial buy occurs below the 50-day SMA. However, if QQQ is already trading above its 50-day SMA at the time of the SPX signal (indicating relative strength), historically, it has been better to use the 50-day SMA rule to give the position more room to run.
Trend Exit (Profit-Taking): To stay in a strong trend for the optimal amount of time, the long position is exited when a moving average crossover to the downside is triggered, based around the 107-day Simple Moving Average (SMA).

RastaRasta — Educational Strategy (Pine v5)
Momentum · Smoothing · Trend Study
Overview
The Rasta Strategy is a visual and educational framework designed to help traders study momentum transitions using the interaction between a fast-reacting EMA line and a slower smoothed reference line.
It is not a signal generator or profit system; it’s a learning tool for understanding how smoothing, crossovers, and filters interact under different market conditions.
The script displays:
A primary EMA line (the fast reactive wave).
A Smoothed line (using your chosen smoothing method).
Optional fog zones between them for quick visual context.
Optional DNA rungs connecting both lines to illustrate volatility compression and expansion.
Optional EMA 8 / EMA 21 trend filter to observe higher-time-frame alignment.
Core Idea
The Rasta model focuses on wave interaction. When the fast EMA crosses above the smoothed line, it reflects a shift in short-term momentum relative to background trend pressure. Cross-unders suggest weakening or reversal.
Rather than treating this as a trading “signal,” use it to observe structure, study trend alignment, and test how smoothing type affects reaction speed.
Smoothing Types Explained
The script lets you experiment with multiple smoothing techniques:
Type Description Use Case
SMA (Simple Moving Average) Arithmetic mean of the last n values. Smooth and steady, but slower. Trend-following studies; filters noise on higher time frames.
EMA (Exponential Moving Average) Weights recent data more. Responds faster to new price action. Momentum or reactive strategies; quick shifts and reversals.
RMA (Relative Moving Average) Used internally by RSI; smooths exponentially but slower than EMA. Momentum confirmation; balanced response.
WMA (Weighted Moving Average) Linear weights emphasizing the most recent data strongly. Intraday scalping; crisp but potentially noisy.
None Disables smoothing; uses the EMA line alone. Raw comparison baseline.
Each smoothing method changes how early or late the strategy reacts:
Faster smoothing (EMA/WMA) = more responsive, good for scalping.
Slower smoothing (SMA/RMA) = more stable, good for trend following.
Modes of Study
🔹 Scalper Mode
Use short EMA lengths (e.g., 3–5) and fast smoothing (EMA or WMA).
Focus on 1 min – 15 min charts.
Watch how quick crossovers appear near local tops/bottoms.
Fog and rung compression reveal volatility contraction before bursts.
Goal: study short-term rhythm and liquidity pulses.
🔹 Momentum Mode
Use moderate EMA (5–9) and RMA smoothing.
Ideal for 1 H–4 H charts.
Observe how the fog color aligns with trend shifts.
EMA 8 / 21 filter can act as macro bias; “Enter” labels will appear only in its direction when enabled.
Goal: study sustained motion between pullbacks and acceleration waves.
🔹 Trend-Follower Mode
Use longer EMA (13–21) with SMA smoothing.
Great for daily/weekly charts.
Focus on periods where fog stays unbroken for long stretches — these illustrate clear trend dominance.
Watch rung spacing: tight clusters often precede consolidations; wide rungs signal expanding volatility.
Goal: visualize slow-motion trend transitions and filter whipsaw conditions.
Components
EMA Line (Red): Fast-reacting short-term direction.
Smoothed Line (Yellow): Reference trend baseline.
Fog Zone: Green when EMA > Smoothed (up-momentum), red when below.
DNA Rungs: Thin connectors showing volatility structure.
EMA 8 / 21 Filter (optional):
When enabled, the strategy will only allow Enter events if EMA 8 > EMA 21.
Use this to study higher-trend gating effects.
Educational Applications
Momentum Visualization: Observe how the fast EMA “breathes” around the smoothed baseline.
Trend Transitions: Compare different smoothing types to see how early or late reversals are detected.
Noise Filtering: Experiment with fog opacity and smoothing lengths to understand trade-off between responsiveness and stability.
Risk Concept Simulation: Includes a simple fixed stop-loss parameter (default 13%) for educational demonstrations of position management in the Strategy Tester.
How to Use
Add to Chart → “Strategy.”
Works on any timeframe and instrument.
Adjust Parameters:
Length: base EMA speed.
Smoothing Type: choose SMA, EMA, RMA, or WMA.
Smoothing Length: controls delay and smoothness.
EMA 8 / 21 Filter: toggles trend gating.
Fog & Rungs: visual study options only.
Study Behavior:
Use Strategy Tester → List of Trades for entry/exit context.
Observe how different smoothing types affect early vs. late “Enter” points.
Compare trend periods vs. ranging periods to evaluate efficiency.
Combine with External Tools:
Overlay RSI, MACD, or Volume for deeper correlation analysis.
Use replay mode to visualize crossovers in live sequence.
Interpreting the Labels
Enter: Marks where fast EMA crosses above the smoothed line (or when filter flips positive).
Exit: Marks where fast EMA crosses back below.
These are purely analytical markers — they do not represent trade advice.
Educational Value
The Rasta framework helps learners explore:
Reaction time differences between moving-average algorithms.
Impact of smoothing on signal clarity.
Interaction of local and global trends.
Visualization of volatility contraction (tight DNA rungs) and expansion (wide fog zones).
It’s a sandbox for studying price structure, not a promise of profit.
Disclaimer
This script is provided for educational and research purposes only.
It does not constitute financial advice, trading signals, or performance guarantees. Past market behavior does not predict future outcomes.
Users are encouraged to experiment responsibly, record observations, and develop their own understanding of price behavior.
Author: Michael Culpepper (mikeyc747)
License: Educational / Open for study and modification with credit.
Philosophy:
“Learning the rhythm of the market is more valuable than chasing its profits.” — Rasta

Trend Meter [MMT]The Trend Meter is a dynamic Pine Script indicator designed to provide traders with a clear, multi-dimensional view of market trends and momentum across different timeframes and metrics. By integrating Exponential Moving Averages (EMAs), Volume-Weighted Average Price (VWAP), higher timeframe (HTF) analysis, and Regular Trading Hours (RTH) breakouts, this indicator offers a comprehensive tool for identifying bullish, bearish, or neutral market conditions. Its customizable visual display and label system make it ideal for traders seeking actionable insights for trend-following, breakout, or reversal strategies.
Key Features:
1. Multi-Metric Trend Analysis:
- Trend Meter : Compares a Fast EMA (default: 9) and Slow EMA (default: 21) to determine short-term trend direction.
- Bias Meter : Uses a longer-term Bias EMA (default: 35) to assess the overall market bias based on the close price.
- VWAP Meter : Evaluates price position relative to the VWAP for dynamic support/resistance insights.
- HTF Meter : Analyzes higher timeframe (default: 60-minute) price action, detecting breakouts of previous highs/lows and candle direction.
- RTH Meter : Tracks price breakouts above/below the US Regular Trading Hours (09:30–16:00 EST) 15m opening range (09:30–09:45 EST).
2. Color-Coded Visuals:
- Each metric is displayed as a horizontal line with customizable colors (green for bullish, red for bearish, gray for neutral).
- Visual style options (dotted, dashed, or solid lines) allow for personalized chart clarity.
3. Dynamic Labels:
- Optional labels for each metric (Trend, Bias, VWAP, HTF, RTH) with customizable text, size (tiny to huge), and color.
- Labels update in real-time, providing clear identification of each meter’s role and current state.
4. Flexible Metric Selection:
- Toggle individual metrics (EMA, VWAP, HTF, RTH) on/off to focus on relevant indicators for your trading style.
- Option to use the previous bar’s close price for calculations, reducing noise in volatile markets.
5. RTH and Opening Range Analysis:
- Calculates the high/low of the opening range (09:30–09:45 EST) during RTH sessions.
- Signals bullish or bearish conditions when the price breaks above/below the opening range outside the initial 15-minute window.
6. Higher Timeframe Breakout Detection:
- Monitors HTF price action to identify breakouts of the previous candle’s high or low, combined with the HTF candle’s direction for trend confirmation.
How to Use:
- Trend Confirmation : Use the Trend and Bias Meters to confirm short-term and long-term market direction.
- Breakout Trading : Leverage the RTH Meter for breakout setups above/below the opening range during US trading hours.
- Support/Resistance : Utilize the VWAP Meter to identify dynamic price levels for entries or exits.
- Higher Timeframe Context : Monitor the HTF Meter for broader market trend alignment, ideal for swing or position trading.
- Customization : Adjust EMA lengths, toggle metrics, and customize visual styles and labels to suit your chart preferences.
Settings:
- Bias Settings :
- Fast EMA (default: 9), Slow EMA (default: 21), Bias EMA (default: 35).
- Higher Timeframe (default: 60-minute).
- Option to use previous close price for calculations.
- Enable/disable individual metrics (EMA, VWAP, HTF, RTH).
- Visual Settings :
- Bullish (green), bearish (red), and neutral (gray) colors.
- Line style (dotted, dashed, solid).
- Label Settings :
- Enable/disable labels.
- Customize label size (tiny, small, normal, large, huge) and text color.
- Custom text for each meter’s label (Trend, Bias, VWAP, HTF, RTH).
Notes:
- Optimized for intraday trading (e.g., 1m, 5m, 15m) but adaptable to any timeframe.
- RTH and opening range calculations are tailored for US markets (EST timezone); adjust session times in the code for other markets.
- Higher timeframe analysis enhances context for multi-timeframe strategies.
Ideal For:
- Intraday traders targeting RTH breakout opportunities.
- Swing traders aligning with higher timeframe trends.
- Traders using VWAP and EMA-based strategies for trend and momentum analysis.
- Those seeking a clean, customizable dashboard for multi-metric market analysis.

3 EMAs CustomizablesIt consists of 3 EMAs, each of which can be customized — you can change colors, thickness, and periods according to your trading strategy to save space on the indicators.
Trend Engine [MMT]The Trend Engine is a versatile Pine Script indicator designed to identify trend direction, potential reversals, and key price levels using a combination of Exponential Moving Averages (EMAs), and Anchored Volume-Weighted Average Price (VWAP). This indicator provides traders with a clear visual representation of market bias, momentum, and key support/resistance levels, making it suitable for both trend-following and pullback trading strategies.
Key Features:
1. EMA Cloud System:
- Displays three customizable EMAs (Fast, Pullback, and Slow) with configurable lengths and visibility.
- Creates two cloud fills:
- Fast Cloud : Between the Fast EMA (default: 8) and Pullback EMA (default: 13).
- Slow Cloud : Between the Pullback EMA and Slow EMA (default: 21).
- Clouds are color-coded (green for bullish, red for bearish) based on EMA alignment, with adjustable transparency for clarity.
2. Bias EMA:
- A longer-term EMA (default: 35) indicates the overall market bias.
- Changes color based on whether the regular candle close is above (green) or below (red) the Bias EMA, providing a clear trend direction signal.
3. Heikin Ashi Signals:
- Utilizes Heikin Ashi candles to detect strong bullish or bearish momentum.
- Generates buy/sell signals when a Heikin Ashi candle confirms a trend (bullish HA candle closing above Bias EMA for buy, bearish HA candle closing below for sell).
- Signal arrows are currently disabled but can be enabled via settings for visual confirmation.
4. Anchored VWAP and Standard VWAP:
- Plots both a standard VWAP and an Anchored VWAP (anchored to the US RTH session, 09:30–16:00 EST).
- Customizable line styles (solid, cross, or circles) and colors for both VWAPs, aiding in identifying dynamic support/resistance levels.
5. Background and Candle Coloring:
- Optional background coloring reflects the market bias (green for bullish, red for bearish) based on the regular close relative to the Bias EMA.
- Optional Heikin Ashi candle coloring to visually distinguish bullish and bearish market conditions.
6. Regular Candle Close:
- Option to plot the regular (non-Heikin Ashi) close price with customizable styles (line, circles, or cross) for reference.
7. Alerts:
- Built-in alert conditions for bullish and bearish signals, allowing traders to receive notifications when a Heikin Ashi candle confirms a trend relative to the Bias EMA.
How to Use:
- Trend Identification : Use the Bias EMA and background color to determine the overall market direction.
- Pullback Trading : Monitor the EMA clouds for alignment (bullish or bearish) and use the Pullback EMA for entries during retracements.
- Support/Resistance : Leverage the VWAP and Anchored VWAP as dynamic levels for trade entries or exits.
- Signal Confirmation : Enable signal arrows (when fixed) to spot high-probability trend continuation or reversal setups.
- Customization : Adjust EMA lengths, colors, transparency, and visibility to suit your trading style and timeframe.
Settings:
- EMA Cloud : Customize lengths (default: 8, 13, 21), visibility, and cloud colors/transparency.
- Bias EMA : Adjust length (default: 35) and colors for above/below states.
- VWAP : Toggle standard and Anchored VWAP, with customizable styles and colors.
- Background/Candles : Enable/disable background and candle coloring for visual clarity.
- Regular Close : Show/hide the regular close price with style options.
Notes:
- Designed for use on any timeframe, but most effective on intraday (e.g., 5m, 15m) or daily charts.
- Best used in conjunction with other technical analysis tools for confirmation.
- Anchored VWAP is tailored for US markets (RTH session) but can be adjusted for other sessions by modifying the anchor time in the code.
Ideal For:
- Day traders and swing traders looking for trend direction and pullback opportunities.
- Traders using VWAP-based strategies for intraday support/resistance.
- Those seeking a clean, customizable visual aid for market bias and momentum.
This indicator is a powerful tool for traders aiming to capture trends and manage risk effectively, with extensive customization to adapt to various markets and trading styles.

50 Week MAThis script plots the true 50-week simple moving average (SMA) derived directly from the weekly timeframe, ensuring accuracy across all chart intervals.
It allows you to visualise the long-term trend regardless of whether you’re viewing a 1-day, 4-hour, or 1-minute chart.
Commonly used by swing traders and long-term investors, the 50-week MA helps identify macro trend direction, dynamic support and resistance zones, and major cycle shifts in price behaviour.

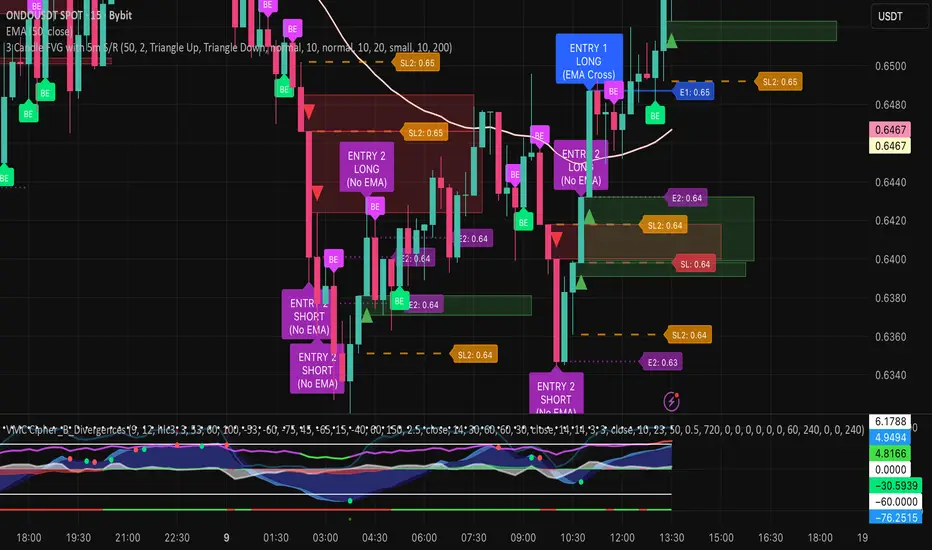
3 Candle FVG with 5m S/R3 candle breakout indicator.
Shows EMA 50.
Shows Support and Resistance from the 5m chart on every timeframe.
Indicates every engulfing candle.
Indicates entry at 3 consecutive candles in the same direction where the middle candle has an FVG and it crosses the EMA.
Indicates entry at 3 consecutive candles in the same direction where the middle candle has an FVG and it does not cross the EMA.
EMA + RSI Autotrade Webhook - VarunOverview
The EMA + RSI Autotrade Webhook is a powerful trend-following indicator designed for automated crypto futures trading. This indicator combines the reliability of Exponential Moving Average (EMA) crossovers with RSI momentum filtering to generate high-probability buy and sell signals optimized for webhook integration with crypto exchanges like Delta Exchange, Binance Futures, and Bybit.Key Features
Simple & Effective: Uses proven EMA 9/21 crossover strategy
RSI Momentum Filter: Eliminates low-probability trades in ranging markets
Webhook Ready: Two clean alerts (LONG Entry, SHORT Entry) for seamless automation
Exchange Compatible: Works with Delta Exchange, 3Commas, Alertatron, and other webhook platforms
Zero Lag Signals: Real-time alerts on crossover confirmation
Visual Clarity: Clean chart markers for easy signal identification
How It Works
Entry Signals:
LONG Entry: Triggers when EMA 9 crosses above EMA 21 AND RSI is above 52 (bullish momentum confirmed)
SHORT Entry: Triggers when EMA 9 crosses under EMA 21 AND RSI is below 48 (bearish momentum confirmed)
Technical Components:
Fast EMA: 9-period (tracks short-term price action)
Slow EMA: 21-period (identifies primary trend)
RSI: 14-period (confirms momentum strength)
RSI Long Threshold: 52 (filters weak bullish signals)
RSI Short Threshold: 48 (filters weak bearish signals)
Best Use Cases
Crypto Futures Trading: Bitcoin, Ethereum, Altcoin perpetual contracts
Automated Trading Bots: Integration with Delta Exchange webhooks, TradingView alerts
Timeframes: Optimized for 15-minute charts (works on 5min-1H)
Markets: Trending crypto markets with clear directional moves
Risk Management: Best used with 1-2% stop loss per trade (managed externally)
Webhook Automation Setup
Add indicator to your TradingView chart
Create alerts for "LONG Entry" and "SHORT Entry"
Configure webhook URL from your exchange (Delta Exchange, Binance, etc.)
Use alert message: Entry LONG {{ticker}} @ {{close}} or Entry SHORT {{ticker}} @ {{close}}
Exchange automatically reverses positions on opposite signals
Advantages
✅ No manual trading required - fully automated
✅ Eliminates emotional trading decisions
✅ Catches trending moves early with EMA crossovers
✅ RSI filter reduces whipsaws in choppy markets
✅ Works 24/7 without monitoring
✅ Simple two-alert system (easy to manage)
✅ Compatible with multiple exchanges via webhooksStrategy Philosophy
This indicator follows a trend-following with momentum confirmation approach. By waiting for both EMA crossover AND RSI confirmation, it ensures you're entering trades with genuine momentum behind them, not just random price noise. The tight RSI thresholds (52/48) keep you aligned with the prevailing trend.Recommended Settings
Timeframe: 15-minute (primary), 5-minute (scalping), 1-hour (swing)
Markets: BTC/USDT, ETH/USDT, high-liquidity altcoin perpetuals
Position Sizing: 100% capital per signal (exchange manages reversals)
Stop Loss: 2% (managed via exchange or external bot)
Leverage: 1-2x for conservative approach, up to 5x for aggressive
Important Notes
⚠️ This indicator generates entry signals only - position reversals are handled automatically by your exchange
⚠️ Always backtest on historical data before live trading
⚠️ Use proper risk management and position sizing
⚠️ Best performance in trending markets; may generate false signals in tight ranges
⚠️ Requires TradingView Premium or higher for webhook functionalityTags
cryptocurrency futures automated-trading ema-crossover rsi webhook delta-exchange tradingview-alerts trend-following momentum bitcoin ethereum crypto-bot algo-trading 15-minute-strategy
