NQ BB+PS StrategyBollinger Band and ProScalper combined strategy/indicators. Designed to take quick 1:1 Risk to Reward trades. Entry on close of signal bar, set auto SL and TP levels to 50 ticks. If a signal in the opposing direction populates, close open trade and follow current signal or simply reverse positions. There is a "+" Sign above signals that fire in the direction of the current EMA trend signaling an A+ set up. Recommended following the first 4-6 signals of the day prior to 11am before the mid day "chop".
Rata-Rata Pergerakan / Moving Averages

[SM-021] Gaussian Trend System [Optimized]This script is a comprehensive trend-following strategy centered around a Gaussian Channel. It is designed to capture significant market movements while filtering out noise during consolidation phases. This version (v2) introduces code optimizations using Pine Script v6 Arrays and a new Intraday Time Control feature.
1. Core Methodology & Math
The foundation of this strategy is the Gaussian Filter, originally conceptualized by @DonovanWall.
Gaussian Poles: Unlike standard moving averages (SMA/EMA), this filter uses "poles" (referencing signal processing logic) to reduce lag while maintaining smoothness.
Array Optimization: In this specific iteration, the f_pole function has been refactored to utilize Pine Script Arrays. This improves calculation efficiency and rendering speed compared to recursive variable calls, especially when calculating deep historical data.
Channel Logic: The strategy calculates a "Filtered True Range" to create High and Low bands around the main Gaussian line.
Long Entry: Price closes above the High Band.
Short Entry: Price closes below the Low Band.
2. Signal Filtering (Confluence)
To reduce false signals common in trend-following systems, the strategy employs a "confluence" approach using three additional layers:
Baseline Filter: A 200-period (customizable) EMA or SMA acts as a regime filter. Longs are only taken above the baseline; Shorts only below.
ADX Filter (Volatility): The Average Directional Index (ADX) is used to measure trend strength. If the ADX is below a user-defined threshold (default: 20), the market is considered "choppy," and new entries are blocked.
Momentum Check: A Stochastic RSI check ensures that momentum aligns with the breakout direction.
3. NEW: Intraday Session Filter
Per user requests, a time-based filter has been added to restrict trading activity to specific market sessions (e.g., the New York Open).
How it works: Users can toggle a checkbox to enable/disable the filter.
Configuration: You can define a specific time range (Default: 09:30 - 16:00) and a specific Timezone (Default: New York).
Logic: The strategy longCondition and shortCondition now check if the current bar's timestamp falls within this window. If outside the window, no new entries are generated, though existing trades are managed normally.
4. Risk Management
The strategy relies on volatility-based exits rather than fixed percentage stops:
ATR Stop Loss: A multiple of the Average True Range (ATR) is calculated at the moment of entry to set a dynamic Stop Loss.
ATR Take Profit: An optional Reward-to-Risk (RR) ratio can be set to place a Take Profit target relative to the Stop Loss distance.
Band Exit: If the trend reverses and price crosses the opposite band, the trade is closed immediately to prevent large drawdowns.
Credits & Attribution
Original Gaussian Logic: Developed by @DonovanWalll. This script utilizes his mathematical formula for the pole filters.
Strategy Wrapper & Array Refactor: Developed by @sebamarghella.
Community Request: The Intraday Session Filter was added to assist traders focusing on specific liquidity windows.
Disclaimer: This strategy is for educational purposes. Past performance is not indicative of future results. Please use the settings menu to adjust the Session Time and Risk parameters to fit your specific asset class.

Hammer/Inv Hammer + ema and other settings + stratok, so thrown everything at this one as the previous only had longs.
so we have all the options, but main feature is the ema to divide up the longs and short, shorts above, longs below, we all know price ends up back to the ema at some point.
I have added a volume filter, this calculates the average volume from the last "20" candles (which can be adjusted) then when a hammer appears it has to be larger than the average volume to be valid.
Also added trading hours in, if you are switching between RTH and ETH it can cause issue if it enters a position EOD then you get an anomaly trade as we can hold positions past certain times.
Also added some trading strategy, so after 2 wins it wont trade again that day or after 1 loss. you decide.
So much to play with now.

Sinals 15m - RSI 7 e 9This strategy is designed to capture continuation moves on the 15-minute chart by combining trend filters, momentum indicators, and strong-candle confirmation. The core idea is to enter trades shortly after EMA crossovers that signal direction, as long as momentum and candle strength support the move.

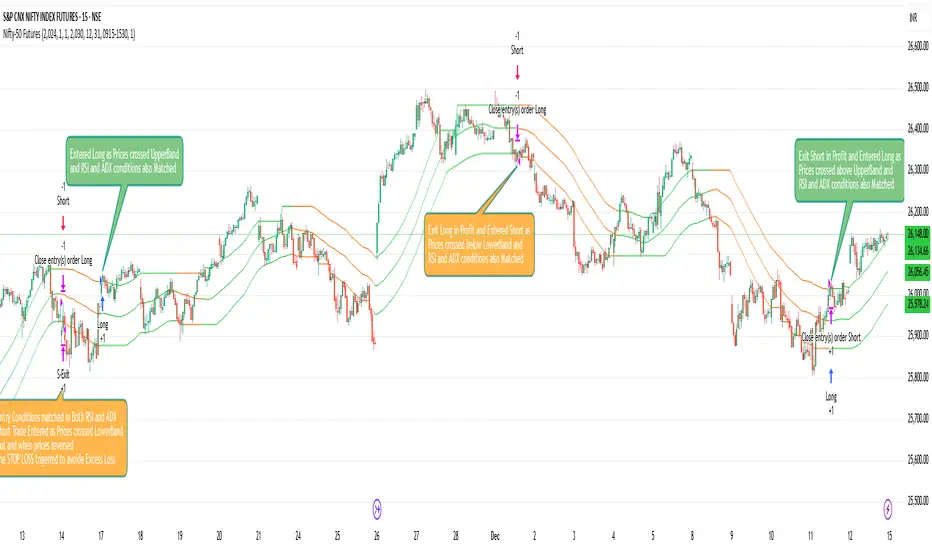
Nifty-50 Futures Trading Ideas/ Strategyb]Nifty-50 Futures Trading Ideas is a trend-following strategy designed for study and backtesting .
The strategy identifies directional bias using a structured price-based approach and applies ADX + DI and RSI filters to validate trend strength.
It includes inbuilt risk-management logic such as Stop-Loss, Take-Profit, ATR-based exits, separate maximum loss per trade (₹) for long and short positions, and optional date/session filters.
This script is provided for educational and analytical purposes only and is not a trading signal or investment recommendation.
Velocity SwingtraderThe intended objective of this indicator to gauge trend and momentum and find trades that are at the beginning of a trend change for longer periods of time (days, weeks, months).

ALASMAR NewVersionThis my NewVersion of my startegy. any notification you all welcome
best regards,
Alasmar

New ALASMARThis is an update version of my strategy. You all are welcome for any notifications.
best regards,
Alasmar

Scalping EMA + Pinbar Strategy (London & NY only, BE @ 1R)The scalping trading system uses two types of indicators:
EMA 10, EMA 21, EMA 50
Pinbar Indicator
Rules for entering a buy order:
If the closing price is above the EMA 50, the trend is uptrend and only buy orders should be considered.
The EMA 10 and EMA 21 lines must simultaneously be above the EMA 50.
The price must correct down at least 50% of the area created by the EMA 10 and EMA 21, or correct further down.
A Type 1 Pinbar candle (marked by the Pinbar indicator) must appear; this Pinbar candle must react to at least one of the three EMA lines (EMA 10, EMA 21, EMA 50) and close above the EMA 50.
This Pinbar candle must have a Pinbar strength value (marked by the Pinbar indicator) less than 2 to be considered valid. Check if the closing price of this pinbar candle is higher than the 50-day EMA and if the 10-day and 21-day EMAs are also higher than the 50-day EMA. If so, the conditions have been met and you can begin trading.
Place a buy stop order 0.1 pip higher than the highest price of the pinbar candle, and a stop loss order 0.1 pip lower than the lowest price of the pinbar candle. Set the take profit at 3R.
If the price moves past the previously set stop loss, cancel the pending order.
When the price moves 1R, move the stop loss back to the entry point.
The next trade can only be executed after the previous trade has moved the stop loss back to the entry point.
Rules for placing sell orders:
If the closing price is below the 50-day EMA, the trend is bearish, and only sell orders should be considered. The 10-day and 21-day EMAs must both be below the 50-day EMA.
The price must correct downwards by at least 50% of the area formed by the 10-day and 21-day EMAs, or even further.
A Type 1 pinbar candle (marked by the Pinbar indicator) must appear. This pinbar candle must react to at least one of the three EMAs (EMA 10, EMA 21, EMA 50) and close below the EMA 50.
This pinbar is valid if its strength (indicated by the Pinbar indicator) is less than 2. Verify that the closing price of this pinbar candle is below the EMA 50 and that both the EMA 10 and EMA 21 are below the EMA 50. If all conditions are met, the trade can be executed.
(This appears to be a separate entry rule and not part of the previous text.) Place a sell stop order 0.1 pip below the lowest point of the pinbar candle, and a stop loss order 0.1 pip above the highest point of the pinbar candle. Set the take profit point at 3R.
If the price moves past the previously set stop-loss point, cancel the pending order.
When the price moves 1R, move the stop-loss point back to the entry point.
The next trade can only be executed after the previous trade has moved the stop-loss point back to the entry point.

AlphaGen ME V.15.12AlphaGen ME V.15.10 is an ATR-based trend-following strategy with dynamic trailing stops and EMA filter, designed for automated Crypto perpetual trading.
Core Logic:
• ATR Trailing Stops: Dynamically adjusts stop-loss using ATR(10) × 3.0 multiplier
• 200 EMA Trend Filter: Optional Only takes longs above EMA, shorts below EMA
• Reversal System: Flips positions when trend changes (filter-aware)
• MACD Acceleration Exit: Optional momentum-based profit taking
Position Sizing Modes:
• Simple % of Equity (default 90%) - Safe leverage control
• Risk % of Equity - Fixed risk per trade
• Fixed Contract Size - Consistent lot sizing
Webhook Integration:
Routes signals directly to AlphaGen-AI for execution on:
• Hyperliquid DEX
• AsterDEX
Requirements:
• AlphaGen-AI Pro subscription for webhook routing
• Hyperliquid or AsterDEX Wallets
• TradingView alerts configured with passphrase
Risk Disclosure: Trading involves substantial risk. Past performance does not guarantee future results. Only trade with capital you can afford to lose.

EMA + ATR Semi-Auto strategy -Kohei Matsumura-EMAとATRを自動調節するストラテジー
This is an EMA- and ATR-based trading strategy that adapts its parameters according to recent market behavior and performance characteristics.
The strategy dynamically adjusts trend sensitivity and risk management settings to maintain robustness across varying market conditions, while operating strictly on confirmed price data.

FluxMA ProFluxMA – Mechanical Moving Average Strategy with Risk Control
FluxMA is a backtesting strategy based on price breaking through a configurable moving average. Its purpose is to provide a simple, transparent, and flexible framework to study a trend-following system with clear entries, predefined Stop Loss and Take Profit levels, and no martingale, no grid, and no hidden logic.
This strategy is intended for traders who want to analyze data objectively, test risk management ideas, and explore different moving average, time, and weekday configurations within the TradingView environment.
Core Strategy Logic
The core logic of FluxMA is driven by the relationship between the close price and a configurable moving average:
A moving average is calculated on the close price (SMA, EMA, WMA, or RMA).
When a bar closes above the moving average, a long (buy) signal is generated.
When a bar closes below the moving average, a short (sell) signal is generated.
Trades are simulated at the open of the next bar, avoiding any repainting of signals on the current bar.
At all times, the strategy keeps at most one open position (no pyramiding).
There are no complex patterns or hidden conditions: everything is centered on the clean break of price relative to the moving average.
Main Parameters
FluxMA includes several parameters so you can adapt the behavior of the strategy to the instrument and your preferred style:
Moving Average
Moving average type: SMA, EMA, WMA, or RMA.
Moving average period: fully configurable, so you can make it faster or slower depending on timeframe and instrument.
Basic SL/TP Management
Stop Loss (SL) set at a fixed price distance.
Take Profit (TP) set at a fixed price distance.
The risk–reward ratio is defined by the combination of SL and TP settings.
Trading Filters
Time filter: define a start time and end time for trading to limit the strategy to specific intraday sessions.
Day-of-week filter: choose which days (Monday–Sunday) are allowed to trade.
Direction filter:
Longs only.
Shorts only.
Both directions.
“One trade per day” option: after the first trade of the day, all further signals for that day are ignored.
Suggested Use and Best Practices
FluxMA is meant to be a prototyping and analysis tool, not a ready-made “plug-and-play” system. Some ideas for how to use it:
Test different timeframes (e.g., M5, M15, H1) and see how performance changes as you adjust the moving average speed and the time horizon.
Tune the moving average type and period to study smoother vs. more aggressive trend behavior.
Analyze the impact of the time filter: only European session, only US session, or narrower windows.
Turn specific weekdays on/off to identify which days tend to behave better for each instrument.
Use this strategy as a base layer and later add your own filters (higher timeframe trend, volatility filters, etc.) within TradingView’s testing environment.
It’s a good idea to combine backtest results with manual chart review, especially in highly volatile periods and around major trend reversals.
Disclaimer and Limitations
FluxMA does not use martingale, grid, averaging down, or any aggressive position sizing. Each trade is opened with a clear logic and closed by SL or TP according to fixed rules.
This strategy runs only inside TradingView for historical simulation and analysis purposes. It is not investment advice or financial guidance.
Backtest and historical results do not guarantee future performance in live markets.
Any decision to use similar logic in live accounts or other trading environments is entirely the user’s responsibility, including risk management, position sizing, and instrument selection.
In summary, FluxMA is a simple and transparent foundation to study how a mechanical moving average breakout system behaves under different parameter, session, and weekday configurations, within a controlled testing environment like TradingView.

Kuytrade - Super Scalping Pro V1.0📘 Strategy "Kuytrade - Super Scalping Pro"
What is this strategy?
This is a scalping trading that helps you catch quick profits from short-term price movements. It's perfect for traders who want to make multiple small wins throughout the day.
How does it work?
The strategy uses a 3-level filter system to find high-quality trading signals:
Level 1: CORE Indicators (Must Pass)
- EMA (Moving Averages): Checks if the trend is going up or down
- MACD: Confirms momentum is building in the right direction
Level 2: MOMENTUM Indicators
- RSI: Looks for oversold (ready to bounce up) or overbought (ready to drop) conditions
- Stochastic: Finds reversal points where price might change direction
Level 3: BOOST Indicators
- RSI Divergence: Spots hidden opportunities when price and momentum disagree
- Strong Candles: Identifies powerful price movements
- ATR Filter: Makes sure the market is active enough to trade
Trading Setup
Each Signal Opens 3 Orders:
Order 1: Closes at TP1 (quick small profit)
Order 2: Closes at TP2 (medium profit)
Order 3: Closes at TP3 (big profit target)
Default Settings:
TP1: 1,000 points
TP2: 1,500 points
TP3: 2,500 points
Stop Loss: 1,200 points
Lot Size: 0.01 per order (3 orders total)
Smart Features
- Trailing Stop Loss
- When TP1 hits, the Stop Loss for TP3 automatically moves to breakeven + 150 points, protecting your profit!
- Auto Asset Detection
The strategy automatically recognizes what you're trading:
- Forex pairs (EURUSD, GBPUSD, etc.)
- Gold, Silver, Platinum
- Crypto (Bitcoin, Ethereum)
- Stock Indices (US30, NASDAQ, S&P500)
Indicators:
You can enable/disable each indicator level
Mix and match to find what works for your style
Visuals:
Show/Hide TP/SL lines
Show/Hide entry boxes
Mobile view for smaller screens
When to Use This Strategy?
✅ Best for:
Active markets (London/NY sessions)
Lower timeframes (1m, 5m, 15m)
Volatile pairs with clear trends
❌ Avoid during:
Major news releases
Very quiet markets
Weekends/holidays
----------------------------------------
กลยุทธ์นี้คืออะไร?
Scalping ที่ออกแบบมาให้ช่วยทำกำไรเล็กๆ จากการเคลื่อนไหวของราคาระยะสั้น เหมาะสำหรับเทรดเดอร์ที่ต้องการทำกำไรเล็กน้อยบ่อยๆ ตลอดทั้งวัน
ทำงานยังไง?
กลยุทธ์ใช้ระบบกรองสัญญาณ 3 ระดับ เพื่อหาจุดเข้าที่มีคุณภาพสูง
Level 1: ตัวบ่งชี้หลัก (ต้องผ่าน)
- EMA (เส้นค่าเฉลี่ย): เช็คว่าเทรนด์กำลังขึ้นหรือลง
- MACD: ยืนยันว่าแรงซื้อ/ขายกำลังมาถูกทาง
Level 2: ตัวบ่งชี้โมเมนตัม
- RSI: หาจุด Oversold (ราคาถูกเกินไป พร้อมกลับตัว) หรือ Overbought (ราคาแพงเกิน พร้อมลง)
- Stochastic: หาจุดกลับตัวที่ราคาอาจจะเปลี่ยนทิศ
Level 3: ตัวบ่งชี้เสริม
- RSI Divergence: เจอโอกาสแอบแฝงเมื่อราคาและโมเมนตัมไม่สอดคล้องกัน
- Strong Candles: จับแท่งเทียนที่แรงมาก
- ATR Filter: ตรวจว่าตลาดมีความผันผวนพอจะเทรดไหม
การตั้งค่าการเทรด
แต่ละสัญญาณเปิด 3 ออเดอร์:
ออเดอร์ 1: ปิดที่ TP1 (กำไรเล็กเร็ว)
ออเดอร์ 2: ปิดที่ TP2 (กำไรกลางๆ)
ออเดอร์ 3: ปิดที่ TP3 (กำไรใหญ่)
ค่าเริ่มต้น:
TP1: 800 จุด
TP2: 1,500 จุด
TP3: 2,500 จุด
Stop Loss: 1,200 จุด
ขนาดล็อต: 0.01 ต่อออเดอร์ (รวม 3 ออเดอร์)
ฟีเจอร์พิเศษ
- Trailing Stop Loss (ขยับ SL ตาม)
- เมื่อ TP1 โดน SL ของ TP3 จะเลื่อนมาที่ราคาเข้า + 150 จุด ทำให้คุณไม่ขาดทุน!
- ตรวจจับสินทรัพย์อัตโนมัติ
กลยุทธ์จะจำคู่เงินที่คุณเทรดได้เอง:
คู่เงิน Forex (EURUSD, GBPUSD ฯลฯ)
- ทองคำ, เงิน, แพลตตินั่ม
- คริปโต (Bitcoin, Ethereum)
- ดัชนีหุ้น (US30, NASDAQ, S&P500)
แดชบอร์ดผลงาน (ล่างซ้าย)
- แสดง Win Rate แต่ละ TP
- ติดตามกำไร/ขาดทุนรวม
- แสดงสถิติทั้งหมด
แดชบอร์ดสถานะ Level (บนขวา)
สถานะตัวบ่งชี้แบบเรียลไทม์
เขียว = สัญญาณพร้อม
แดง = รอเงื่อนไข
ตั้งค่าที่ปรับได้
คุณภาพสัญญาณ:
เปิด "Strict Filter" = สัญญาณน้อยแต่คุณภาพสูง
ปิด "Strict Filter" = สัญญาณเยอะแต่อาจเสี่ยงขึ้น
ตัวบ่งชี้:
- เปิด/ปิดแต่ละ Level ได้
- ผสมผสานหาสูตรที่เหมาะกับคุณ
การแสดงผล:
- แสดง/ซ่อนเส้น TP/SL
- แสดง/ซ่อนกล่องข้อมูล Entry
- โหมดมือถือสำหรับจอเล็ก
เมื่อไหร่ควรใช้กลยุทธ์นี้?
✅ เหมาะกับ:
- ตลาดที่คึกคัก (เซสชั่นลอนดอน/นิวยอร์ก)
- ไทม์เฟรมเล็ก (1m, 5m, 15m)
- คู่เงินที่มีความผันผวนและเทรนด์ชัด
❌ หลีกเลี่ยง:
- ช่วงมีข่าวเศรษฐกิจสำคัญ
- ตลาดเงียบมาก
- วันหยุดสุดสัปดาห์

Alpha-Vector Unconstrained [GG_DOGE]
Alpha-Vector: Variance-Weighted Trend Capture Protocol
Authored by: GG_DOGE
Executive Summary
This algorithm represents the culmination of an exhaustive quantitative regression analysis, designed to exploit fat-tail distribution events in the SOL/USD cryptographic pair. By leveraging recursive historical data modeling on the 8-Hour timeframe, the strategy identifies high-probability momentum asymmetry—specifically isolating periods where directional volatility aligns with institutional order flow.
Unlike static heuristic models, this protocol utilizes a Dynamic Variance-Weighted Allocation Engine. This ensures that capital exposure is inversely correlated to market noise (entropy) while maximizing geometric compounding during high-conviction momentum phases. It essentially acts as a volatility filter, capitalizing on the statistical skew of the asset's return profile while enforcing rigorous drawdown mitigation via adaptive liquidity exits.
Key Algorithmic Features
Asymmetric Risk Architecture: The strategy deploys decoupled risk profiles for Long and Short vectors. Through backtest optimization, we have mathematically determined that bullish drift requires aggressive variance targeting, while bearish mean-reversion requires strictly constrained capital exposure to mitigate "short-squeeze" tail risks.
Volatility-Adjusted Position Sizing: Trade depth is not static. The algorithm calculates the instantaneous Average True Range (ATR) to normalize position size based on current market turbulence. This maintains a constant Risk-of-Ruin probability, regardless of price velocity.
Quantitatively Optimized Trend Filter: The entry signal is governed by a proprietary lookback period derived from computational brute-forcing of historical pivot points, designed to filter out Gaussian noise and only execute during significant structural market shifts.
Operational Guide (Strict Adherence Required)
This script comes pre-loaded with the statistically optimal parameters for the analyzed asset. No manual calibration is required.
Deployment Target:
Asset: CRYPTO:SOLUSD (Solana / US Dollar)
Timeframe: 8h (8-Hour Candle)
Exchange: Any major liquidity venue (Binance, Coinbase, Kraken, etc.)
Configuration:
Strategy Mode: Select "Long & Short" for the fully optimized protocol (captures upside momentum and hedges downside crashes).
Risk Parameters: The default values are mathematically tuned for maximum geometric growth (Highest PnL). Do not alter these unless you wish to artificially suppress the algorithm's volatility targeting.
Execution:
Capital Allocation: The logic is designed for compounding growth. It will automatically calculate the maximum lot size allowed based on your account equity, ensuring 100% capital efficiency without crossing into margin-call territory

Hash Ratings EngineHash Ratings Engine - Technical Consensus Strategy
A systematic trading strategy that harnesses TradingView's Technical Ratings to generate high-conviction entries with institutional-grade risk management.
What It Does
This strategy aggregates the consensus of 26+ technical indicators (RSI, MACD, Stochastics, multiple Moving Averages, etc.) into a single actionable signal. When enough indicators align bullish or bearish, the engine triggers an entry. Built-in trend filtering and ATR-based exits keep you on the right side of the market.
Key Features
Trend Filter - Only takes longs in uptrends, shorts in downtrends. This single filter typically improves results by 20-40% by avoiding counter-trend trades.
ATR-Based Risk Management - Stop loss and trailing stops adapt to current market volatility. Tight stops in calm markets, wider stops in volatile conditions.
Cooldown System - After a losing trade, the strategy waits before re-entering. This prevents the consecutive loss streaks that destroy accounts.
Clean Visuals - Fluorescent entry/exit signals with price level references. See exactly where you got in and out.
Settings Guide
Indicator Timeframe: Leave blank for current chart. Use higher timeframe for fewer, higher-quality signals.
Rating Source: "All" for balanced approach. "MAs" for trend-following. "Oscillators" for mean-reversion.
Entry Thresholds
Strong Signal Threshold: Higher = fewer trades but better conviction. Start at 0.5, test 0.4-0.6.
Risk Management
ATR Period: 12 is responsive, 14 is standard, 20+ is smoother.
Stop Loss: 2-3x ATR for tight stops, 3.5-4x for moderate, 5x+ for wide.
Trail Activation: How far price must move in profit before trailing begins.
Trail Offset: How closely the trail follows price.
Trend Filter
EMA Length: 150 works well on 4H charts. Use 100 for lower timeframes, 200 for daily.
Trade Timing
Cooldown: Keep enabled. 5 bars is a good starting point.
Best Practices
Start with default settings and backtest on your preferred instrument. Adjust the Strong Signal Threshold first - this has the biggest impact on trade frequency. Then tune the EMA length to match your timeframe. Finally, optimize the ATR multipliers for your risk tolerance.
Works on any liquid market - crypto, forex, stocks, futures. Higher timeframes (4H, Daily) tend to produce cleaner signals than lower timeframes.
Disclaimer
Past performance does not guarantee future results. Always backtest thoroughly and use proper position sizing. This strategy is for educational purposes - trade at your own risk.

MA Strategy: Dual Entry FilterConfigurable MA Dual-Filter Strategy
This strategy is an enhanced and highly configurable Moving Average (MA) Crossover system designed to mitigate false signals and align trades with the prevailing market trend. It is built to offer traders granular control over entry criteria, elevating it beyond basic, built-in MA crossover indicators.
Originality & Key Features
The script's originality and utility lie in the combination of its two primary, optional filtering mechanics:
Dual Entry Mode (Key Filter): Users can choose between two distinct methods for trade entry:
Crossover (Classic): Immediate entry when the price crosses the main MA.
Full Candle Confirmation (Unique Feature): This mode requires the entire candle body (open, high, low, and close) to be completely above or below the main MA after a crossover event to confirm the signal before entry. This strict confirmation helps to filter out weak crossovers, reducing whipsaws in choppy markets.
Optional Trend Filter: A second, slower MA (Trend Filter MA) can be activated. Trades are only permitted when the faster main MA is aligned with the slower Trend MA (i.e., long only if main MA > Trend MA), ensuring trades are executed with the established higher-timeframe direction.
How to Use the Strategy
The strategy logic is built on simple MA principles but utilizes Pine Script's switch function to allow users to select from six different MA types for both the main signal and the trend filter: SMA, EMA, WMA, HMA, VWMA, and RMA.
Core Logic:
Signal: A cross of the price over the Main MA (filtered by the chosen Entry Mode).
Directional Filter: The Trend Filter must confirm the direction (if enabled).
Exit: Trades are exited on the opposite price crossover of the Main MA.
Customizable Settings Include:
Main MA Type & Length (Default: 40 EMA): The primary signal generator.
Trend Filter MA Type & Length (Default: 70 EMA): The optional, slower trend bias.
Entry Mode: Switch between Crossover or Full Candle Confirmation.
Strategy Results and High-Risk Disclaimer
The default setting for trade size is set to 40% of equity for backtesting demonstration purposes only. This high value is used to generate a large and diverse sample size of trades for historical review on the chart.
This 40% value is NOT a recommended setting for live trading. Per TradingView guidelines, traders are strongly advised to change this input to a sustainable risk level, typically 5% to 10% of equity per trade. Past performance is not a guarantee of future results.

ChronoPulse MS-MACD Resonance StrategyChronoPulse MS-MACD Resonance Strategy
A systematic trading strategy that combines higher-timeframe market structure analysis with dual MACD momentum confirmation, ATR-based risk management, and real-time quality assurance monitoring.
Core Principles
The strategy operates on the principle of multi-timeframe confluence, requiring agreement between:
Market structure breaks (CHOCH/BOS) on a higher timeframe
Dual MACD momentum confirmation (classic and crypto-tuned profiles)
Trend alignment via directional EMAs
Volatility and volume filters
Quality score composite threshold
Strategy Components
Market Structure Engine : Detects Break of Structure (BOS) and Change of Character (CHOCH) events using confirmed pivots on a configurable higher timeframe. Default structure timeframe is 240 minutes (4H).
Dual MACD Fusion : Requires agreement between two MACD configurations:
Classic MACD: 12/26/9 (default)
Fusion MACD: 8/21/5 (default, optimized for crypto volatility)
Both must agree on direction before trade execution. This can be disabled to use single MACD confirmation.
Trend Alignment : Uses two EMAs for directional bias:
Directional EMA: 55 periods (default)
Execution Trend Guide: 34 periods (default)
Both must align with trade direction.
ATR Risk Management : All risk parameters are expressed in ATR multiples:
Stop Loss: 1.5 × ATR (default)
Take Profit: 3.0 × ATR (default)
Trail Activation: 1.0 × ATR profit required (default)
Trail Distance: 1.5 × ATR behind price (default)
Volume Surge Filter : Optional gate requiring current volume to exceed a multiple of the volume SMA. Default threshold is 1.4× the 20-period volume SMA.
Quality Score Gate : Composite score (0-1) combining:
Structure alignment (0.0-1.0)
Momentum strength (0.0-1.0)
Trend alignment (0.0-1.0)
ATR volatility score (0.0-1.0)
Volume intensity (0.0-1.0)
Default threshold: 0.62. Trades only execute when quality score exceeds this threshold.
Execution Discipline : Trade budgeting system:
Maximum trades per session: 6 (default)
Cooldown bars between entries: 5 (default)
Quality Assurance Console : Real-time monitoring panel displaying:
Structure status (pass/fail)
Momentum confirmation (pass/fail)
Volatility readiness (pass/fail)
Quality score (pass/fail)
Discipline compliance (pass/fail)
Performance metrics (win rate, profit factor)
Net PnL
Certification requires: Win Rate ≥ 40%, Profit Factor ≥ 1.4, Minimum 25 closed trades, and positive net profit.
Integrity Suite : Optional validation panel that audits:
Configuration sanity checks
ATR data readiness
EMA hierarchy validity
Performance realism checks
Strategy Settings
strategy(
title="ChronoPulse MS-MACD Resonance Strategy",
shorttitle="ChronPulse",
overlay=true,
max_labels_count=500,
max_lines_count=500,
initial_capital=100000,
currency=currency.USD,
pyramiding=0,
commission_type=strategy.commission.percent,
commission_value=0.015,
slippage=2,
default_qty_type=strategy.percent_of_equity,
default_qty_value=2.0,
calc_on_order_fills=true,
calc_on_every_tick=true,
process_orders_on_close=true
)
Key Input Parameters
Structure Timeframe : 240 (4H) - Higher timeframe for structure analysis
Structure Pivot Left/Right : 3/3 - Pivot confirmation periods
Structure Break Buffer : 0.15% - Buffer for structure break confirmation
MACD Fast/Slow/Signal : 12/26/9 - Classic MACD parameters
Fusion MACD Fast/Slow/Signal : 8/21/5 - Crypto-tuned MACD parameters
Directional EMA Length : 55 - Primary trend filter
Execution Trend Guide : 34 - Secondary trend filter
ATR Length : 14 - ATR calculation period
ATR Stop Multiplier : 1.5 - Stop loss in ATR units
ATR Target Multiplier : 3.0 - Take profit in ATR units
Trail Activation : 1.0 ATR - Profit required before trailing
Trail Distance : 1.5 ATR - Distance behind price
Volume Threshold : 1.4× - Volume surge multiplier
Quality Threshold : 0.62 - Minimum quality score (0-1)
Max Trades Per Session : 6 - Daily trade limit
Cooldown Bars : 5 - Bars between entries
Win-Rate Target : 40% - Minimum for QA certification
Profit Factor Target : 1.4 - Minimum for QA certification
Minimum Trades for QA : 25 - Required closed trades
Signal Generation Logic
A trade signal is generated when ALL of the following conditions are met:
Higher timeframe structure shows bullish (CHOCH/BOS) or bearish structure break
Both MACD profiles agree on direction (if fusion enabled)
Price is above both EMAs for longs (below for shorts)
ATR data is ready and above minimum threshold
Volume exceeds threshold × SMA (if volume gate enabled)
Quality score ≥ quality threshold
Trade budget available (under max trades per day)
Cooldown period satisfied
Risk Management
Stop loss and take profit are set immediately on entry
Trailing stop activates after 1.0 ATR of profit
Trailing stop maintains 1.5 ATR distance behind highest profit point
Position sizing uses 2% of equity per trade (default)
No pyramiding (single position per direction)
Limitations and Considerations
The strategy requires sufficient historical data for higher timeframe structure analysis
Quality gate may filter out many potential trades, reducing trade frequency
Performance metrics are based on historical backtesting and do not guarantee future results
Commission and slippage assumptions (0.015% + 2 ticks) may vary by broker
The strategy is optimized for trending markets with clear structure breaks
Choppy or ranging markets may produce false signals
Crypto markets may require different parameter tuning than traditional assets
Optimization Notes
The strategy includes several parameters that can be tuned for different market conditions:
Quality Threshold : Lower values (0.50-0.60) allow more trades but may reduce average quality. Higher values (0.70+) are more selective but may miss opportunities.
Structure Timeframe : Use 240 (4H) for intraday trading, Daily for swing trading, Weekly for position trading
Volume Gate : Disable for low-liquidity pairs or when volume data is unreliable
Dual MACD Fusion : Disable for mean-reverting markets where single MACD may be more responsive
Trade Discipline : Adjust max trades and cooldown based on your risk tolerance and market volatility
Non-Repainting Guarantee
All higher timeframe data requests use lookahead=barmerge.lookahead_off to prevent repainting. Pivot detection waits for full confirmation before registering structure breaks. All visual elements (tables, labels) update only on closed bars.
Alerts
Three alert conditions are available:
ChronoPulse Long Setup : Fires when all long entry conditions are met
ChronoPulse Short Setup : Fires when all short entry conditions are met
ChronoPulse QA Certification : Fires when Quality Assurance console reaches CERTIFIED status
Configure alerts with "Once Per Bar Close" delivery to match the non-repainting design.
Visual Elements
Structure Labels : CHOCH↑, CHOCH↓, BOS↑, BOS↓ markers on structure breaks
Directional EMA : Orange line showing trend bias
Trailing Stop Lines : Green (long) and red (short) trailing stop levels
Dashboard Panel : Real-time status display (structure, MACD, ATR, quality, PnL)
QA Console : Quality assurance monitoring panel
Integrity Suite Panel : Optional validation status display
Recommended Usage
Forward test with paper trading before live deployment
Monitor the QA console until it reaches CERTIFIED status
Adjust parameters based on your specific market and timeframe
Respect the trade discipline limits to avoid over-trading
Review quality scores and adjust threshold if needed
Use appropriate commission and slippage settings for your broker
Technical Implementation
The strategy uses Pine Script v6 with the following key features:
Multi-timeframe data requests with lookahead protection
Confirmed pivot detection for structure analysis
Dynamic trailing stop management
Real-time quality score calculation
Trade budgeting and cooldown enforcement
Comprehensive dashboard and monitoring panels
All source code is open and available for review and modification.
Disclaimer
This script is for educational and informational purposes only. It is not intended as financial, investment, or trading advice. Past performance does not guarantee future results. Trading involves substantial risk of loss and is not suitable for all investors. Always conduct your own research and consult with a qualified financial advisor before making any trading decisions. The author and TradingView are not responsible for any losses incurred from using this strategy.

AI ALGO [Ganesh]Core Strategy Components\
1. EMA (Exponential Moving Average) SystemThe strategy uses three EMAs to identify trend direction:
EMA 48 (longer-term trend)
EMA 2 (short-term momentum)
EMA 21 (medium-term trend)
How it works:
Bullish trend: When price is above EMA 21 (green cloud)
Bearish trend: When price is below EMA 21 (red cloud)
EMA Cloud: The area between EMA 2 and EMA 48/21 provides visual trend confirmation
Optional higher timeframe (HTF) analysis for multi-timeframe confirmation
2. DEMA ATR (Double EMA + Average True Range)
This is a dynamic support/resistance indicator that adapts to volatility:Components:
DEMA (Double Exponential Moving Average): Smooths price action with less lag
ATR Bands: Creates upper and lower bands based on volatility (ATR × 1.7 factor)
Signal Generation:
Green line: Uptrend (DEMA ATR rising)
Red line: Downtrend (DEMA ATR falling)
Acts as a trailing stop-loss level that adjusts with market volatility
3. Smart Trail System (Fibonacci-Based)
An advanced trailing stop system using modified true range calculations:Key Features:
Calculates true range using Wilder's smoothing method
Creates Fibonacci retracement levels (61.8%, 78.6%, 88.6%) from the trail line
Adaptive stop-loss: Adjusts based on ATR factor (4.2) and smoothing (4)
Trend Detection:
Bullish: Price > Trailing line (blue zones)
Bearish: Price < Trailing line (red zones)
The Fibonacci zones show potential support/resistance areas
4. ZigZag Indicator Identifies significant swing highs and lows:
Length parameter: 13 (sensitivity control)
Labels: Higher Highs (HH), Lower Lows (LL), etc.
Helps identify trend reversals and key pivot points
5. Support & Resistance Levels
Strength-based S/R: Identifies horizontal support/resistance zones
Zone width: Adjustable percentage-based zones
High/Low zones: Marks significant price levels
Trading LogicEntry Conditions (Implied)The strategy likely enters trades when:Long Entry:
Price crosses above DEMA ATR (green)
Price is above EMA 21 (bullish EMA cloud)
Smart Trail confirms uptrend
Price bounces from Fibonacci support levels
Short Entry:
Price crosses below DEMA ATR (red)
Price is below EMA 21 (bearish EMA cloud)
Smart Trail confirms downtrend
Price rejects from Fibonacci resistance levels
Exit/Stop-Loss Strategy
Trailing stops: Using Smart Trail Fibonacci levels
Dynamic stops: DEMA ATR line acts as a moving stop-loss
Risk management: Position sizing at 50% of equity per trade
Dashboard Features1. Weekly Performance Table
Tracks trades per day of the week
Shows win/loss statistics
Calculates win rate percentage
2. Monthly Performance Table
Monthly P&L breakdown
Yearly performance summary
Color-coded returns (green = profit, red = loss)
Strategy Parameters
Initial Capital: $5,000
Commission: 0.02% per trade
Position Size: 50% of equity
Pyramiding: Disabled (no adding to positions)
Calculation: On bar close (not tick-by-tick)
Visual Elements
EMA clouds: Green (bullish) / Red (bearish)
DEMA ATR line: Dynamic support/resistance
Smart Trail zones: Fibonacci-based colored bands
ZigZag lines: Swing high/low connections
S/R zones: Horizontal support/resistance areas
Strategy Philosophy
This is a trend-following strategy with dynamic risk management that:
Uses multiple timeframes for confirmation
Adapts to volatility through ATR-based indicators
Provides clear visual cues for trend direction
Includes comprehensive performance tracking
Combines momentum (EMAs) with volatility (ATR) for robust signals
The strategy works best in trending markets and uses the Fibonacci trail system to maximize profits while protecting against reversals with adaptive stop-losses.

Katik EMA BUY SELLThis strategy uses EMA 9, EMA 20, and EMA 200 to generate Buy and Sell signals.
BUY Conditions
EMA 9 crosses above EMA 20
Stoploss: Recent Swing Low
Target: EMA 9 touches or crosses EMA 200
SELL Conditions
EMA 9 crosses below EMA 20
Stoploss: Recent Swing High
Target: EMA 9 touches or crosses EMA 200
Features
Automatic Long & Short entries
Dynamic swing-based stoploss
Clear EMA plots with line width 3
Works on all timeframes

Sniper PRO: The "Buffett Mode" VFI System"The stock market is a device for transferring money from the impatient to the patient." — Warren Buffett
Most traders lose money because they try to catch every small move. Sniper PRO is designed for the opposite: It identifies the massive, multi-week and multi-month trends driven by Institutional "Smart Money", and keeps you in the trade until the real move is over.
This is not a scalping tool. This is a Wealth Compounding Engine.
🚀 Why is this the "Secret Weapon"?
We combined the most searched and respected indicators into a single, high-probability algorithm:
VFI (Smart Money Flow): Tracks what the "Whales" are doing, not the retail traders.
Fibonacci Golden Ratio: Uses math to secure profits, not guesswork.
Trend Protocol: Filters out 90% of market noise.
🔥 The "Diamond Hands" Logic (VFI Shield)
The biggest problem in long-term trading is getting shaken out by a temporary dip. Sniper PRO solves this with the VFI Shield:
Even if price drops below your Stop Loss, the algorithm checks the Institutional Volume.
If Big Money is still holding? The Shield holds. You stay in the trade.
This feature alone allows you to ride trends for Weeks and Months (like NVDA, TSLA, BTC runs) without exiting prematurely.
⚙️ How It Works
1. The "Buffett" Entry We only enter when the odds are stacked in our favor:
Trend: Price must be above the EMA 50 (Bull Market).
Volume: VFI must be Positive (Accumulation Phase).
Volatility: The market must be active, not chopping sideways.
2. The Compounding Exit (Fibonacci Ladder) Instead of selling too early, the system builds a Fibonacci Ladder behind the price.
As the asset grows, your Stop Loss climbs automatically to the next Fibonacci level (0.382 -> 0.5 -> 0.618).
This locks in profits step-by-step while giving the asset room to breathe and grow.
3. Asymmetric Safety Shorting is risky in a long-term bull market. The system automatically reduces the size of Short trades to protect your capital, while maximizing exposure to Long rallies.
📊 Visual Guide
🔵 Blue Line: The Trend Baseline.
🔴 Red Steps: Your "Locked" Profit Level (Trailing Stop).
🟣 Purple 'X': Where the trade finally closed (Transparency).
Background Color:
Green: Bull Market (Safe to hold).
Orange: Choppy/Dangerous (Cash is King).
Best For:
Swing Traders & Investors (1D, 4H Timeframes).
People who want to catch the Big Moves and ignore the noise.
Disclaimer: This tool is designed for trend following. Past performance is not indicative of future results. Always manage your risk.

Crypto Intraday Strategy by SAIFOverview
A comprehensive intraday trading strategy designed for cryptocurrency markets, combining multiple technical indicators and risk management principles to identify high-probability trading opportunities.
Key Features
Multi-Timeframe Analysis
Utilizes exponential moving averages for trend identification
Incorporates swing structure analysis for support and resistance levels
Applies momentum and trend strength filters
Risk Management
Configurable risk-reward ratios (default 1.6:1)
Maximum risk per trade capped at 3.1% of equity
Dynamic stop-loss placement based on market structure
Position sizing at 2% of equity per trade
Advanced Filters
Trend strength confirmation using ADX indicator
Momentum validation through multiple oscillators
Market correlation analysis for additional confluence
Optional weekend trading filter to avoid low-liquidity periods
Swing Structure Recognition
Automatically identifies key swing highs and lows
Uses pivot points to determine optimal entry zones
Prevents entries too far from established support/resistance
Trade Execution
The strategy employs a one-way trading approach, entering positions only when multiple technical conditions align. Each trade includes pre-defined stop-loss and take-profit levels calculated at entry.
Customization Options
Adjustable swing detection sensitivity
Configurable EMA distance thresholds
Optional correlation filters
Weekend trading toggle
Risk parameters can be modified to suit individual preferences
Important Disclaimers
⚠️ Educational Purpose Only: This strategy is provided for educational and informational purposes. Past performance does not guarantee future results.
⚠️ Risk Warning: Trading cryptocurrencies carries substantial risk of loss. Only trade with capital you can afford to lose.
⚠️ Not Financial Advice: This tool does not constitute financial, investment, or trading advice. Always conduct your own research and consult with qualified financial professionals.
⚠️ Backtesting Limitations: Historical backtesting results may not reflect actual trading conditions due to slippage, execution delays, and changing market dynamics.
Fees & Slippage
Commission: 0.12% per trade
Slippage: 2 ticks accounted for in backtesting
Recommended Usage
Thoroughly backtest on your preferred trading pairs
Start with small position sizes when live trading
Monitor performance across different market conditions
Adjust parameters based on asset volatility and your risk tolerance

OLPF - Octavio Low-Pass Filter StrategyOCTAVIO LOW-PASS FILTER (OLPF) v1.0
---
DESCRIPTION
The Octavio Low-Pass Filter (OLPF) is an advanced Finite Impulse Response (FIR) low-pass filter designed for financial time series analysis. It builds upon the foundational work of the New Low-Pass Filter (NLF) by Alex Pierrefeu, introducing three key enhancements that significantly improve signal quality and reduce common filtering artifacts.
---
KEY INNOVATIONS
1. HERMITE SMOOTHING POLYNOMIAL
Replaces the simple quadratic base (x²) with the cubic Hermite interpolation polynomial . This mathematical refinement provides C¹ continuity at kernel boundaries, ensuring smoother transitions and eliminating edge discontinuities that can introduce artificial noise into the filtered signal.
2. LANCZOS SIGMA FACTOR WINDOWING
Applies a Lanczos-type attenuation factor to each harmonic component in the sine series. This windowing technique dramatically reduces the Gibbs phenomenon - the characteristic overshooting and ringing that occurs near sharp price transitions. The result is a cleaner signal with minimized false crossover signals.
3. ADAPTIVE WEIGHT NORMALIZATION
Implements dynamic normalization of kernel weights, guaranteeing that the sum of all filter coefficients equals unity. This ensures proper amplitude preservation across all market conditions and prevents signal drift or scaling artifacts.
---
MATHEMATICAL FOUNDATION
The OLPF kernel function is defined as:
K(x, N) = x²(3-2x) + Σ (1/i) × σ(i) × sin(πxi)
Where:
- x ∈ is the normalized position within the filter window
- N is the filter order (degree of the sine series)
- σ(i) = sin(πi/(N+1)) / (πi/(N+1)) is the Lanczos sigma factor
The filter output is computed via discrete convolution:
F(M, N) = Σ src × / W
Where W is the sum of all weights for normalization.
---
APPLICATIONS
- Trend identification with reduced lag compared to traditional MAs
- Noise reduction in volatile market conditions
- Generation of trading signals via fast/slow filter crossovers
- Foundation for more complex indicator development
---
STRATEGY IMPLEMENTATION
This script implements a dual-filter crossover strategy with:
- Fast OLPF for responsive signal generation
- Slow OLPF for trend confirmation
- EMA filter for additional trend validation
- ATR-based dynamic stop-loss positioning
- Risk-based position sizing (percentage of equity)
---
AUTHOR
Name: Hector Octavio Piccone Pacheco
Filter: Octavio Low-Pass Filter (OLPF)
Version: 1.0
Based on: New Low-Pass Filter (NLF) by Alex Pierrefeu
Date: 2025
Original Contributions:
- Hermite smoothing polynomial kernel base
- Lanczos sigma factor windowing for Gibbs reduction
- Adaptive weight normalization system
- Integrated risk management framework
---
LICENSE
This work is licensed under the Mozilla Public License 2.0. You are free to use, modify, and distribute this code with attribution.
---
DISCLAIMER
Trading involves substantial risk of loss. This indicator is provided for educational and research purposes only. Past performance does not guarantee future results. Always conduct your own analysis and risk assessment.

Quantellics: NQ Reverse From EMA [Strategy]//@version=5
// © 2025 Quantellics. All rights reserved.
strategy("Quantellics: NQ Reverse From EMA ", overlay = true, default_qty_type = strategy.percent_of_equity, default_qty_value = 100, pyramiding = 0)
// Inputs
emaLen = input.int(60, "EMA Length", minval = 1)
rsiLen = input.int(14, "RSI Length", minval = 1)
lb = input.int(10, "Lookback Candles", minval = 1)
entryOff = input.float(75.0, "Entry Offset ($)", minval = 0, step = 1)
slDollar = input.float(50.0, "Stop Loss ($)", minval = 0, step = 1)
tpDollar = input.float(50.0, "Take Profit ($)", minval = 0, step = 1)
trailAct = input.float(30.0, "Trail Activation ($)", minval = 0, step = 1)
trailOff = input.float(30.0, "Trail Offset ($)", minval = 0, step = 1)
trailDelay = input.int(2, "Trail Delay (Candles)", minval = 0, step = 1)
ssH = input.int(9, "Session Start Hour (ET)", minval = 0, maxval = 23)
ssM = input.int(30, "Session Start Minute (ET)", minval = 0, maxval = 59)
seH = input.int(12, "Session End Hour (ET)", minval = 0, maxval = 23)
seM = input.int(0, "Session End Minute (ET)", minval = 0, maxval = 59)
// Session calc
int h = hour(time, "America/New_York")
int m = minute(time, "America/New_York")
sStart = ssH * 60 + ssM
sEnd = seH * 60 + seM
nowMin = h * 60 + m
inSess = nowMin >= sStart and nowMin < sEnd
eos = nowMin >= sEnd
// Indicators
ema60 = ta.ema(close, emaLen)
rsi = ta.rsi(close, rsiLen)
hiN = ta.highest(high, lb)
loN = ta.lowest(low, lb)
// Levels
longLvl = hiN - entryOff
shortLvl = loN + entryOff
// Conditions
longOk = high > ema60 and rsi > 50 and strategy.position_size == 0 and inSess and not eos
shortOk = low < ema60 and rsi < 50 and strategy.position_size == 0 and inSess and not eos
// State
var float ePrice = na
var float slLvl = na
var float tpLvl = na
var int bars = 0
if strategy.position_size != 0
bars += 1
else
bars := 0
// Orders
if longOk
strategy.entry("Long", strategy.long, limit = longLvl)
else
strategy.cancel("Long")
if shortOk
strategy.entry("Short", strategy.short, limit = shortLvl)
else
strategy.cancel("Short")
if strategy.position_size > 0
if bars > trailDelay
strategy.exit("Long Exit", "Long", stop = strategy.position_avg_price - slDollar, limit = strategy.position_avg_price + tpDollar, trail_points = trailAct, trail_offset = trailOff)
else
strategy.exit("Long Exit", "Long", stop = strategy.position_avg_price - slDollar, limit = strategy.position_avg_price + tpDollar)
if strategy.position_size < 0
if bars > trailDelay
strategy.exit("Short Exit", "Short", stop = strategy.position_avg_price + slDollar, limit = strategy.position_avg_price - tpDollar, trail_points = trailAct, trail_offset = trailOff)
else
strategy.exit("Short Exit", "Short", stop = strategy.position_avg_price + slDollar, limit = strategy.position_avg_price - tpDollar)
// EOS flat
if eos and strategy.position_size != 0
strategy.close_all(comment = "EOS Exit")
if eos
strategy.cancel_all()
// Tracking
if strategy.position_size > 0 and strategy.position_size <= 0
ePrice := strategy.position_avg_price
slLvl := ePrice - slDollar
tpLvl := ePrice + tpDollar
if strategy.position_size < 0 and strategy.position_size >= 0
ePrice := strategy.position_avg_price
slLvl := ePrice + slDollar
tpLvl := ePrice - tpDollar
// Plots
plot(ema60, color = color.blue, title = "EMA 60", linewidth = 2)
plot(hiN, color = color.new(color.green, 50), title = "Lookback High", linewidth = 1, style = plot.style_stepline)
plot(loN, color = color.new(color.red, 50), title = "Lookback Low", linewidth = 1, style = plot.style_stepline)
plot(longLvl, color = color.new(color.orange, 30), title = "Long Entry", linewidth = 2)
plot(shortLvl, color = color.new(color.purple, 30), title = "Short Entry", linewidth = 2)
