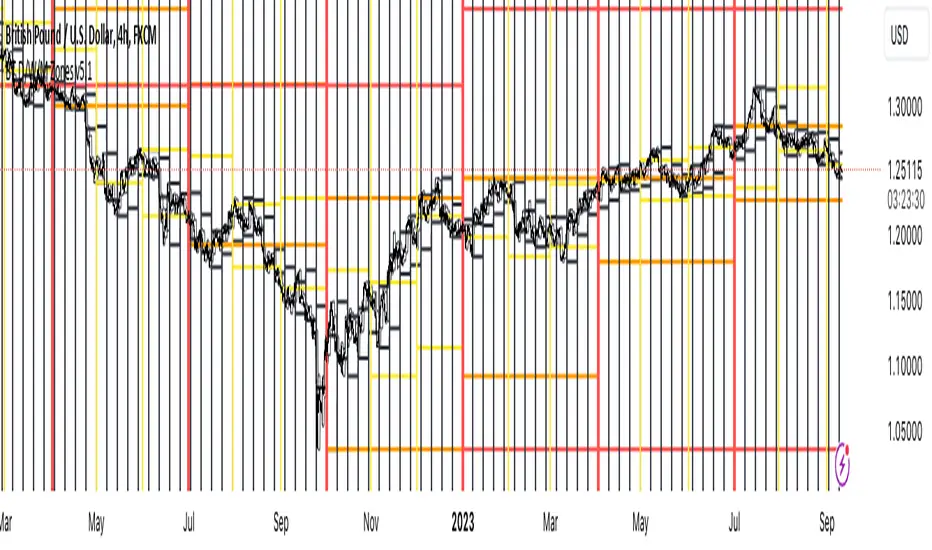
High Low Open Mid Ranges & Levels (Multi-Timeframe)This indicator automatically plots the chosen timeframe's high, low, mid point and open. These levels on higher timeframes act as support and resistance levels on lower timeframes, helping find entries, stoploss and profit targets.
Most common timeframes to choose are Daily, 1W, 1M, and 3M. Other timeframes that are good include, 2D, 2W and 2M.
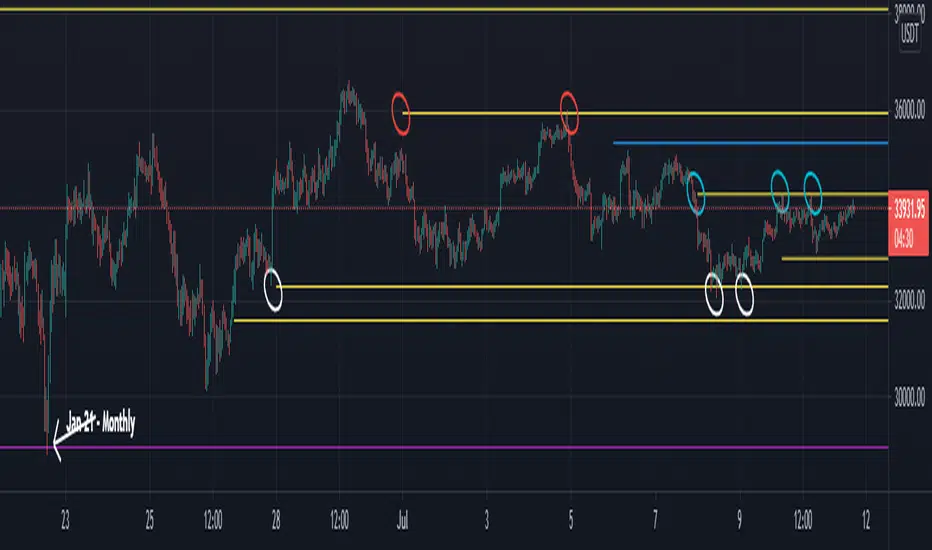
For example, you can see in the snapshot below, we are on the 4hr TF showing those levels from the 2W. This historical 2W zone (open and mid) was (and currently still is) resistance. You can see it also provided a good entry to go short.
This is also useful for intraday scalping. Below, we are on the 15min TF with levels set on the 2D timeframe. You can see how the Open and Mid levels acted as resistance, providing good entries on range trades, with take profit set at the previous 2D low.
There is also a table which tells you all the main TFs high, low, open, and mid levels. They are the most important ones to look out for.
This indicator should not be used in isolation; it is best to pair it up with other TA such as orderblocks, S/D zones, S&R or overlay indicators.
Chart Bulanan

Price Range TableThe table shows the ranking of the price as a percentage relative to the past candles.
100 ~ highest price of the time frame
0 ~ lowest price of the time frame

MTF Key Levels - Support and ResistanceThis indicator shows how to Multi Time Frame (MTF) interpret levels:
Watch how price acts around these levels and how they can act as support/resistance and can be used as great confluence levels for your technical analysis.
This indicator displays:
VWAP Levels
Daily / Weekly / Monthly / Yearly
Within the chart above I have marked out how displaying these VWAP levels can provide support and resistance levels to be aware of.
Daily – Weekly - Monthly – Yearly Levels
O = Open / H = High / L = Low
pO = Previous Open / pH = Previous High / pL = Previous Low / pEQ = Previous Equlibrium
Having previous Low/High levels makes you aware of Swing Failure Patterns (SFP). Also the daily/weekly/monthly opening and previous opening can assist with the trend.
Daily Open: Gives you an idea who is in control for the day. This level very often acts as strong support or resistance.
Weekly Open: Indicates where the price is within the higher timeframe.
Monthly Open & Yearly Levels: Overview of direction for the whole month without looking at a monthly chart and Yearly chart
Line Options
Within the line options you can choose to have a clean chart and display a “short line”. These line length can be adjusted by the user.
Line just to the right.
Line across the screen.
Disclaimer: The Monthly and Yealy VWAP will only show on higher timeframes this is due to restriction of how many candles can be shown on the chart. The candles displayed need to go back to either the start of the month of year to be able to calculate their VWAPs.

Higher Time Frame levelsSimple script to see where the hloc levels are on the last confirmed candle on a higher timeframe. Good for keeping a eye on the monthly or weekly levels . NOTE if you are using the script on monthly setting and are currently on a lower timeframe (15min ) and do not see the lines rendering you just need to move your chart to the left to get the start point of the line to appear on screen, then tradingview will render the lines.

Naked - Daily Weekly MonthlyUser request for Naked Daily Weekly Monthly Opens.
This indicator plots the Daily Weekly Opens (the day after day after creation), they then will stay on the chart until a candle close is completed on the other side of the plot.
In the above chart picture you can see how previous monthly and daily opens have acted as support and resistance.
Thanks go to:
StackOverFlow Bjorn Mistiaen
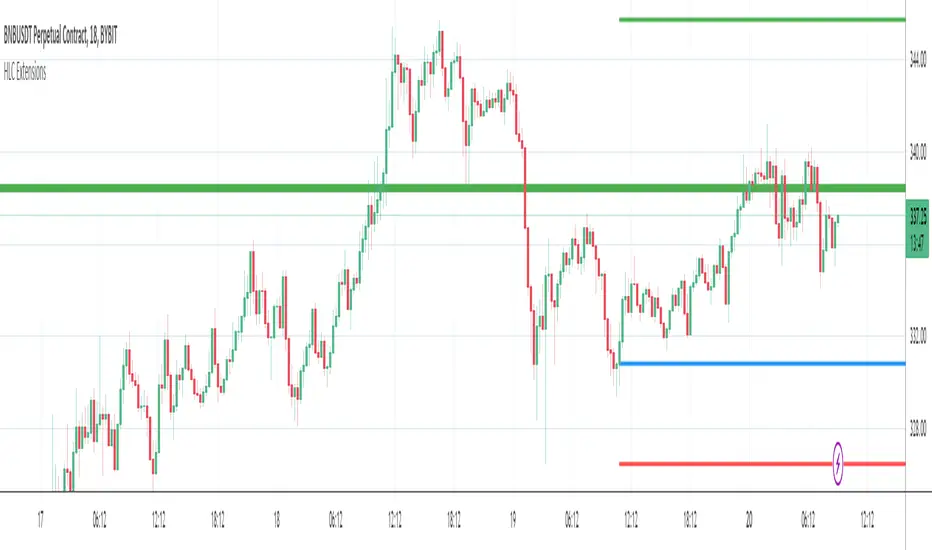
Yesterdays & Last Weeks High Low Close ExtensionsPlots the Extensions of Yesterdays and Last Weeks High Low Close
Unfortunately all of the levels wont always show therefore it is good use this in conjunction with my Levels script
I tried to combine the 2 scripts but doing so gave me memory overload errors in Tradingview thats why I have made them separate
Combo Month-to-Month % ReturnA combined version of two already published indicators:
Combo Month-to-Month % Return (January - June)
Combo Month-to-Month % Return (July - December)
Allows to compare an asset's monthly returns over years.
Includes:
Customizable columns
Up to 20 columns per each chart
Customizable Min, Max, Mean, Median and Standard Deviation lines
Customizable labels

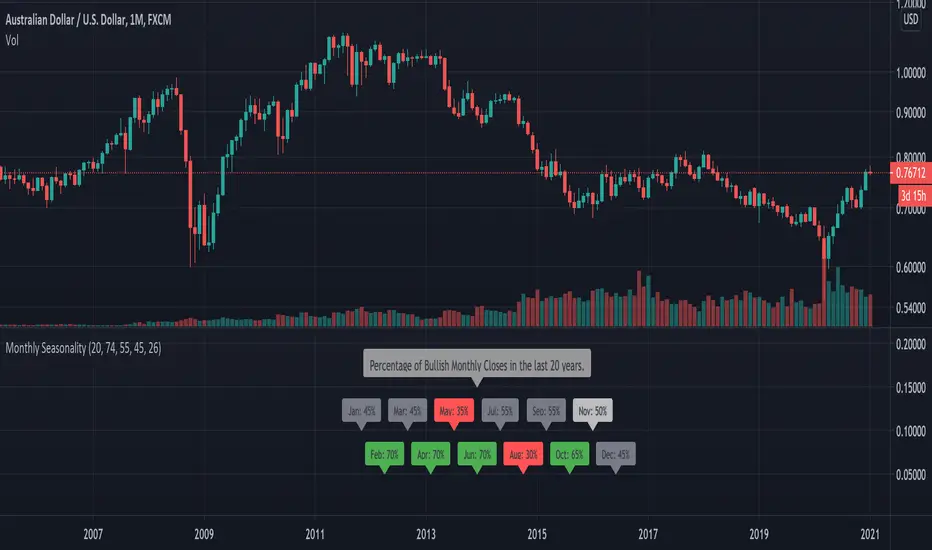
Monthly SeasonalitySimple indicator designed as filter so you can easily see how the currency or asset performed during each month historically.
Can used to identify a possible month to enter or exit a trade in. For best results use in combination with another indicator or candle pattern to signal an entry in a historically bullish month
*This indicator is designed to be used only on the monthly chart.
Key Levels TheHuntThis indicator is made to show you some key levels on the chart on the different timeframes. You can hide them or show them in the settings. The levels are the Monthly Weekly and Daily opens, current monthly, weekly and daily high / low, last weeks high / low & last daily high / low as well as Monday high and low. These levels can be used as key pivots or key liquidity areas. You can also adjust the time to also use the correct Mon range for forex pairs.
As you can see on the chart, that is how the levels show up on the chart.

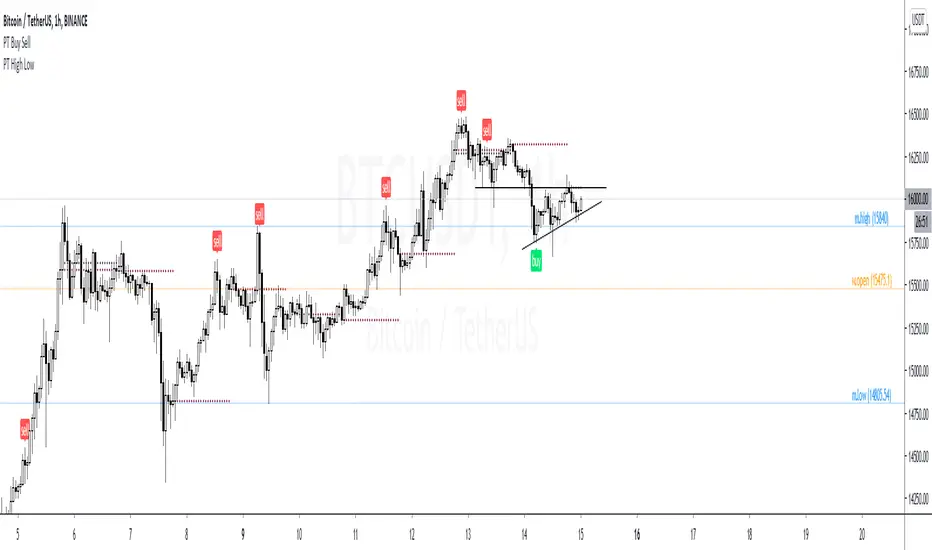
PT High Low Version 1.0 of our PT High Low indicator helps create a visual for the Daily, Weekly, Monthly & Yearly range. These levels will give you an idea of where the price can react if reached. Consider them pivotal areas. We included a toggle that will help you go between the candle's High/Low to the candle's Open/Close. Both features are unique when scalping & swinging. The High/Low will paint a beautiful visual for your day to day trading & the Open/Close will help you determine where price maxed opened & closed for that specified timeframe.
Strategy:
Price tends to gravitate between the Daily level when playing intraday scalps. If playing the weekly, you want to be above the weekly pivot to punt longs & under the weekly level to punt shorts. More likely than not, when the price hits a monthly or yearly level, we get a noticeable reaction off it.
This Oscillator was built around our buy sell indicator & it is used on all time frames for swinging & scalping. It is included as part of the library. Just message us for access!
Static + Dynamic LevelsShows static and dynamic levels which can act as support/resistance. These are important as there is a lot of users who are interested in buying/selling at these prices.
Static Levels include -
Daily/Weekly/Monthly/Yearly Open (changes color depending on if below or above price)
Previous Daily/Weekly/Monthly/Yearly Open
Previous day's High/Low
Dynamic Levels include -
100/200 Daily MA
100/200 Weekly MA

BT D/W/M SeparatorsThis will print vertical lines for Daily/Weekly/Monthly open and close times. Also highlighting the days of the week including weekends for the crypto lovers :-)
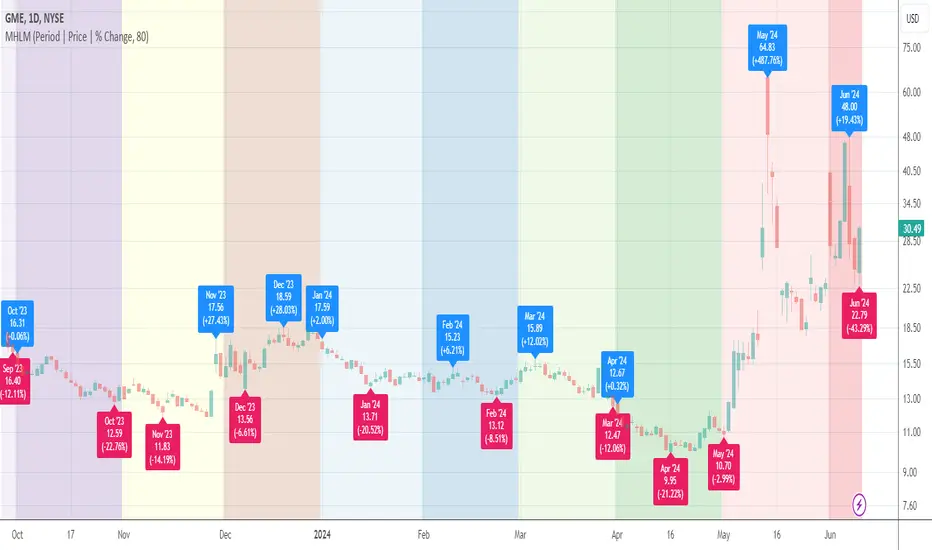
Monthly High/Low MarksThis utility tool marks the highest and the lowest price of each month on the chart. Works everywhere and doesn't use any calls of built-in functions which are used for a data extraction.
Labels provide additional information about closing price and % change for a particular month and allow micro customizations.
Month Open Price LevelThis tool plots a dynamic level that represents the opening price of each month.
Labels provide additional information about closing price and % change for a particular month and allow micro customizations.


Weekly Monthly Yearly Open LevelsThis script displays the weekly, monthly, and yearly opens for the last few periods.
I added an option to extend the previous opens to the current period as well.

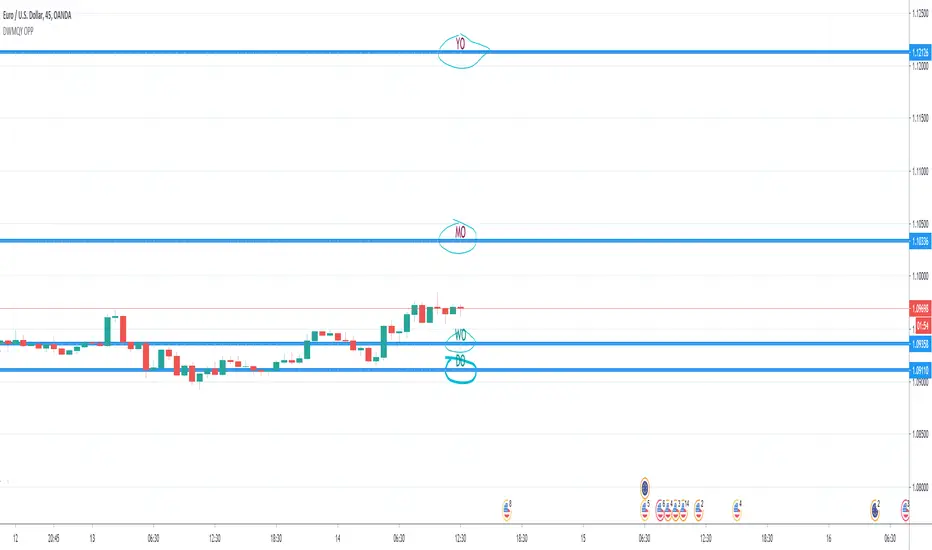
Day & Week & Month & Quarter & Year Open Price PointsPresent to your attention, basic “Day & Week & Month & Quarter & Year Open Price Points Indicator” !
You can determine support & resistance using Yearly, Quarterly, Monthly and Weekly open price points on a chart with any timeframe.
It is not a widely used technique, but according to different academic studies, levels are reliable. Google it! You can enhance your trading by adding that technique in your tool list.
At the current stage, Indicator shows Open Price Points.
Opening price points are extended into the future from the opening candle of each year, quarter, month and week and day.
By nature of that points, every level may be used as a support and as a resistance level at a similar time.
Initial setup:
1) Open the indicator Inputs settings, enable/disable additional Price Points.
2) Open the indicator Style settings, click on a style of each line and click on a “Price Line.”
How to use that?
With a lot of available strategies, there are two leading: Level convergence and Trend line convergence.
1) Level convergence involves locating two or more opening points that merge. This confluence can lead to greater accuracy and profitability.
2) Trend line convergence - The intersection of a trend line at a weekly, monthly, quarterly or even yearly opening level can produce fast and profitable reactions.
Try that!
As a stand-alone strategy, you can utilize that:
Price action under the WO (DO, MO, QO, YO) – Bearish
Price action above the WO (DO, MO, QO, YO) – Bullish
TIP: opening level not always good as a stand-alone tool!
Indicator Settings:
Show Daily Open (disabled by default)
Show Weekly Open (ON by default)
Show Monthly Open (ON by default)
Show Quarter Open (disabled by default)
Show Yearly Open (disabled by default)
Indicator Styling:
By default, each line is shown in the form of circles, line-width 1, silver colour.
Labels can be only in one of two states: Maroon (if open price less than ((open + high + low + close)/4) or Teal (if open price high than ((open + high + low + close)/4).
Alerts:
With the Indicator you can add a few different alerts:
DO Alert
WO Alert
MO Alert
QO Alert
YO Alert
Play with it:
Add a new alert with following condition: your SYMBOL crossing DWMQY OPP Weekly Open.
Options: Once per Bar.
Future of the Indicator:
The Indicator is a necessary part of more prominent Indicator which will include 8 modules in total:
2~ Arabian Wise Tunnels Module
3~ RH Waves Module (something like Vegas Waves)
4~ Trend Channels Module
5~ Opening Range Zoning Module
6~ Breakout Module
7~ BS Hemisphere Module
8~ Price Action Module
DISCLAIMER! RISK WARNING!
PAST PERFORMANCE IS NOT NECESSARILY INDICATIVE OF FUTURE RESULTS. TRADERS SHOULD NOT BASE THEIR DECISION ON INVESTING IN ANY TRADING PROGRAM SOLELY ON THE PAST PERFORMANCE PRESENTED, ADDITIONALLY, IN MAKING AN INVESTMENT DECISION, TRADERS MUST ALSO RELY ON THEIR OWN EXAMINATION OF THE PERSON OR ENTITY MAKING THE TRADING DECISIONS.
//Written by iambitboy request.
D/W/M/Y OpenThis is just a small Script
It show you:
Low and high of
Yesterday, last week, last month and last year
+
Open today

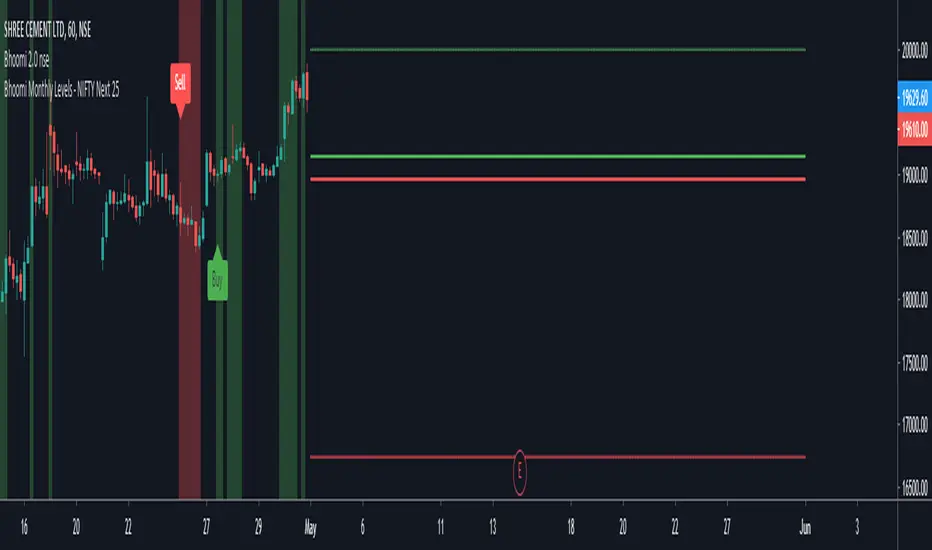
Bhoomi Monthly Levels - NIFTY Next 25This is a custom indicator which assists with monthly levels of Next25 stocks of NIFTY 50.
Bhoomi Monthly Levels - NIFTY 25This is a custom indicator which assists with monthly levels of first 25 stocks of NIFTY 50.

Yearly Weekly Monthly Monday Levels This script displays the Open, High, Low and Mid ranges for Yearly levels, Monthly levels, Weekly levels, and Monday range levels (useful support and resistance levels)
Opens are displayed in dashed lines, and mid-levels in dotted lines. Other lines (highs and lows) are in plain lines.
Each color represent a time horizon:
- Red: Yearly levels
- White: Monthly levels
- Yellow: Weekly levels
Colors are changeable (even though color inputs are not still available in Version 4 of TradingView PineScript).

Levels Compound v.2Daily, weekly, monthly support and resistance levels. Also paints 2 different daily WMAs and the daily weekly monthly avg.

Oasis Group - VWAP / OHLC (Daily / Weekly / Monthly)
5min with the Daily overlay
4hour with the Weekly overly
This Script was influenced be Chris Moody's OHLC Script.
I have created my version of the script and used it to Overlay Daily/Weekly/Monthly Candles over any chosen Intraday Time Frame.
**Important**
The "Stepline" Line style function in pine script is defective so anyone who wants to use this must change all line
styles to "Stepline" manually except for the VWAP Line.
This gives traders a great overall candle experience and also insight into the noise of the intraday.
Intraday traders can keep watch of the highs and Lows along with open and close levels for the larger time frames chosen.
Give us a Follow and Like. This can be used on any Asset class.
I personally use this on Intraday Trading.
Helps me Identify the Prior day Highs and Lows, Closing price compared to the next mornings Opening Price, and daily, weekly, or monthly ranges.
Also included is the powerful VWAP indicator for identifying bullish or bearish pysche.
