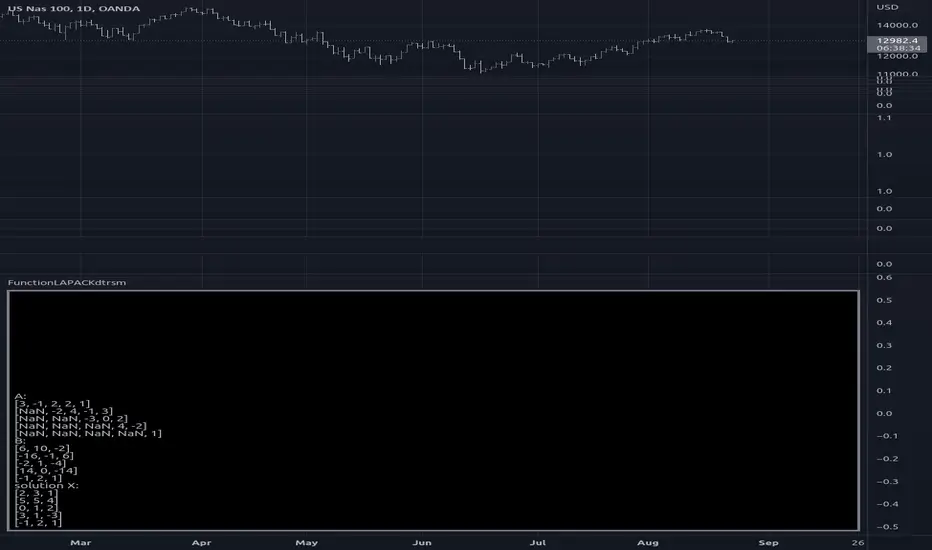
FunctionLAPACKdtrsmLibrary "FunctionLAPACKdtrsm"
subroutine in the LAPACK:linear algebra package, used to solve one of the following matrix equations:
op( A )*X = alpha*B, or X*op( A ) = alpha*B,
where alpha is a scalar, X and B are m by n matrices, A is a unit, or
non-unit, upper or lower triangular matrix and op( A ) is one of
op( A ) = A or op( A ) = A**T.
The matrix X is overwritten on B.
reference:
netlib.org
dtrsm(side, uplo, transa, diag, m, n, alpha, a, lda, b, ldb)
solves one of the matrix equations
op( A )*X = alpha*B, or X*op( A ) = alpha*B,
where alpha is a scalar, X and B are m by n matrices, A is a unit, or
non-unit, upper or lower triangular matrix and op( A ) is one of
op( A ) = A or op( A ) = A**T.
The matrix X is overwritten on B.
Parameters:
side : string , On entry, SIDE specifies whether op( A ) appears on the left or right of X as follows:
SIDE = 'L' or 'l' op( A )*X = alpha*B.
SIDE = 'R' or 'r' X*op( A ) = alpha*B.
uplo : string , specifies whether the matrix A is an upper or lower triangular matrix as follows:
UPLO = 'U' or 'u' A is an upper triangular matrix.
UPLO = 'L' or 'l' A is a lower triangular matrix.
transa : string , specifies the form of op( A ) to be used in the matrix multiplication as follows:
TRANSA = 'N' or 'n' op( A ) = A.
TRANSA = 'T' or 't' op( A ) = A**T.
TRANSA = 'C' or 'c' op( A ) = A**T.
diag : string , specifies whether or not A is unit triangular as follows:
DIAG = 'U' or 'u' A is assumed to be unit triangular.
DIAG = 'N' or 'n' A is not assumed to be unit triangular.
m : int , the number of rows of B. M must be at least zero.
n : int , the number of columns of B. N must be at least zero.
alpha : float , specifies the scalar alpha. When alpha is zero then A is not referenced and B need not be set before entry.
a : matrix, Triangular matrix.
lda : int , specifies the first dimension of A.
b : matrix, right-hand side matrix B, and on exit is overwritten by the solution matrix X.
ldb : int , specifies the first dimension of B.
Returns: void, modifies matrix b.
usage:
dtrsm ('L', 'U', 'N', 'N', 5, 3, 1.0, a, 7, b, 6)
Matrix
Correlation with Matrix TableCorrelation coefficient is a measure of the strength of the relationship between two values. It can be useful for market analysis, cryptocurrencies, forex and much more.
Since it "describes the degree to which two series tend to deviate from their moving average values" (1), first of all you have to set the length of these moving averages. You can also retrieve the values from another timeframe, and choose whether or not to ignore the gaps.
After selecting the reference ticker, which is not dependent from the chart you are on, you can choose up to eight other tickers to relate to it. The provided matrix table will then give you a deeper insight through all of the correlations between the chosen symbols.
Correlation values are scored on a scale from 1 to -1
A value of 1 means the correlation between the values is perfect.
A value of 0 means that there is no correlation at all.
A value of -1 indicates that the correlation is perfectly opposite.
For a better view at a glance, eight level colors are available and it is possible to modify them at will. You can even change level ranges by setting their threshold values. The background color of the matrix's cells will change accordingly to all of these choices.
The default threshold values, commonly used in statistics, are as follows:
None to weak correlation: 0 - 0.3
Weak to moderate correlation: 0.3 - 0.5
Moderate to high correlation: 0.5 - 0.7
High to perfect correlation: 0.7 - 1
Remember to be careful about spurious correlations, which are strong correlations without a real causal relationship.
(1) www.tradingview.com

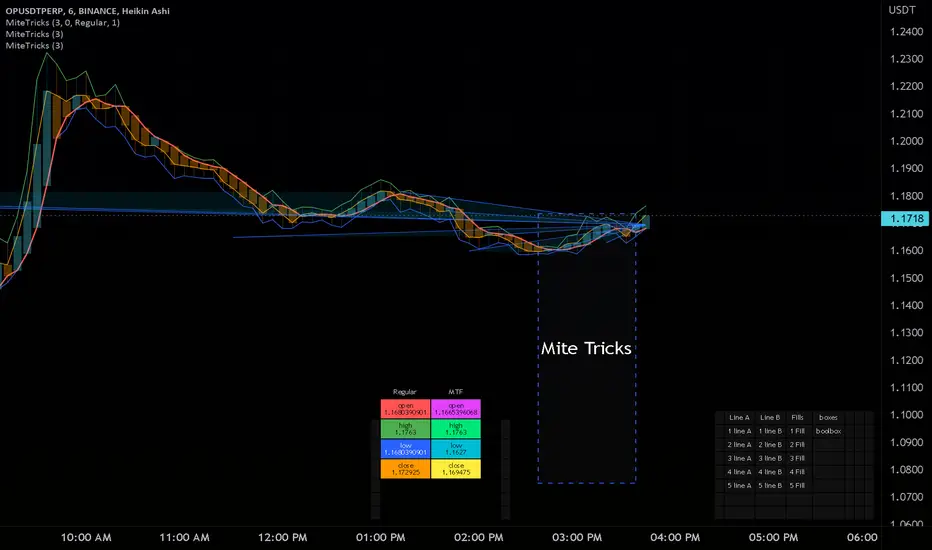
MiteTricksLibrary "MiteTricks"
Matrix Global Registry.
Get, Set, automatic growing, universal get/set,
multi-matrix dictionaries, multi-dictionary matrixes..
add slice matrixes of any type, share one common global key registry
pull up an item from a category, and item name ie a table of info.
same cell needs a color, a size, a string, a value, etc..
all of which can be pulled up with the same group id, and key id.
just swap which matrix you pull the value from.
this has a side benefit of non-repainting and recalculating
when pulling values, changing inputs..
makes for very fast/clean usage..
benefit :
floats = value
strings = names
lines = drawn items
table =table of data items for this key
colors = color for line/table/fill,label..
all of those can be pulled with "get(_VALUES,_groupIDX,_keyIDX)" where only the values matrix needs be swapped, and the same item/coordinates remains for all the possible matrixes that item appears in.
also useful as a dictionary/registry for any given type of item,,
and goes very handy with floats/strings/colors/bools with my matrixautotable
very helpful when prototyping or doing development work as a shortcut.
initRegistry()
Registry inititalizer
Returns: registry of string matrix type
newbool(optional, optional, optional)
create bool type new matrix presized 2x2 for reg
Parameters:
optional: row size
optional: column size
optional: fill value(default is bool (na)
Returns: bool matrix of specified size and fill, or blank 2x2 for registry use
newbox(optional, optional, optional)
create box type new matrix presized 2x2 for reg
Parameters:
optional: row size
optional: column size
optional: fill value(default is box (na)
Returns: box matrix of specified size and fill, or blank 2x2 for registry use
newcolor(optional, optional, optional)
create color type new matrix presized 2x2 for reg
Parameters:
optional: row size
optional: column size
optional: fill value(default is color (na)
Returns: color matrix of specified size and fill, or blank 2x2 for registry use
newfloat(optional, optional, optional)
create float type new matrix presized 2x2 for reg
Parameters:
optional: row size
optional: column size
optional: fill value(default is float (na)
Returns: float matrix of specified size and fill, or blank 2x2 for registry use
newint(optional, optional, optional)
create int type new matrix presized 2x2 for reg
Parameters:
optional: row size
optional: column size
optional: fill value(default is int (na)
Returns: int matrix of specified size and fill, or blank 2x2 for registry use
newlabel(optional, optional, optional)
create label type new matrix presized 2x2 for reg
Parameters:
optional: row size
optional: column size
optional: fill value(default is label (na)
Returns: label matrix of specified size and fill, or blank 2x2 for registry use
newline(optional, optional, optional)
create line type new matrix presized 2x2 for reg
Parameters:
optional: row size
optional: column size
optional: fill value(default is line (na)
Returns: line matrix of specified size and fill, or blank 2x2 for registry use
newlinefill(optional, optional, optional)
create linefill type new matrix presized 2x2 for reg
Parameters:
optional: row size
optional: column size
optional: fill value(default is linefill(na)
Returns: linefill matrix of specified size and fill, or blank 2x2 for registry use
newstring(optional, optional, optional)
create string type new matrix presized 2x2 for reg
Parameters:
optional: row size
optional: column size
optional: fill value(default is string (na)
Returns: string matrix of specified size and fill, or blank 2x2 for registry use
newtable(optional, optional, optional)
create table type new matrix presized 2x2 for reg
Parameters:
optional: row size
optional: column size
optional: fill value(default is table (na)
Returns: table matrix of specified size and fill, or blank 2x2 for registry use
newfrom(INIT_FILL)
newfrom Matrix full of item input
Parameters:
INIT_FILL: item to fill (2x2) the matri and set type. a type(na) works
addrow(m, v)
addrow Add new row to matrix
Parameters:
m: matrix of type being added to
v: value of type being added to ( best leave NA on string for registry purposes)
addcolumn(matrix, value)
addcolumn
Parameters:
matrix: of type being added to
value: of type being added to ( best leave NA on string for registry purposes)
get(_VALS, _KEYREG, _GROUP, _KEY)
get Grabs value and returns single item
Parameters:
_VALS: Matrix Values slice
_KEYREG: Registry values matrix (strings)
_GROUP: name of group/category or int group key
_KEY: name of item to fetch from value registry or int key id
Returns: item
get(_VALS, _GROUP, _KEY)
get Grabs value and returns single item
Parameters:
_VALS: Matrix Values slice
_GROUP: name of group/category
_KEY: name of item to fetch from value registry
getgid(_KEYREG, _GROUP)
getgid
Parameters:
_KEYREG: Reg to pull group id from
_GROUP: group index int, or string name to get the other missing type
getkid(_KEYREG, _GROUP, _KEY)
getkid
Parameters:
_KEYREG: Reg to pull Key id from
_GROUP: group index int, or string name
_KEY: index of string key id to get it's ID int
getkey(_KEYREG, _GROUP, _KEY)
getkey
Parameters:
_KEYREG: Reg to pull Key id from
_GROUP: group index int, or string name for getting key string
_KEY: index of string key id to get it's match of other type
set(_VALS, _KEYREG, _GROUP, _KEY, _value)
set items to reg and matrix container
Parameters:
_VALS: Values matrix container
_KEYREG: Key registry
_GROUP: (string) Group/Category name
_KEY: (string) Key for item
_value: item
Returns: void
del(_VALS, _KEYREG, _GROUP, _KEY)
del grroup id
Parameters:
_VALS: Matrix Values slice
_KEYREG: Registry values matrix (strings)
_GROUP: name of group/category
_KEY: name of item to Delete from values and key
detached(_GROUP, _KEY, _VALUE)
detached make detached registry/val matrix
Parameters:
_GROUP: Name of first group
_KEY: Name of first item
_VALUE: Item of any type, sets the output type too.
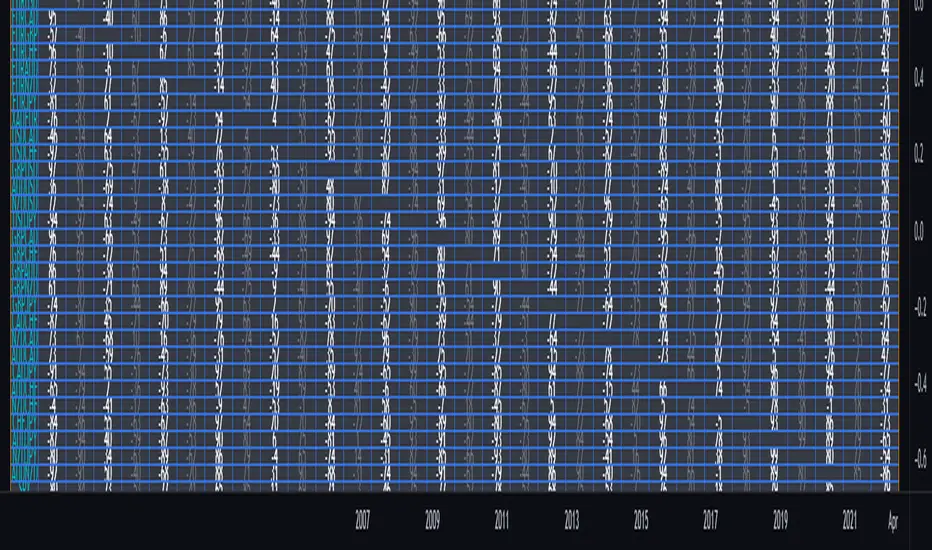
Greater Currency Correlation Matrix (Forex)Other available matrixes I found have a limited number of forex symbols. Consequentially, you need to keep switching them if you want to do a proper analysis. As a result of that, I produced my own currency matrix.
Correlation studies relationships between different price charts.
High correlation may be completely random in the short term, but it may signify a fundamental relationship between the two symbols if calculated over the long term.
For example, the currency of an oil-producing country may rally along with oil, whereas the importer's currency may drop. This means that watching the oil price chart may be worth it for such pairs.
The script includes all Major and Minor pairs with the addition of Gold (XAUEUR) and two optional symbols.
▬▬▬▬
To avoid too frequent use of security(), I decided to calculate all symbol values from EUR pairs. It should improve performance and keep room for some additional symbols in the future.
Please report any bugs.
functionStringToMatrixLibrary "functionStringToMatrix"
Provides unbound methods (no error checking) to parse a string into a float or int matrix.
to_matrix_float(str, interval_sep, start_tk, end_tk)
Parse a string into a float matrix.
Parameters:
str : , string, the formated string to parse.
interval_sep : , string, cell interval separator token.
start_tk : , string, row start token.
end_tk : , string, row end token.
Returns: matrix, parsed float matrix.
to_matrix_int(str, interval_sep, start_tk, end_tk)
Parse a string into a int matrix.
Parameters:
str : , string, the formated string to parse.
interval_sep : , string, cell interval separator token.
start_tk : , string, row start token.
end_tk : , string, row end token.
Returns: matrix, parsed int matrix.

"Swap" - Bool/Position/Value : Array / Matrix / Var AutoswapLibrary "swap"
Side / Boundary Based All Types Swapper
- three automagical types for Arrays, Matrixes, and Variables
-- no signal : Long/ Short position autoswap
-- true / false : Boolean based side choice
-- Src / Thresh : if source is above or below the threshold
- two operating modes for variables, Holding mode only for arrays/matrixes
-- with two items, will automatically change between the two caveat is it does not delete table/box/line(fill VAR items automatically)
-- with three items, a neutral is available for NA input or neutral
- one function name for all of them. One import name that's easy to type/remember
-- make life easy for your conditional items.
side(source, thresh, _a, _b, _c)
side Change outputs based on position or a crossing level
Parameters:
source : (float) OPTIONAL value input
thresh : (float) OPTIONAL boundary line to cross
_a : (any) if Long/True/Above
_b : (any) if Short/False/Below
_c : (any) OPTIONAL NOT FOR MTX OR ARR... Neutral Item, if var/varip on a/b it will leave behind, ie, a table or box or line will not erase , if it's a varip you're sending in.
Returns: first, second, or third items based on input conditions
Please notify if bugs found.
Thanks.

[LIB] Array / Matrix DisplayLibrary "ArrayMatrixHUD"
Show Array or Matrix Elements In Table
For Arrays: Set the number of rows you want the data displayed in and it will generate a table, calculating the columns based on the size of the array being displayed.
For Matrix: It will automatically match the Rows and Columns to the values in the matrix.
Note: On the left, the table shows the index of the array/matrix value starting at 1. So, to call that value from inside the array, subtract 1 from the index value to the left. For matrices, keep in mind that the row and column are also starting at one when trying to call a value from the matrix. The numbering of the values on the left is for display purposes only.
viewArray(_arrayName, _pos, _txtSize, _tRows)
Array Element Display (Supports float, int, string, and bool)
Parameters:
_arrayName : ID of Array to be Displayed
_pos : Position for Table
_txtSize : Size of Table Cell Text
_tRows : Number of Rows to Display Data In (columns will be calculated accordingly)
Returns: A Display of Array Values in a Table
viewMatrix(_matrixName, _pos, _txtSize)
Matrix Element Display (Supports float, int, string, and bool)
Parameters:
_matrixName : ID of Matrix to be Displayed
_pos : Position for Table
_txtSize : Size of Table Cell Text
Returns: A Display of Matrix Values in a Table

matrixautotableLibrary "matrixautotable"
Automatic Table from Matrixes with pseudo correction for na values and default color override for missing values. uses overloads in cases of cheap float only, with additional addon for strings next, then cell colors, then text colors, and tooltips last.. basic size and location are auto, include the template to speed this up...
TODO : make bools version
var string group_table = ' Table'
var int _tblssizedemo = input.int ( 10 )
string tableYpos = input.string ( 'middle' , '↕' , inline = 'place' , group = group_table, options= )
string tableXpos = input.string ( 'center' , '↔' , inline = 'place' , group = group_table, options= , tooltip='Position on the chart.')
int _textSize = input.int ( 1 , 'Table Text Size' , inline = 'place' , group = group_table)
var matrix _floatmatrix = matrix.new (_tblssizedemo, _tblssizedemo, 0 )
var matrix _stringmatrix = matrix.new (_tblssizedemo, _tblssizedemo, 'test' )
var matrix _bgcolormatrix = matrix.new (_tblssizedemo, _tblssizedemo, color.white )
var matrix _textcolormatrix = matrix.new (_tblssizedemo, _tblssizedemo, color.black )
var matrix _tooltipmatrix = matrix.new (_tblssizedemo, _tblssizedemo, 'tool' )
// basic table ready to go with the aboec matrixes (replace in your code)
// for demo purpose, random colors, random nums, random na vals
if barstate.islast
varip _xsize = matrix.rows (_floatmatrix) -1
varip _ysize = matrix.columns (_floatmatrix) -1
for _xis = 0 to _xsize -1 by 1
for _yis = 0 to _ysize -1 by 1
_randomr = int(math.random(50,250))
_randomg = int(math.random(50,250))
_randomb = int(math.random(50,250))
_randomt = int(math.random(10,90 ))
bgcolor = color.rgb(250 - _randomr, 250 - _randomg, 250 - _randomb, 100 - _randomt )
txtcolor = color.rgb(_randomr, _randomg, _randomb, _randomt )
matrix.set(_bgcolormatrix ,_yis,_xis, bgcolor )
matrix.set(_textcolormatrix ,_yis,_xis, txtcolor)
matrix.set(_floatmatrix ,_yis,_xis, _randomr)
// random na
_ymiss = math.floor(math.random(0, _yis))
_xmiss = math.floor(math.random(0, _xis))
matrix.set( _floatmatrix ,_ymiss, _xis, na)
matrix.set( _stringmatrix ,_ymiss, _xis, na)
matrix.set( _bgcolormatrix ,_ymiss, _xis, na)
matrix.set( _textcolormatrix ,_ymiss, _xis, na)
matrix.set( _tooltipmatrix ,_ymiss, _xis, na)
// import here
import kaigouthro/matrixautotable/1 as mtxtbl
// and render table..
mtxtbl.matrixtable(_floatmatrix, _stringmatrix, _bgcolormatrix, _textcolormatrix, _tooltipmatrix, _textSize ,tableYpos ,tableXpos)
matrixtable(_floatmatrix, _stringmatrix, _bgcolormatrix, _textcolormatrix, _tooltipmatrix, _textSize, tableYpos, tableXpos) matrixtable
Parameters:
_floatmatrix : float vals
_stringmatrix : string
_bgcolormatrix : color
_textcolormatrix : color
_tooltipmatrix : string
_textSize : int
tableYpos : string
tableXpos : string
matrixtable(_floatmatrix, _stringmatrix, _bgcolormatrix, _textcolormatrix, _textSize, tableYpos, tableXpos) matrixtable
Parameters:
_floatmatrix : float vals
_stringmatrix : string
_bgcolormatrix : color
_textcolormatrix : color
_textSize : int
tableYpos : string
tableXpos : string
matrixtable(_floatmatrix, _stringmatrix, _bgcolormatrix, _txtdefcol, _textSize, tableYpos, tableXpos) matrixtable
Parameters:
_floatmatrix : float vals
_stringmatrix : string
_bgcolormatrix : color
_txtdefcol : color
_textSize : int
tableYpos : string
tableXpos : string
matrixtable(_floatmatrix, _stringmatrix, _txtdefcol, _bgdefcol, _textSize, tableYpos, tableXpos) matrixtable
Parameters:
_floatmatrix : float vals
_stringmatrix : string
_txtdefcol : color
_bgdefcol : color
_textSize : int
tableYpos : string
tableXpos : string
matrixtable(_floatmatrix, _txtdefcol, _bgdefcol, _textSize, tableYpos, tableXpos) matrixtable
Parameters:
_floatmatrix : float vals
_txtdefcol : color
_bgdefcol : color
_textSize : int
tableYpos : string
tableXpos : string

Morningstar Equity Style Box HeatmapStyle boxes are a classification scheme created by Morningstar. They visually provide a graphical representation of investing categories for equity investments. A style box is a valuable tool for investors to use when determining asset allocation.
There are 9 categories:
Large Value, Large Blend, Large Growth
Medium Value, Medium Blend, Medium Growth
Small Value, Small Blend, Small Growth
The strength of the 9 categories are found by using 9 Vanguard ETF's that follow the respective CRSP index of their category.

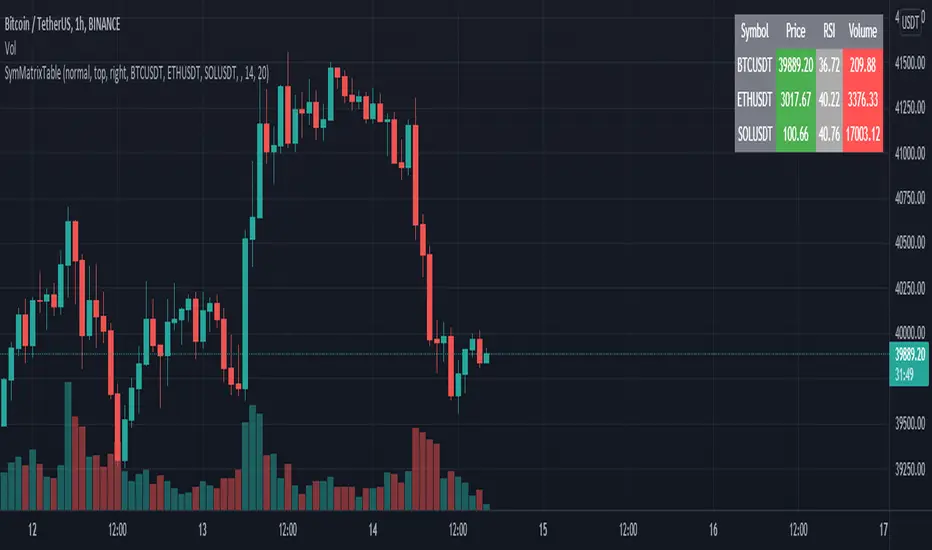
SymMatrixTableSimple Example Table for Displaying Price, RSI, Volume of multiple Tickers on selected Timeframe
Displays Price, RSI and Volume of 3 Tickers and Timeframe selected by user input
Conditional Table Cell coloring
Price color green if > than previous candle close and red if < previous candle close
RSI color green if < 30 and red if > 70 (RSI14 by default)
Volume color green if above average volume and red if less than that (SMA20 volume by default)
Can turn on/off whole table, header columns, row indices, or select individual columns or rows to show/hide
// Example Mixed Type Matrix To Table //
access the simple example script by uncommenting the code at the end
Basically I wanted to have the headers and indices as strings and the rest of the matrix for the table body as floats, then conditional coloring on the table cells
And also the functionality to turn rows and columns on/off from table through checkboxes of user input
Before I was storing each of the values separately in arrays that didn't have a centralized way of controlling table structure
so now the structure is :
- string header array, string index array
- float matrix for table body
- color matrix with bool conditions for coloring table cells
- bool checkboxes for controlling table display
Reshape Table Matrix█ OVERVIEW
Simple method to reshape matrix to table.
Credits to Tradingview for new matrix update.

US Stock Market Sectors Overview Table [By MUQWISHI]US Market Overview Table will identify the bullish and bearish sectors of a day by tracking the SPDR sectors funds.
It's possible to add a ticker symbol for correlation compared to each sector.
Overview Indicator

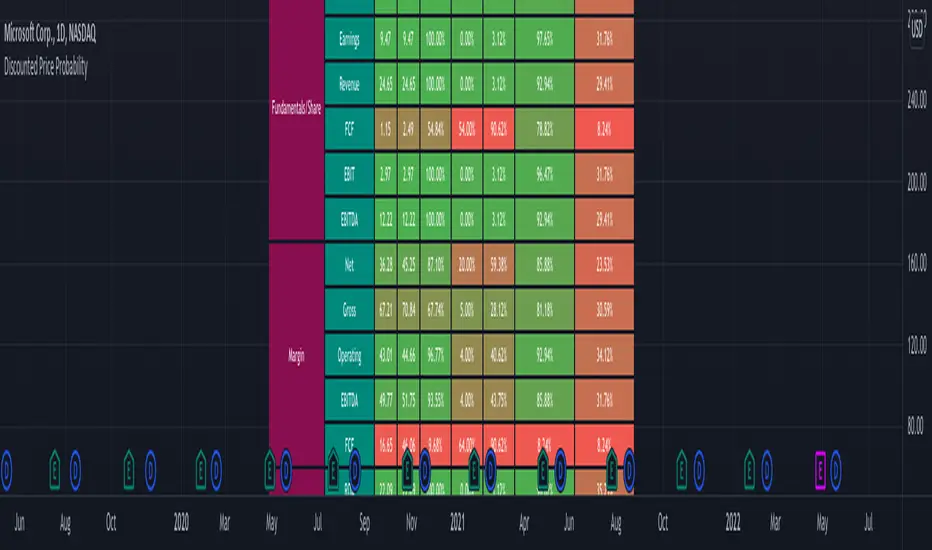
Discounted Price ProbabilityHere is an attempt to understand the probability of discounted price of a stock by comparing it to historical price and fundamental correlation. Have made use of some of the new features of pine in developing this script (Such as matrix and new features of tables such as cell merge and tooltip).
Script makes use of the library written on matrix matrix
🎲 Process
Probability is measured in two angles
🎯 Absolute : Measure the percentile of price and fundamentals with respect to all time high. The difference between the two is measure of probability of stock being undervalued.
🎯 Drawdown : Measure the percentile of distance from all time high for both price and fundamentals. The difference between the two is used for depicting the probability of stock being undervalued.
🎲 Components
In short, the definitions of stats presented are as below
🎲 Settings
Settings are pretty straightforward
🎲 How to look at these stats
To Start with
Are most of the fundamental values coloured in green? If yes, it means that they are near all time high in terms of percentile.
If drawdowns of fundamental values coloured in green? If yes, it means, the stock has not suffered much drawdowns of fundamentals from its peak.
Are the percentile values of drawdowns in green? If yes, it means, that drop in fundamentals are not high compared to its previous values.
If all the above are greener, then it means, company is in strong growth space.
Example: TSLA
Even though the financial ratios of TSLA are not in par with most of the fundamentally strong stocks, it is indeed growing steadily and at its near all time high.
Lets take another example of NKLA
Here the base columns regarding fundamentals are mostly red. This means, company has suffered setback with respect to their financials and the company is not where it used to be. But, if you see the differential probabilities, it says 92% of being undervalued?
Well, this is due to the fact that NKLA's fundamentals suffered most of the time and they are always below par when compared to price. Hence, such kind of cases may interpret the stocks as undervalued. Hence, even if the probability of being undervalued is more, it does not guarantee the quality of the stock. We need to be mindful overall financials of the company and how they fare with general standards.
Moving forward
To understand value of trending stock, use Absolute Probability (marked with P). Ex. GOOG, MSFT, BRK.B etc.
To understand value of stock which has been recently suffered huge price drop, look at drawdown based probability (marked with D). Ex. BABA, FB, PYPL, SQ, ROKU etc.
Some examples of high flyers:
Some for deep pullbacks:
And the meme stocks:
_matrixLibrary "_matrix"
Library helps visualize matrix as array of arrays and enables users to use array methods such as push, pop, shift, unshift etc along with cleanup activities on drawing objects wherever required
unshift(mtx, row) unshift array of lines to first row of the matrix
Parameters:
mtx : matrix of lines
row : array of lines to be inserted in row
Returns: resulting matrix of lines
unshift(mtx, row) unshift array of labels to first row of the matrix
Parameters:
mtx : matrix of labels
row : array of labels to be inserted in row
Returns: resulting matrix labels
unshift(mtx, row) unshift array of boxes to first row of the matrix
Parameters:
mtx : matrix of boxes
row : array of boxes to be inserted in row
Returns: resulting matrix of boxes
unshift(mtx, row) unshift array of linefill to first row of the matrix
Parameters:
mtx : matrix of linefill
row : array of linefill to be inserted in row
Returns: resulting matrix of linefill
unshift(mtx, row) unshift array of tables to first row of the matrix
Parameters:
mtx : matrix of tables
row : array of tables to be inserted in row
Returns: resulting matrix of tables
unshift(mtx, row) unshift array of int to first row of the matrix
Parameters:
mtx : matrix of int
row : array of int to be inserted in row
Returns: resulting matrix of int
unshift(mtx, row) unshift array of float to first row of the matrix
Parameters:
mtx : matrix of float
row : array of float to be inserted in row
Returns: resulting matrix of float
unshift(mtx, row) unshift array of bool to first row of the matrix
Parameters:
mtx : matrix of bool
row : array of bool to be inserted in row
Returns: resulting matrix of bool
unshift(mtx, row) unshift array of string to first row of the matrix
Parameters:
mtx : matrix of string
row : array of string to be inserted in row
Returns: resulting matrix of string
unshift(mtx, row) unshift array of color to first row of the matrix
Parameters:
mtx : matrix of colors
row : array of colors to be inserted in row
Returns: resulting matrix of colors
push(mtx, row) push array of lines to end of the matrix row
Parameters:
mtx : matrix of lines
row : array of lines to be inserted in row
Returns: resulting matrix of lines
push(mtx, row) push array of labels to end of the matrix row
Parameters:
mtx : matrix of labels
row : array of labels to be inserted in row
Returns: resulting matrix of labels
push(mtx, row) push array of boxes to end of the matrix row
Parameters:
mtx : matrix of boxes
row : array of boxes to be inserted in row
Returns: resulting matrix of boxes
push(mtx, row) push array of linefill to end of the matrix row
Parameters:
mtx : matrix of linefill
row : array of linefill to be inserted in row
Returns: resulting matrix of linefill
push(mtx, row) push array of tables to end of the matrix row
Parameters:
mtx : matrix of tables
row : array of tables to be inserted in row
Returns: resulting matrix of tables
push(mtx, row) push array of int to end of the matrix row
Parameters:
mtx : matrix of int
row : array of int to be inserted in row
Returns: resulting matrix of int
push(mtx, row) push array of float to end of the matrix row
Parameters:
mtx : matrix of float
row : array of float to be inserted in row
Returns: resulting matrix of float
push(mtx, row) push array of bool to end of the matrix row
Parameters:
mtx : matrix of bool
row : array of bool to be inserted in row
Returns: resulting matrix of bool
push(mtx, row) push array of string to end of the matrix row
Parameters:
mtx : matrix of string
row : array of string to be inserted in row
Returns: resulting matrix of string
push(mtx, row) push array of colors to end of the matrix row
Parameters:
mtx : matrix of colors
row : array of colors to be inserted in row
Returns: resulting matrix of colors
shift(mtx) shift removes first row from matrix of lines
Parameters:
mtx : matrix of lines from which the shift operation need to be performed
Returns: void
shift(mtx) shift removes first row from matrix of labels
Parameters:
mtx : matrix of labels from which the shift operation need to be performed
Returns: void
shift(mtx) shift removes first row from matrix of boxes
Parameters:
mtx : matrix of boxes from which the shift operation need to be performed
Returns: void
shift(mtx) shift removes first row from matrix of linefill
Parameters:
mtx : matrix of linefill from which the shift operation need to be performed
Returns: void
shift(mtx) shift removes first row from matrix of tables
Parameters:
mtx : matrix of tables from which the shift operation need to be performed
Returns: void
shift(mtx) shift removes first row from matrix of int
Parameters:
mtx : matrix of int from which the shift operation need to be performed
Returns: void
shift(mtx) shift removes first row from matrix of float
Parameters:
mtx : matrix of float from which the shift operation need to be performed
Returns: void
shift(mtx) shift removes first row from matrix of bool
Parameters:
mtx : matrix of bool from which the shift operation need to be performed
Returns: void
shift(mtx) shift removes first row from matrix of string
Parameters:
mtx : matrix of string from which the shift operation need to be performed
Returns: void
shift(mtx) shift removes first row from matrix of colors
Parameters:
mtx : matrix of colors from which the shift operation need to be performed
Returns: void
pop(mtx) pop removes last row from matrix of lines
Parameters:
mtx : matrix of lines from which the pop operation need to be performed
Returns: void
pop(mtx) pop removes last row from matrix of labels
Parameters:
mtx : matrix of labels from which the pop operation need to be performed
Returns: void
pop(mtx) pop removes last row from matrix of boxes
Parameters:
mtx : matrix of boxes from which the pop operation need to be performed
Returns: void
pop(mtx) pop removes last row from matrix of linefill
Parameters:
mtx : matrix of linefill from which the pop operation need to be performed
Returns: void
pop(mtx) pop removes last row from matrix of tables
Parameters:
mtx : matrix of tables from which the pop operation need to be performed
Returns: void
pop(mtx) pop removes last row from matrix of int
Parameters:
mtx : matrix of int from which the pop operation need to be performed
Returns: void
pop(mtx) pop removes last row from matrix of float
Parameters:
mtx : matrix of float from which the pop operation need to be performed
Returns: void
pop(mtx) pop removes last row from matrix of bool
Parameters:
mtx : matrix of bool from which the pop operation need to be performed
Returns: void
pop(mtx) pop removes last row from matrix of string
Parameters:
mtx : matrix of string from which the pop operation need to be performed
Returns: void
pop(mtx) pop removes last row from matrix of colors
Parameters:
mtx : matrix of colors from which the pop operation need to be performed
Returns: void
clear(mtx) clear clears the matrix of lines
Parameters:
mtx : matrix of lines which needs to be cleared
Returns: void
clear(mtx) clear clears the matrix of labels
Parameters:
mtx : matrix of labels which needs to be cleared
Returns: void
clear(mtx) clear clears the matrix of boxes
Parameters:
mtx : matrix of boxes which needs to be cleared
Returns: void
clear(mtx) clear clears the matrix of linefill
Parameters:
mtx : matrix of linefill which needs to be cleared
Returns: void
clear(mtx) clear clears the matrix of tables
Parameters:
mtx : matrix of tables which needs to be cleared
Returns: void
clear(mtx) clear clears the matrix of int
Parameters:
mtx : matrix of int which needs to be cleared
Returns: void
clear(mtx) clear clears the matrix of float
Parameters:
mtx : matrix of float which needs to be cleared
Returns: void
clear(mtx) clear clears the matrix of bool
Parameters:
mtx : matrix of bool which needs to be cleared
Returns: void
clear(mtx) clear clears the matrix of string
Parameters:
mtx : matrix of string which needs to be cleared
Returns: void
clear(mtx) clear clears the matrix of colors
Parameters:
mtx : matrix of colors which needs to be cleared
Returns: void
FunctionMatrixSolveLibrary "FunctionMatrixSolve"
Matrix Equation solution for Ax = B, finds the value of x.
solve(A, B) Solves Matrix Equation for Ax = B, finds value for x.
Parameters:
A : matrix, Square matrix with data values.
B : matrix, One column matrix with data values.
Returns: matrix with X, x = A^-1 b, assuming A is square and has full rank
introcs.cs.princeton.edu

FunctionPatternDecompositionLibrary "FunctionPatternDecomposition"
Methods for decomposing price into common grid/matrix patterns.
series_to_array(source, length) Helper for converting series to array.
Parameters:
source : float, data series.
length : int, size.
Returns: float array.
smooth_data_2d(data, rate) Smooth data sample into 2d points.
Parameters:
data : float array, source data.
rate : float, default=0.25, the rate of smoothness to apply.
Returns: tuple with 2 float arrays.
thin_points(data_x, data_y, rate) Thin the number of points.
Parameters:
data_x : float array, points x value.
data_y : float array, points y value.
rate : float, default=2.0, minimum threshold rate of sample stdev to accept points.
Returns: tuple with 2 float arrays.
extract_point_direction(data_x, data_y) Extract the direction each point faces.
Parameters:
data_x : float array, points x value.
data_y : float array, points y value.
Returns: float array.
find_corners(data_x, data_y, rate) ...
Parameters:
data_x : float array, points x value.
data_y : float array, points y value.
rate : float, minimum threshold rate of data y stdev.
Returns: tuple with 2 float arrays.
grid_coordinates(data_x, data_y, m_size) transforms points data to a constrained sized matrix format.
Parameters:
data_x : float array, points x value.
data_y : float array, points y value.
m_size : int, default=10, size of the matrix.
Returns: flat 2d pseudo matrix.

ArrayMultipleDimensionPrototypeLibrary "ArrayMultipleDimensionPrototype"
A prototype library for Multiple Dimensional array methods
index_md_to_1d()
new_float(dimensions, initial_size) Creates a variable size multiple dimension array.
Parameters:
dimensions : int array, dimensions of array.
initial_size : float, default=na, initial value of the array.
Returns: float array
dimensions(id, value) set value of a element in a multiple dimensions array.
Parameters:
id : float array, multiple dimensions array.
value : float, new value.
Returns: float.
get(id) get value of a multiple dimensions array.
Parameters:
id : float array, multiple dimensions array.
Returns: float.
set(id) set value of a element in a multiple dimensions array.
Parameters:
id : float array, multiple dimensions array.
Returns: float.

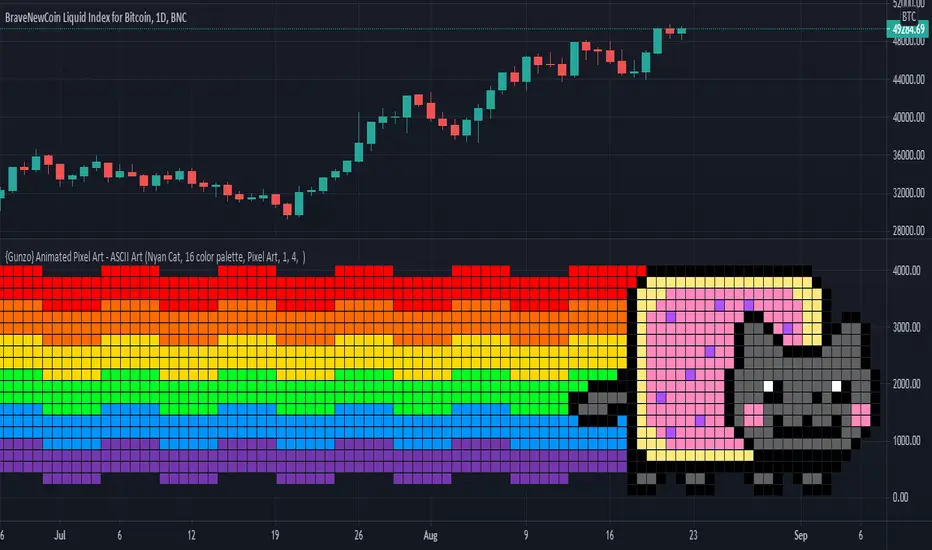
{Gunzo} Animated Pixel Art - ASCII ArtAnimated Pixel Art - ASCII Art is not only an easy-to-use platform to create and visualize pixel animations. This script can also be used with the Nyan Cat visualization as a companion tool for all traders to know when the price is changing on the chart.
OVERVIEW :
In the first place, this tool has been created to celebrate the new design of the Trading View platform. The new monogram logo and the previous cloud logo can be displayed as pixel art within this script.
To test the limits of the pine script language, I tried to improve this simple pixel art script to be able to display complex pixel animations with good performance (max allowed 100 milliseconds per bar). That's how the Nyan Cat companion was created. Nyan Cat is moving every time the data on the chart is refreshed, so the animation time may differ depending on your environment. Only the pixels that changed between two animations are repainted on each loop so that the performance is significantly improved and allowing so to create bigger pixel art designs.
HOW IT WORKS :
The pixels are displayed on the chart using a huge table variable. Each cell of the table can be used to display one pixel of the initial matrix. New designs can easily be implemented as the pixel matrix is stored as a simple text variable.
The pixel matrix is composed of hexadecimal characters (0123456789ABCDEF). Each hexadecimal character correspond to a color in the 16 color palette.
SETTINGS :
Matrix Visual : Name of the pixel art matrix to be displayed
Matrix Colors : Palette to be used for painting the pixels. 16 color palette for colorful matrix or phosphor colors for retro aspect on simple pixel art.
Type of art : Pixel art paint square pixels on chart and ASCII art paints hexadecimal characters on a chart.
Pixel Grid color : Color used between each pixel, by default it is transparent.
Pixel Width : Change the aspect ratio of the matrix. Useful to fine-tune the size of the pixels according to your screen size and the script size.
Pixel Height : Change the aspect ratio of the matrix. Useful to fine-tune the size of the pixels according to your screen size and the script size.
ASCII Background Character : Character that will be replaced with no color
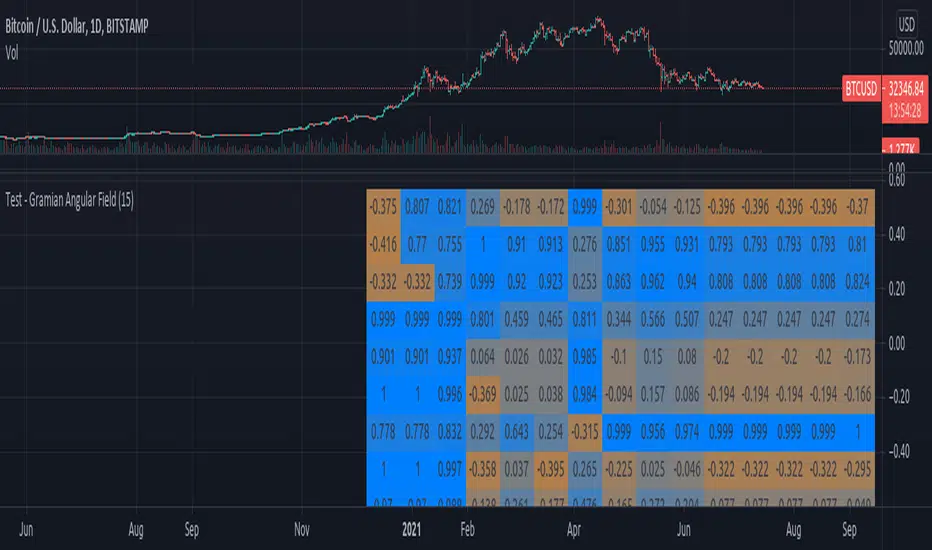
Test - Gramian Angular FieldExperimental:
The Gramian Angular Field is usually used in machine learning for machine vision, it allows the encoding of data as a visual queue / matrix.
Directional Matrix [LuxAlgo]Returns a dashboard showing the direction taken by 4 overlay indicators, SMA (simple moving average), TMA (triangular moving average), WMA (weighted moving average), and REG (linear regression), all using different length periods.
The user can select the minimum and maximum length of these indicators and introduce an increment.
1. Settings
Maximum Length: The end value of sequences of the indicator periods to analyze
Minimum Length: The starting value of sequences of the indicator periods to analyze
Step: Determines the spacing between each indicator periods values
Src: Data source for each of the 4 indicators
1.1 Style settings
Normalized Change Mode: Allows the user to access a different interpretation of the indicator by showing the normalized first differences of each indicator in the dashboard instead of their sign
Dashboard Location: Location of the dashboard on the chart
Dashboard Size: Size of the dashboard on the chart
Text/Frame Color: Determines the color of the frame grid as well as the text color
Bullish Cell Color: Determines the color of cell associated with a rising indicator direction
Bearish Cell Color: Determines the color of cell associated with a decreasing indicator direction
Cell Transparency: Transparency of each cell
2. Usage
Each of the indicators included in the dashboard aim to give an estimate of the underlying trend in the price. Knowing which direction they are taking can help us have a broader view regarding the direction of shorter/longer-term trends. We will later see that this is not the only kind of information that we can get from this indicator.
Rising indicators are represented by blue cells (or the color selected in the Bullish Cell Color setting) while decreasing indicators are represented by red cells (or the color selected in the Bearish Cell Color setting).
The percentage of bullish cells is given in the top-left cell of the dashboard.
2.1 Normalized change mode
Enabling the Normalized Change mode will display the normalized changes returned by the indicators over different length periods. This metric is within a range (0,1), with 1 indicating the highest change over the selected length periods, while 0 indicates the lowest one.
When enabling this mode the color of the cells makes use of a gradient with a color palette ranging from the color selected in the Bearish Cell setting to the color selected in the Bullish Cell setting.
2.1 Other Usage
The direction taken by certain indicators can give more information than one would think. Indeed, the sign of the change of one indicator can often be given by different indicators.
A positive change in a simple moving average indicates that the price is greater than the price p bars ago, where p is the period of the simple moving average.
A positive change in a triangular moving average indicates that a simple moving average of period p is above a simple moving average of period p × 2 , where p is the period of the triangular moving average (note that we assume here that the TMA is given by cascading two SMAs of period p ).
A positive change in a weighted moving average indicates that the price is above a simple moving average of period p+1 , where p is the period of the WMA.
Finally, a positive change in a linear regression indicates that a weighted moving average is above a simple moving average of period p , where p is the period of the linear regression.


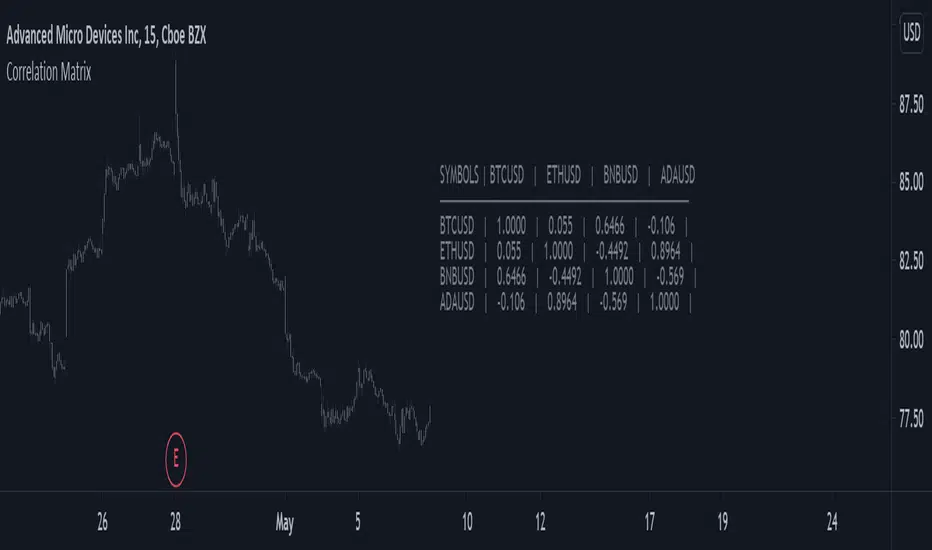
Correlation MatrixReturns a 4x4 correlation matrix between various user-selected symbols. Users can change the window of the correlation with the setting length .
Correlation matrices can be useful to see the linear relationship between various symbols, this is an important tool for diversification.
Matrix Library (Linear Algebra, incl Multiple Linear Regression)What's this all about?
Ever since 1D arrays were added to Pine Script, many wonderful new opportunities have opened up. There has been a few implementations of matrices and matrix math (most notably by TradingView-user tbiktag in his recent Moving Regression script: ). However, so far, no comprehensive libraries for matrix math and linear algebra has been developed. This script aims to change that.
I'm not math expert, but I like learning new things, so I took it upon myself to relearn linear algebra these past few months, and create a matrix math library for Pine Script. The goal with the library was to make a comprehensive collection of functions that can be used to perform as many of the standard operations on matrices as possible, and to implement functions to solve systems of linear equations. The library implements matrices using arrays, and many standard functions to manipulate these matrices have been added as well.
The main purpose of the library is to give users the ability to solve systems of linear equations (useful for Multiple Linear Regression with K number of independent variables for example), but it can also be used to simulate 2D arrays for any purpose.
So how do I use this thing?
Personally, what I do with my private Pine Script libraries is I keep them stored as text-files in a Libraries folder, and I copy and paste them into my code when I need them. This library is quite large, so I have made sure to use brackets in comments to easily hide any part of the code. This helps with big libraries like this one.
The parts of this script that you need to copy are labeled "MathLib", "ArrayLib", and "MatrixLib". The matrix library is dependent on the functions from these other two libraries, but they are stripped down to only include the functions used by the MatrixLib library.
When you have the code in your script (pasted somewhere below the "study()" call), you can create a matrix by calling one of the constructor functions. All functions in this library start with "matrix_", and all constructors start with either "create" or "copy". I suggest you read through the code though. The functions have very descriptive names, and a short description of what each function does is included in a header comment directly above it. The functions generally come in the following order:
Constructors: These are used to create matrices (empy with no rows or columns, set shape filled with 0s, from a time series or an array, and so on).
Getters and setters: These are used to get data from a matrix (like the value of an element or a full row or column).
Matrix manipulations: These functions manipulate the matrix in some way (for example, functions to append columns or rows to a matrix).
Matrix operations: These are the matrix operations. They include things like basic math operations for two indices, to transposing a matrix.
Decompositions and solvers: Next up are functions to solve systems of linear equations. These include LU and QR decomposition and solvers, and functions for calculating the pseudo-inverse or inverse of a matrix.
Multiple Linear Regression: Lastly, we find an implementation of a multiple linear regression, including all the standard statistics one can expect to find in most statistical software packages.
Are there any working examples of how to use the library?
Yes, at the very end of the script, there is an example that plots the predictions from a multiple linear regression with two independent (explanatory) X variables, regressing the chart data (the Y variable) on these X variables. You can look at this code to see a real-world example of how to use the code in this library.
Are there any limitations?
There are no hard limiations, but the matrices uses arrays, so the number of elements can never exceed the number of elements supported by Pine Script (minus 2, since two elements are used internally by the library to store row and column count). Some of the operations do use a lot of resources though, and as a result, some things can not be done without timing out. This can vary from time to time as well, as this is primarily dependent on the available resources from the Pine Script servers. For instance, the multiple linear regression cannot be used with a lookback window above 10 or 12 most of the time, if the statistics are reported. If no statistics are reported (and therefore not calculated), the lookback window can usually be extended to around 60-80 bars before the servers time out the execution.
Hopefully the dev-team at TradingView sees this script and find ways to implement this functionality diretly into Pine Script, as that would speed up many of the operations and make things like MLR (multiple linear regression) possible on a bigger lookback window.
Some parting words
This library has taken a few months to write, and I have taken all the steps I can think of to test it for bugs. Some may have slipped through anyway, so please let me know if you find any, and I'll try my best to fix them when I have time to do so. This library is intended to help the community. Therefore, I am releasing the library as open source, in the hopes that people may improving on it, or using it in their own work. If you do make something cool with this, or if you find ways to improve the code, please let me know in the comments.
