Auto-DCF & Margin of Safety Auto-DCF & Margin of Safety
Overview This indicator bridges the gap between Fundamental Value Investing and Technical Trading. It automatically calculates a company's Intrinsic Value using a Discounted Cash Flow (DCF) model and identifies high-probability entry points by combining a "Margin of Safety" price level with technical momentum indicators (RSI) and structural price corrections (Elliott Wave context).
Key Features
Automated Financial Data: Pulls the latest Free Cash Flow (TTM) and Shares Outstanding directly from the company's financial reports.
Customizable DCF Model: Allows you to input your own assumptions for Growth Rate, Discount Rate (WACC), and Terminal Multiples to tailor the valuation to your thesis.
Confluence Trading: Only signals a "BUY" when three conditions align:
Price is below your specified Margin of Safety.
RSI is oversold (Momentum is bottoming).
Price acts as a Deep Retracement from recent highs (mimicking Elliott Wave corrective structures).
Dynamic Visuals: Draws a visual "BUY BOX" on the chart that calculates the exact % Discount to Fair Value in real-time.
How It Works
1. The Valuation (Fundamental): The script runs a 10-year DCF simulation. It projects future cash flows based on your growth inputs, discounts them back to today's value, and adds a Terminal Value. This creates a "Fair Value" line (Grey Circles).
2. The Buy Zone (Safety): It calculates a "Margin of Safety" line (Green Line) based on the percentage discount you require (e.g., 30% below Fair Value).
3. The Trigger (Technical): The Buy Box appears only when price creates a confluence event: It is undervalued (Fundamental) AND oversold (Technical).
How to Use
Select a Stock: Apply this indicator to any stock ticker (Note: Does not work on Crypto/Forex as they lack Cash Flow data).
Input Assumptions: Open settings and input your expected Growth Rate (e.g., 10%) and Discount Rate (e.g., 10%). Crucial: The output is only as good as your growth assumptions.
Wait for the Box: Look for the Green "BUY" box. The text inside will tell you exactly how deeply discounted the stock is relative to your valuation (e.g., "45% Discount").
Visual Customization
Fully customizable colors for the text and background box.
Adjustable text size to make signals clear on any screen resolution.
Disclaimer This tool is for educational purposes only. Automated financial data can sometimes be delayed or incomplete. Always verify financial figures with official company reports before investing.
Marginofsafety

Stock metrics and valueThis indicator shows:
- the valuation metrics for a stock on a table on top right: PE, EPS, dividend, ROIC, ROE, ROA, EPS growth, FCF growth, Equity growth, revenue Growth
- the fair value and the value with 50% margin of safety as chart lines
The lines will be red when they are above the current price and red when they are below the current price.
The colors on the table will be red when the values are below 10% and green when they are above, that means when everything is green the metrics for the stock are good.

Fair value and MOSShowing the fair value and margin of safety for a Stock.
Works best with 12 months timeframe.
The calculations are based on historical data for multiple years, up to 10 years.
You will see the following as numbers at the indicator line:
- Forward EPS Growth in %
- Forward PE Calculated
- Forward PE Estimated
The two lines will be shown in green if they are above the current price and in red if the price is bellow the lines.
- The upper line shows the fair value of the stock, calculated with 15% (or 4x in 10 years) expected EPS growth for your investment.
- The lower line shows the margin of safety, calculated at 50% of the fair value.
You can adjust the values at "Forward EPS Growth in %" and "Expected future PE" in order to show your fair price and the price with margin of safety.

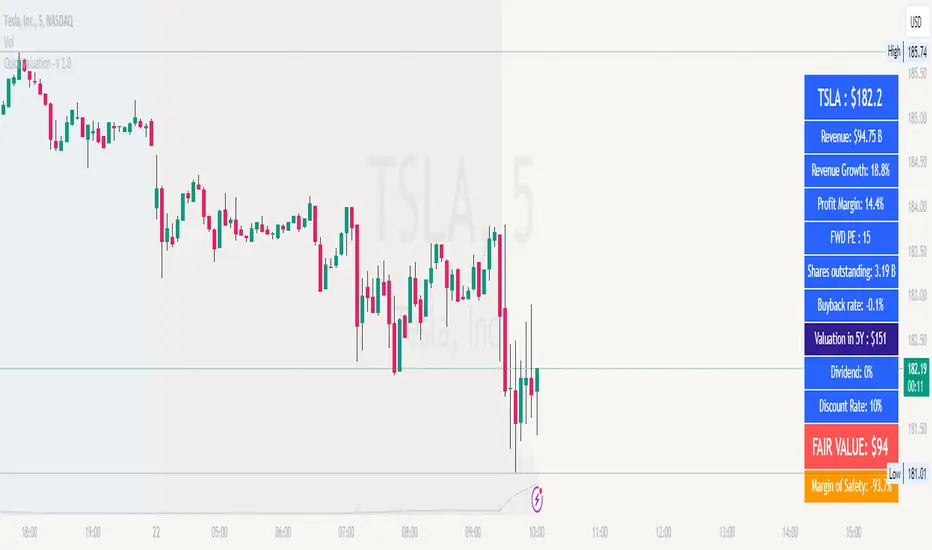
Fair Value Calculator V 1.0Fair Value Calculator V 1.0
This indicator calculates the fair value of a stock based on the revenue growth rate and net profit margin of a company, providing a quick estimate of its intrinsic worth. The calculation takes into account:
Current Revenue: The company's current revenue
5-Year Growth Rate: Expected revenue annual growth rate (CAGR) over the next 5 years
Average PE Ratio: The average Price-to-Earnings ratio for the next 5 years
Average Profit Margin: The average profit margin for the next 5 years
Share Outstanding: The total number of shares outstanding
Yearly Share Buyback Rate: The percentage of shares bought back by the company each year
Discount Rate: The rate used to calculate the present value of the fair value
Using these inputs, the indicator estimates the fair value of the stock, providing a valuable tool for investors and traders to make informed decisions.
Note: all values can be adjusted by the user by entering the desired value and selecting the item in the setup menu.
How it works
The indicator calculates the future revenue based on the current revenue and the expected revenue annual growth rate (CAGR).
It then estimates the future earnings using the average profit margin.
The future price is calculated using the exit value of the PE ratio.
The present value of the fair value is calculated using the discount rate.
The indicator adjusts the fair value based on the yearly share buyback rate.
Benefits
Provides a quick but valuable estimate of a stock's fair value based on the revenue growth and the expected profit.
Helps investors and traders identify undervalued or overvalued stocks.
Allows users to adjust inputs to suit their own assumptions and scenarios.
Note
This indicator is for informational purposes only and should not be considered as investment advice. Always do your own research and consider multiple perspectives before making investment decisions.