Daily Bias Trade Manager [MarkitTick]💡 The Daily Bias Trade Manager is a sophisticated technical analysis suite designed to automate the identification of high-probability intraday setups based on liquidity concepts and structural shifts. By synthesizing Previous Day High/Low (PDH/PDL) interactions with momentum confirmation and strict risk management protocols, this tool assists traders in navigating the "Daily Bias." It moves beyond simple signal generation by offering a complete trade management visualization system, projecting entries, stop losses, and take-profit levels directly onto the chart in real-time.
✨ Originality and Utility
This script distinguishes itself by integrating institutional price action theory—specifically Liquidity Sweeps and Change in State of Delivery (CISD)—with mechanical filtering. While many indicators simply highlight highs and lows, the Daily Bias Trade Manager validates these levels by analyzing what happens *after* price tests them.
It solves a common problem for intraday traders: "Analysis Paralysis." By automating the detection of structure breaks (MSS) and Fair Value Gaps (FVG) following a sweep of daily liquidity, it provides an objective framework for entry. Furthermore, the built-in "Position Box" feature removes the guesswork from trade execution by instantly calculating risk-to-reward ratios and visualizing them, allowing traders to see the feasibility of a trade before execution.
🔬 Methodology and Concepts
The core logic operates on a sequential detection model:
Liquidity Identification: The script first plots the Previous Day High (PDH) and Previous Day Low (PDL). These are critical institutional reference points where stop-loss orders (liquidity) often reside.
The Sweep: A "Sweep" is confirmed when price breaches a PDH/PDL but fails to sustain the breakout, closing back inside the previous day's range. This suggests a "Fake-out" or liquidity grab, often a precursor to a reversal.
Change in State of Delivery (CISD): Following a sweep, the script monitors local market structure. It looks for a decisive close past a recent swing point (Swing High for shorts, Swing Low for longs) within a user-defined bar window. This confirms that the counter-trend move has momentum.
Confluence Filtering: To reduce false positives, the engine applies optional filters:
RVOL (Relative Volume): Ensures the sweep occurred on significant volume (Climax behavior).
RSI Momentum: Verifies that momentum supports the reversal direction.
Trend Filter: Uses a long-term EMA to ensure trades align with the broader market direction.
Entry Model: Upon validation, the script calculates an entry at the close (or optionally at a Fair Value Gap), places a Stop Loss at the sweep extreme, and projects three Take Profit targets based on configurable R:R ratios.
🎨 Visual Guide
The indicator uses a distinct color-coded system to keep the chart clean yet informative:
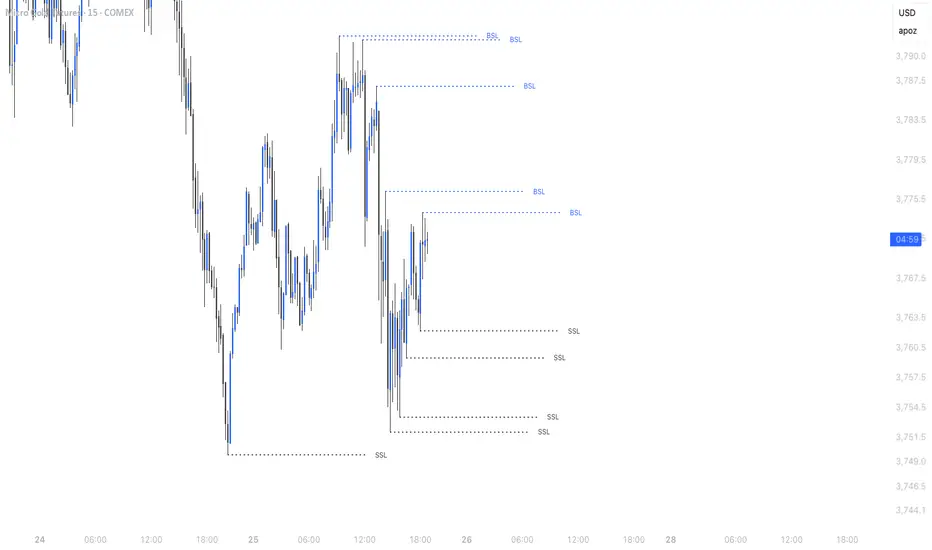
● Liquidity Levels & Sweeps
Orange/Blue Lines: Represent the PDH (Previous Day High) and PDL (Previous Day Low).
Teal Shaded Zones: Indicate a "Buy-Side Sweep" (Price took highs and rejected).
Red Shaded Zones: Indicate a "Sell-Side Sweep" (Price took lows and rejected).
● Position Management Boxes
When a signal triggers, a structured box appears:
Solid Gray Line: The theoretical Entry Price.
Solid Red Line: The Stop Loss (SL), typically placed at the swing high/low of the sweep.
Dashed Blue Lines: Represent TP1, TP2, and TP3 targets based on Reward-to-Risk settings.
Labels: Data tags on the right side of the box show exact price coordinates for Entry, SL, and Targets.
● Signals & Clouds
Green "BUY" Labels: Appear below the bar when a bullish sweep and structural shift are confirmed.
Red "SELL" Labels: Appear above the bar when a bearish sweep is validated.
Yellow Clouds: Highlight Fair Value Gaps (FVG) used for entry confluence or retests.
● Multi-Timeframe (MTF) Dashboard
A panel (default: Top Right) displays the status of up to three higher timeframes.
Trend: Shows "BULL" or "BEAR" based on EMA alignment.
Liquidity: Indicates if the timeframe is "Taking Buy Liq", "Taking Sell Liq", or "Inside Range".
📖 How to Use
● Bullish Reversal Setup
Wait for price to drop below the Blue PDL Line.
Look for a Red Sell-Side Sweep Zone to form, indicating price has rejected lower prices.
Wait for the Green BUY Signal . This confirms a shift in structure (CISD) back to the upside.
Observe the Position Box. If the Risk/Reward is favorable (targets are within reasonable reach), consider the trade.
Optional: Use the "Dynamic Targets" setting to target the previous swing high instead of a fixed ratio.
● Bearish Reversal Setup
Wait for price to rally above the Orange PDH Line.
Look for a Teal Buy-Side Sweep Zone .
Wait for the Red SELL Signal confirming the rejection.
Ensure the dashboard shows alignment (e.g., Higher Timeframe Trend is Bearish) for higher probability.
● Trade Management
Enable the "ATR Trailing Stop" in settings to have the Stop Loss line dynamically adjust as price moves in your favor, locking in potential gains.
⚙️ Inputs and Settings
● General & Display
Show Daily Liquidity: Toggles the PDH/PDL lines.
Max Signals/Zones: Limits the visual clutter by restricting historical shapes.
● Detection Logic
Swing Detection Length: Controls the sensitivity of pivot points. Higher numbers = fewer, more significant swings.
CISD Window: How many bars after a sweep are allowed for the structure shift to occur.
Use FVG Entry: If true, the signal waits for a retest of a gap rather than entering immediately at the close.
● Filters
Volume (RVOL): Requires the sweep candle volume to be X times larger than average.
Trend Filter: Only allows Buy signals above the EMA and Sell signals below it.
Session Filter: Restricts signals to specific hours (e.g., New York Killzone).
● Targets & Management
Target R:R: Sets the multiplier for TP1, TP2, TP3 relative to the stop loss distance.
Use Dynamic Targets: Targets structural liquidity (Previous Highs/Lows) instead of fixed math ratios.
ATR Trailing Stop: Activates the trailing stop mechanism.
🔍 Deconstruction of the Underlying Scientific and Academic Framework
This indicator is grounded in the principles of Market Microstructure and Mean Reversion theory .
1. Liquidity Pools & Stop Runs:
Academic literature on market microstructure suggests that order flow clusters around obvious visual references (PDH/PDL). Large market participants often utilize this "resting liquidity" to fill large block orders with minimal slippage. The "Sweep" logic detects this absorption phase.
2. Volatility Breakout vs. Fake-out:
The script differentiates between a genuine breakout and a mean-reverting "fake-out" by analyzing the Close relative to the Range . A close back within the prior day's range after a breach signifies a failure of auction in the new territory, statistically increasing the probability of a reversion to the mean (equilibrium).
3. Momentum Validation (RSI & RVOL):
By integrating Relative Volume (RVOL) and RSI, the script applies statistical significance testing to the price action. High volume at a range extreme without price progress (the sweep) indicates "Stopping Volume" or absorption, a key concept in Volume Spread Analysis (VSA).
🙏 Gratitude
I would like to express my gratitude to harry040708 for sharing the insightful idea that made this script possible.
⚠️ Disclaimer
All provided scripts and indicators are strictly for educational exploration and must not be interpreted as financial advice or a recommendation to execute trades. I expressly disclaim all liability for any financial losses or damages that may result, directly or indirectly, from the reliance on or application of these tools. Market participation carries inherent risk where past performance never guarantees future returns, leaving all investment decisions and due diligence solely at your own discretion.
Indikator Pine Script®