Reduced-Lag Chande Momentum Oscillator [BOSWaves]Reduced-Lag Chande Momentum Oscillator – Adaptive Momentum Geometry with Reduced-Latency Reversion Logic
Overview
The Reduced-Lag Chande Momentum Oscillator represents a sophisticated extension of the classical Chande Momentum Oscillator, preserving the foundational measurement of net directional pressure while addressing inherent limitations in lag, noise, and signal clarity. The traditional CMO provides reliable snapshots of upward versus downward force but reacts slowly to rapid market accelerations and can obscure meaningful momentum inflections with delayed readings. This iteration integrates a dual-stage reduced-lag filter, optional advanced smoothing, and acceleration-based analytics, producing a real-time, multi-dimensional representation of market momentum.
The design reframes classical momentum using a layered curvature and gradient structure - main, midline, and shadow - to show trajectory, velocity, and intensity in one view. Instead of the usual ±70/30 extremes, it uses ±50 as a statistically grounded threshold where one side of the market begins exerting true dominance. This captures structural imbalance more reliably, exposing exhaustion and actionable inflection without amplifying noise.
This visualization gives traders a continuous, responsive read on market structure, revealing not just direction but rate of change, acceleration alignment, and curvature behavior. The oscillator becomes a momentum map, expressing both probability and intensity behind directional shifts.
Where conventional oscillators mislabel short-lived swings as signals, the Reduced-Lag CMO separates baseline shifts from high-conviction transitions, enabling cleaner, more decisive signal interpretation.
Theoretical Foundation
The classical Chande Momentum Oscillator, created by Tushar Chande, calculates the normalized net difference between consecutive upward and downward price changes over a defined window, generating readings from –100 to +100. While effective for capturing basic directional pressure, the unmodified CMO suffers from signal latency and sensitivity to abrupt market swings, which can obscure actionable inflection points.
The Reduced-Lag CMO augments this foundation with three key mechanisms:
Reduced-Lag Filtering : A dual-EMA structure eliminates inertial lag, aligning the oscillator curve closely with real-time market momentum without producing overshoot artifacts.
Smoothing Architecture : Optional SMA, EMA, or WMA smoothing is applied post-filter, balancing noise reduction with trajectory fidelity. A multi-layer line system (shadow → midline → main) communicates depth, curvature, and gradient dynamics.
Acceleration Integration : First and second derivatives of the smoothed curve quantify velocity and acceleration, allowing the indicator to identify not only momentum flips but the force behind each shift, forming the basis for the strong-signal overlay.
The combination of these mechanisms produces an oscillator that respects the original CMO framework while delivering real-time, context-sensitive intelligence. The ±50 boundaries are selected as the statistically validated pressure zones where directional dominance exceeds neutral oscillation. Crosses and rejections at these boundaries are not arbitrary overbought/oversold events, but measurable imbalances with actionable significance.
How It Works
The Reduced-Lag CMO is constructed through a multi-stage process:
Momentum Estimation Core : Raw CMO values are calculated and then passed through a reduced-lag filter to remove delay, creating a curve that closely tracks instantaneous directional pressure.
Smoothing & Layered Representation : The filtered curve can be smoothed and split into three layers - shadow, midline, and main - giving visual depth, trajectory clarity, and curvature instead of a single-line oscillator.
Gradient-Based Pressure Mapping : Color gradients encode momentum strength and polarity. Green-yellow transitions highlight increasing upward dominance, while red-yellow transitions indicate weakening downward force.
Pressure-Zone Anchoring (±50) : The system defines statistically significant pressure zones at ±50. Moves beyond these levels reflect dominant directional control, and rejections inside the zone signal potential exhaustion.
Signal Generation : Momentum events are evaluated through velocity and acceleration. Standard signals appear as triangle markers indicating validated momentum flips. Strong signals appear as triangles with diamonds when acceleration confirms a high-conviction transition.
A cooldown rule spaces signals apart to reduce clutter and emphasize structurally meaningful events.
Interpretation
The Reduced-Lag CMO reframes momentum as a dynamic equilibrium between directional force and structural pressure:
Positive Momentum Phases : Curves above zero with green-yellow gradients indicate sustained upward pressure. Shallow retracements or midline tests denote controlled pullbacks.
Negative Momentum Phases : Curves below zero with red-yellow gradients show downward dominance. Rejections from –50 highlight potential exhaustion and reversal readiness.
Pressure-Zone Dynamics (±50) : Crosses beyond ±50 confirm dominant directional force. Meanwhile, rejections and rotations inside the zone signal structural fatigue.
Velocity & Acceleration Analysis : Rising momentum with decelerating velocity suggests fading force; acceleration alignment amplifies signal strength and forms the basis of strong signals.
Signal Architecture
The Reduced-Lag CMO produces a single event type with two intensities: a validated momentum inflection.
Standard Signals - Triangles:
Triggered by momentum flips confirmed by velocity.
Represent moderate-intensity directional changes.
Appear at zero-line crosses or ±50 rejections with aligned velocity.
Strong Signals Triangles + Diamonds:
Triggered when acceleration confirms the directional change.
Represent high-intensity, high-conviction shifts.
Rare by design; indicate robust momentum inflections.
Cooldown mechanics prevent repeated signals in short succession, emphasizing structural reliability over noise.
Strategy Integration
Trend Confirmation : Align zero-line flips with higher-timeframe directional bias.
Reversal Detection : Strong signals from ±50 zones highlight potential inflection points.
Volatility Assessment : Gradient transitions reveal strengthening or weakening momentum.
Pullback Timing : Multi-layer curvature identifies controlled retracements vs trend exhaustion.
Confluence Mapping : Pair with structure-based indicators to filter signals in context.
Technical Implementation Details
Core Engine : Classical CMO with Ehlers reduced-lag extension
Lag Reduction : Dual EMA filtering
Smoothing : Optional SMA/EMA/WMA post-filter
Multi-Layer Curve : Shadow, midline, main
Signal System : Two-tier momentum-acceleration framework
Pressure Zones : ±50 statistically validated thresholds
Cooldown Logic : Bar-indexed suppression
Gradient Mapping : Encodes magnitude and direction
Alerts : Standard and strong signals
Optimal Application Parameters
Timeframes:
1 - 5 min : Intraday momentum tracking
15 - 60 min : Trend rotations & volatility transitions
4H - Daily : Macro momentum exhaustion & re-accumulation mapping
Suggested Ranges:
CMO Length : 7 - 12
Reduced-Lag Length : 5 - 15
Smoothing : 10 - 20
Cooldown Bars : 5 - 15
Performance Characteristics
High Effectiveness:
Markets with directional pulses & clean pressure transitions
Trending phases with measurable pullbacks
Instruments with stable volatility cycles
Reduced Edge:
Choppy consolidations
Ultra-low volatility environments
Disclaimer
The Reduced-Lag Chande Momentum Oscillator is a professional-grade analytical tool. It is not predictive and carries no guaranteed profitability. Effectiveness depends on asset class, volatility regime, parameter selection, and disciplined execution. Any suggested application timeframes or recommended ranges are guidance only - they are not universally optimal and will not deliver consistent accuracy on every asset or market condition. BOSWaves recommends using it in conjunction with structure, liquidity, and momentum context.
Lagreduction

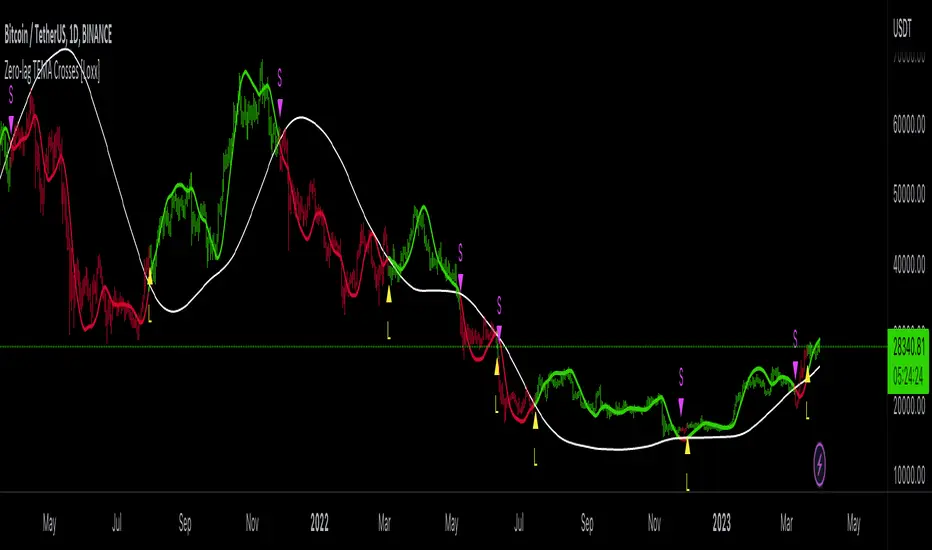
Zero-lag TEMA Crosses [Loxx]Zero-lag TEMA Crosses is a spinoff of a the Zero-lag MA as described by David Stendahl in the April 2000 issue of the journal "Technical Analysis of Stocks and Commodities". This indicator uses TEMA calculation mode in order to make the lag lesser compared to the original Zero-lag MA, and that makes this version even faster than the Zero-lag DEMA too. This indicator is the difference between a Fast and Slow Zero-lag TEMA. This indicator is very useful for lower timeframe scalping.
What is the Zero-lag MA?
The Zero-lag MA (Zero-Lag Moving Average) is a technical indicator that was introduced in the April 2000 issue of the journal "Technical Analysis of Stocks and Commodities" by David Stendahl.
The Zero-lag MA is a type of moving average (MA) that is designed to reduce or eliminate the lag that is typically associated with traditional moving averages. Moving averages are a widely used technical analysis tool that helps traders to identify trends and potential trading opportunities. They work by calculating the average price of a security over a given period of time, and then plotting that average on a chart. The most commonly used moving averages are simple moving averages (SMAs) and exponential moving averages (EMAs).
The problem with traditional moving averages is that they can be slow to respond to changes in market conditions. This lag can cause traders to miss out on potential trading opportunities, or to enter or exit trades at the wrong time. The Zero-lag MA was developed as a solution to this problem.
The Zero-lag MA is calculated using a combination of two EMAs and a subtraction formula. The first step in calculating the Zero-lag MA is to calculate two exponential moving averages: a fast EMA and a slow EMA. The fast EMA is calculated over a shorter period of time than the slow EMA. The exact period lengths will depend on the trader's preferences and the security being analyzed.
Once the two EMAs have been calculated, the next step is to take the difference between them. This difference represents the current market trend, with a positive value indicating an uptrend and a negative value indicating a downtrend. However, this difference alone is not enough to create a useful indicator, as it can still suffer from lag.
To further reduce lag, the difference between the two EMAs is multiplied by a factor derived from a third, slower EMA. This slower EMA acts as a smoothing factor, helping to reduce noise and make the indicator more accurate. The exact period length of the slower EMA will depend on the trader's preferences and the security being analyzed.
The final step in calculating the Zero-lag MA is to add the result of the multiplication to the fast EMA. This produces a final value that represents the current market trend with reduced lag. The Zero-lag MA can be plotted on a chart like any other moving average, and can be used to identify trends, potential trading opportunities, and support and resistance levels.
Overall, the Zero-lag MA is designed to provide traders with a more accurate representation of current market conditions by reducing the lag time between price changes and the moving average. By doing so, it can help traders to make more informed trading decisions and improve their overall profitability.
What is the TEMA?
The triple exponential moving average (TEMA) is a technical analysis indicator that was developed to reduce the lag of traditional moving averages, such as the simple moving average (SMA) or the exponential moving average (EMA). The TEMA was first introduced by Patrick Mulloy in the January 1994 issue of the "Technical Analysis of Stocks and Commodities" magazine.
The TEMA is a type of moving average that is calculated by applying multiple exponential smoothing techniques to price data. Unlike traditional moving averages, which apply a single smoothing factor to price data, the TEMA applies three smoothing factors to produce a more responsive and accurate indicator.
To calculate the TEMA, the following steps are taken:
Calculate the single exponential moving average (SMA) of the price data over a given period.
Calculate the double exponential moving average (DEMA) of the SMA over the same period.
Calculate the triple exponential moving average (TEMA) of the DEMA over the same period.
The formula for calculating the TEMA is:
TEMA = 3 * EMA(SMA) - 3 * EMA(EMA(SMA)) + EMA(EMA(EMA(SMA)))
where EMA is the exponential moving average and SMA is the simple moving average.
The TEMA is designed to reduce the lag associated with traditional moving averages by applying multiple smoothing factors to the price data. This helps to filter out short-term price fluctuations and provide a smoother indicator of the underlying trend. The TEMA is also less susceptible to whipsaws, which occur when a security's price moves in one direction and then quickly reverses, causing false trading signals.
The TEMA can be used in a variety of ways in technical analysis. It can be used to identify trends, determine support and resistance levels, and generate trading signals. When the TEMA is rising, it is generally interpreted as a bullish signal, indicating that the price is trending higher. When the TEMA is falling, it is generally interpreted as a bearish signal, indicating that the price is trending lower.
In summary, the TEMA is a more responsive and accurate indicator than traditional moving averages, designed to reduce lag and provide a smoother representation of the underlying trend. It is a useful tool for technical analysts and traders looking to identify trends, support and resistance levels, and potential trading opportunities.
Extras
Alerts
Bar coloring
Signals
Loxx's Expanded Source Types, see here:
STD/Clutter Filtered, One-Sided, N-Sinc-Kernel, EFIR Filt [Loxx]STD/Clutter Filtered, One-Sided, N-Sinc-Kernel, EFIR Filt is a normalized Cardinal Sine Filter Kernel Weighted Fir Filter that uses Ehler's FIR filter calculation instead of the general FIR filter calculation. This indicator has Kalman Velocity lag reduction, a standard deviation filter, a clutter filter, and a kernel noise filter. When calculating the Kernels, the both sides are calculated, then smoothed, then sliced to just the Right side of the Kernel weights. Lastly, blackman windowing is used for our purposes here. You can read about blackman windowing here:
Blackman window
Advantages of Blackman Window over Hamming Window Method for designing FIR Filter
The Kernel amplitudes are shown below with their corresponding values in yellow:
This indicator is intended to be used with Heikin-Ashi source inputs, specially HAB Median. You can read about this here:
Moving Average Filters Add-on w/ Expanded Source Types
What is a Finite Impulse Response Filter?
In signal processing, a finite impulse response (FIR) filter is a filter whose impulse response (or response to any finite length input) is of finite duration, because it settles to zero in finite time. This is in contrast to infinite impulse response (IIR) filters, which may have internal feedback and may continue to respond indefinitely (usually decaying).
The impulse response (that is, the output in response to a Kronecker delta input) of an Nth-order discrete-time FIR filter lasts exactly {\displaystyle N+1}N+1 samples (from first nonzero element through last nonzero element) before it then settles to zero.
FIR filters can be discrete-time or continuous-time, and digital or analog.
A FIR filter is (similar to, or) just a weighted moving average filter, where (unlike a typical equally weighted moving average filter) the weights of each delay tap are not constrained to be identical or even of the same sign. By changing various values in the array of weights (the impulse response, or time shifted and sampled version of the same), the frequency response of a FIR filter can be completely changed.
An FIR filter simply CONVOLVES the input time series (price data) with its IMPULSE RESPONSE. The impulse response is just a set of weights (or "coefficients") that multiply each data point. Then you just add up all the products and divide by the sum of the weights and that is it; e.g., for a 10-bar SMA you just add up 10 bars of price data (each multiplied by 1) and divide by 10. For a weighted-MA you add up the product of the price data with triangular-number weights and divide by the total weight.
Ultra Low Lag Moving Average's weights are designed to have MAXIMUM possible smoothing and MINIMUM possible lag compatible with as-flat-as-possible phase response.
Ehlers FIR Filter
Ehlers Filter (EF) was authored, not surprisingly, by John Ehlers. Read all about them here: Ehlers Filters
What is Normalized Cardinal Sine?
The sinc function sinc (x), also called the "sampling function," is a function that arises frequently in signal processing and the theory of Fourier transforms.
In mathematics, the historical unnormalized sinc function is defined for x ≠ 0 by
sinc x = sinx / x
In digital signal processing and information theory, the normalized sinc function is commonly defined for x ≠ 0 by
sinc x = sin(pi * x) / (pi * x)
What is a Clutter Filter?
For our purposes here, this is a filter that compares the slope of the trading filter output to a threshold to determine whether to shift trends. If the slope is up but the slope doesn't exceed the threshold, then the color is gray and this indicates a chop zone. If the slope is down but the slope doesn't exceed the threshold, then the color is gray and this indicates a chop zone. Alternatively if either up or down slope exceeds the threshold then the trend turns green for up and red for down. Fro demonstration purposes, an EMA is used as the moving average. This acts to reduce the noise in the signal.
What is a Dual Element Lag Reducer?
Modifies an array of coefficients to reduce lag by the Lag Reduction Factor uses a generic version of a Kalman velocity component to accomplish this lag reduction is achieved by applying the following to the array:
2 * coeff - coeff
The response time vs noise battle still holds true, high lag reduction means more noise is present in your data! Please note that the beginning coefficients which the modifying matrix cannot be applied to (coef whose indecies are < LagReductionFactor) are simply multiplied by two for additional smoothing .
Included
Bar coloring
Loxx's Expanded Source Types
Signals
Alerts
