RSI + KVO TriggerRSI + KVO Trigger is a momentum‑and‑volume indicator that combines a standard RSI with the Klinger Volume Oscillator’s trigger line in the same pane. It helps you see whether price momentum (RSI) and volume‑based money flow (KVO) are confirming each other or starting to diverge, using the same central 50/0 line for quick visual decisions.
-------------------------------
What the indicator shows.
In this script, the RSI 50 line is also the KVO “zero” line, so when:
RSI is above 50, price momentum is bullish.
KVO trigger is above that same line, volume/money flow is bullish.
Either one dipping below the line shows weakening in that dimension.
-------------------------------
Using it for entries.
You can think of the RSI as your main trend/momentum filter and the KVO trigger as confirmation (or a warning) from volume. Typical entry ideas:
Long setups:
RSI above 50 and rising, showing bullish momentum.
KVO trigger also above the midline or crossing up toward/through it, showing volume backing the move.
Extra aggressive: buy on pullbacks where RSI stays above 50 while KVO trigger turns back up above the line after a dip.
Short setups:
RSI below 50 and falling, showing bearish momentum.
KVO trigger below the midline or crossing down through it, showing selling pressure dominating.
Extra aggressive: short on bounces where RSI stays below 50 and KVO trigger rolls back down from near the midline.
-------------------------------------
Using it for exits and trade management.
You can also use the combination to manage open trades, watching for disagreement between price, RSI, and KVO. For example:
Exiting longs:
You’re in a long while RSI is above 50 and KVO trigger is above midline.
If KVO trigger drops below the midline first while RSI is still above 50, it can be an early warning that the trend is losing volume support, so you might tighten stops or scale out.
If RSI then also breaks below 50, that’s stronger confirmation to close the position or be very defensive.
Exiting shorts:
You’re in a short while RSI is below 50 and KVO trigger is below midline.
If KVO trigger pops above the midline ahead of RSI, it can signal selling pressure is fading; consider reducing size or tightening your stop.
A later RSI cross back above 50 can be your hard exit rule.
-------------------------------------
Divergences and “late‑trend” signals.
Because both lines share the same center level, it’s easy to spot situations where price is still trending but one of the components is lagging:
Bullish risk signal:
Price pushes higher, RSI stays above 50, but KVO trigger spends more time below the midline or fails to follow price higher.
This suggests a maturing/uptrend with weaker participation, making new longs riskier and encouraging partial profit‑taking or tighter stops.
Bearish risk signal:
Price makes lower lows, RSI stays below 50, but KVO trigger keeps drifting above the midline.
That can hint at hidden accumulation, where you might be more cautious with new shorts and watch for a trend reversal.
------------------------------------
Used this way, the indicator is not a standalone “buy/sell arrow,” but a structured way to demand agreement between momentum (RSI) and volume (KVO trigger) for entries, and to notice early when that agreement starts to break down for exits or risk management.
Kvo

Klinger Volume Divergence IndicatorA remix of the built-in Divergence Indicator that uses a Klinger Volume Oscillator instead of RSI to help spot divergent patterns in volume activity in relation to price.
Additions:
Basic color coding:
Positive volume (above center line) == buying
- Negative volume (below center line) == selling
Alerts for Bullish, Hidden Bullish, Bearish, and Hidden Bearish signals

Combo Backtest 123 Reversal & Klinger Volume Oscillator This is combo strategies for get a cumulative signal.
First strategy
This System was created from the Book "How I Tripled My Money In The
Futures Market" by Ulf Jensen, Page 183. This is reverse type of strategies.
The strategy buys at market, if close price is higher than the previous close
during 2 days and the meaning of 9-days Stochastic Slow Oscillator is lower than 50.
The strategy sells at market, if close price is lower than the previous close price
during 2 days and the meaning of 9-days Stochastic Fast Oscillator is higher than 50.
Second strategy
The Klinger Oscillator (KO) was developed by Stephen J. Klinger. Learning
from prior research on volume by such well-known technicians as Joseph Granville,
Larry Williams, and Marc Chaikin, Mr. Klinger set out to develop a volume-based
indicator to help in both short- and long-term analysis.
The KO was developed with two seemingly opposite goals in mind: to be sensitive
enough to signal short-term tops and bottoms, yet accurate enough to reflect the
long-term flow of money into and out of a security.
The KO is based on the following tenets:
Price range (i.e. High - Low) is a measure of movement and volume is the force behind
the movement. The sum of High + Low + Close defines a trend. Accumulation occurs when
today's sum is greater than the previous day's. Conversely, distribution occurs when
today's sum is less than the previous day's. When the sums are equal, the existing trend
is maintained.
Volume produces continuous intra-day changes in price reflecting buying and selling pressure.
The KO quantifies the difference between the number of shares being accumulated and distributed
each day as "volume force". A strong, rising volume force should accompany an uptrend and then
gradually contract over time during the latter stages of the uptrend and the early stages of
the following downtrend. This should be followed by a rising volume force reflecting some
accumulation before a bottom develops.
WARNING:
- For purpose educate only
- This script to change bars colors.

Divergence KlingerVolumeOscillator [mado]Divergence screener for KVO
Regular Bullish: "D" navy label
Hidden Bullish: "H" navy label
Regular Bearish: "D" red label
Hidden Bearish: "H" red label

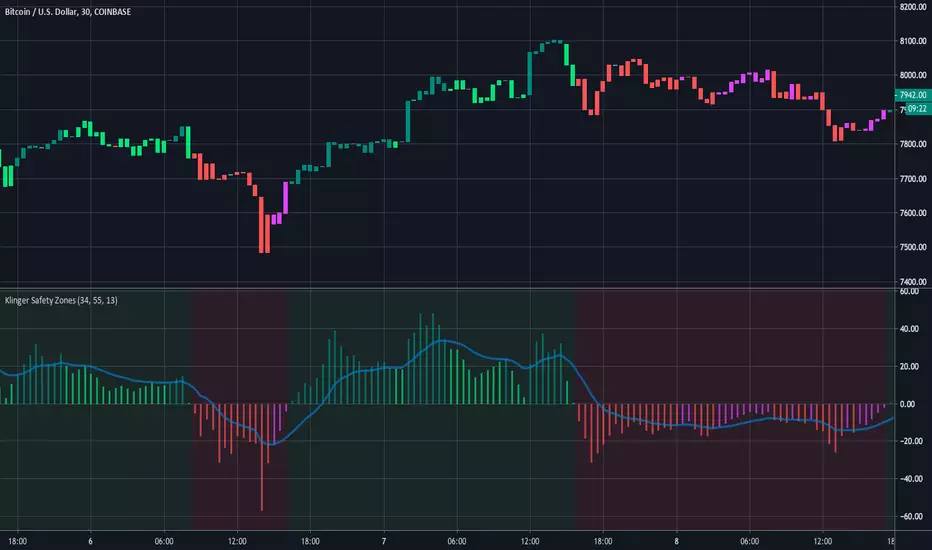
Klinger Safety ZonesThis indicator is based on the Klinger Volume Oscillator, or KVO. The KVO is pretty cool since it can track long-term changes in money flow (both into and out of a market), as well as respond and predict short term price fluctuations.
The Klinger Oscillator determines the direction (or trend) of money flow based on the high, low, and closing price of the security. It then compares all three values (HLC/3) to the previous period’s values to determine how volume should be factored into the KVO. If the current period’s price is greater than that of the previous period, then volume is added. It is subtracted, however, if the price is less than the previous period. This utilization of volume is what makes it an accurate tracker of money flow and a valuable confirmation indicator. This value is often called volume force or the “trend” line.
A fast and slow EMA of the volume force are then calculated. The fast EMA has a smaller window length, while the slow EMA has a larger window. Traders can adjust the lengths of each EMA in the input option menu, but we chose the standard 55 and 34 period lengths as the default settings. We are finally left with the actual KVO value after subtracting the slow EMA from the fast EMA.
The Klinger Oscillator uses a signal line similar to the MACD and many other indicators. The default length for it is 13, but that length can also be adjusted in the input menu. A shorter length will result in more responsiveness but possibly more false signals and whipsaws.
The Chart and Interpretation:
The histogram shows the KVO series. Remember, since the Oscillator represents the difference between the fast and slow EMA, the KVO is bullish when it is greater than zero and bearish when it is less than zero.
When the KVO is greater than zero, the background on the chart is green, meaning that the trend is bullish and traders should look to go long. On the flip side, the background is red when the KVO is less than zero meaning traders should look to go short.
The aqua line plotted on top of the histogram is the signal line.
Here is a quick summary of the histogram colors:
(if KVO > 0 and KVO > signal)
then (color = teal)
if (KVO > 0 and KVO < signal)
then (color = lime)
if (KVO < 0 and KVO < signal)
then (color = red)
if (KVO < 0 and KVO > signal)
then (color = pink)
Users can choose to have the candles change color to match the KVO histogram color by adjusting the setting in the input menu.
~Happy (and safe) trading~
Klinger Volume OscillatorThis indicator was originally developed by Stephen J. Klinger (Stocks & Commodities, V.15:12 (December, 1997): "Identifying Trends with Volume Analysis").
NOTE : this is the only correct version of Klinger Volume Oscillator in the public library.
Like and follow for more open source indicators!
Happy Trading!

Klinger Volume Oscillator (KVO) The Klinger Oscillator (KO) was developed by Stephen J. Klinger. Learning
from prior research on volume by such well-known technicians as Joseph Granville,
Larry Williams, and Marc Chaikin, Mr. Klinger set out to develop a volume-based
indicator to help in both short- and long-term analysis.
The KO was developed with two seemingly opposite goals in mind: to be sensitive
enough to signal short-term tops and bottoms, yet accurate enough to reflect the
long-term flow of money into and out of a security.
The KO is based on the following tenets:
Price range (i.e. High - Low) is a measure of movement and volume is the force behind
the movement. The sum of High + Low + Close defines a trend. Accumulation occurs when
today's sum is greater than the previous day's. Conversely, distribution occurs when
today's sum is less than the previous day's. When the sums are equal, the existing trend
is maintained.
Volume produces continuous intra-day changes in price reflecting buying and selling pressure.
The KO quantifies the difference between the number of shares being accumulated and distributed
each day as "volume force". A strong, rising volume force should accompany an uptrend and then
gradually contract over time during the latter stages of the uptrend and the early stages of
the following downtrend. This should be followed by a rising volume force reflecting some
accumulation before a bottom develops.
