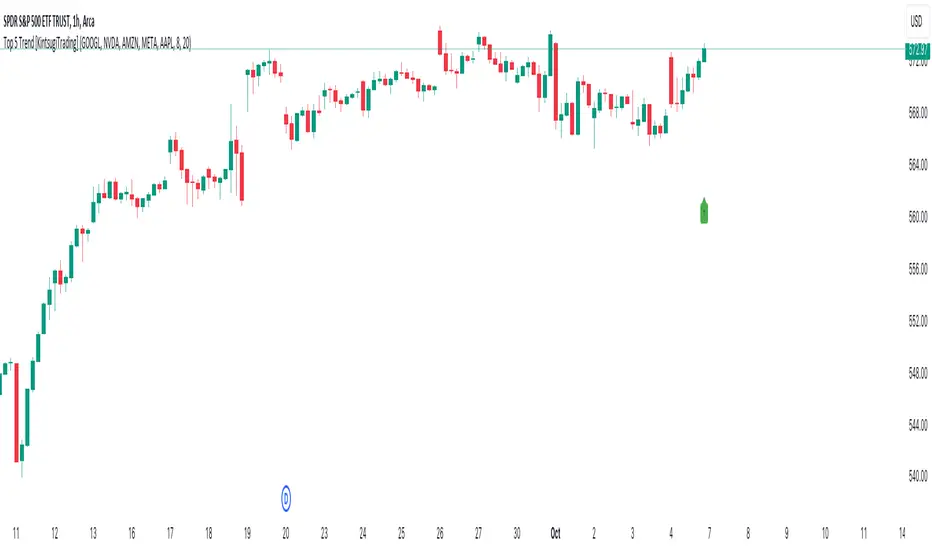
Top 5 Trend [KintsugiTrading]Top 5 Trend
This script provides a visual indicator for tracking the average trend of five selected stocks. By calculating the exponential moving average (EMA) of the closing price of the five selected stocks, the indicator helps users quickly assess overall market sentiment. The indicator's original purpose was to inform the user of the direction of the five largest stocks that make up ~25% of the S&P 500.
Key Features:
Custom Stock Selection: Choose any five stocks to monitor and visualize their combined trend.
EMA-Based Trend: The indicator compares a fast and slow EMA to determine the direction of the trend. When the fast EMA is above the slow EMA, the trend is considered bullish (uptrend); otherwise, it's bearish (downtrend).
Customizable Colors: You can easily customize the colors for both uptrends and downtrends, giving you control over the visual representation of the trend.
Trend Bar Display: For an easy, sleek, and simple reference - The script displays a trend arrow in the lower-right corner of the chart for bullish momentum and a trend arrow in the top-right corner of the chart for bearish momentum.
This indicator is perfect for traders who want to monitor the combined movement of a group of major stocks in order to easily compare strengths or weaknesses. It is a key visual aid in understanding if the overall sentiment is bullish or bearish based on the selected stocks' performance, thus making sure the user is always trading on the right side of momentum.
Kintsugi
Daily Open [Kintsugi Trading]Daily Open
The "Daily Open" indicator by Kintsugi Trading is designed to give traders clear and immediate access to daily open prices, enhancing their ability to spot key market levels and make informed trading decisions. The indicator dynamically changes the color of the plotted line based on the current price's relationship to the opening price of the regular market session. This visual aid helps traders quickly assess whether the current price is trading above or below the opening price of the session.
Key Features:
Daily Open Visualization: Automatically plots the daily open price on your chart, providing a clear reference point for daily price action.
Configurable Market Open Time: The indicator allows users to input the start time of the regular market session (default is set to 9:30 AM).
Color-Coded: The indicator dynamically adjusts the color of the daily open line and price labels based on whether the price is above or below the open, giving you quick visual cues about market sentiment.
Customization Options: Users can modify the line's appearance, including the color and style, to better fit their chart preferences.
Ideal For:
This indicator is particularly useful for day traders and those looking to closely monitor price action in relation to the market's opening level. It serves as a quick reference point for identifying potential bullish or bearish sentiment throughout the trading day.
Good luck with your trading!

Brooks Always In [KintsugiTrading]Brooks Always In
Overview:
The "Brooks Always In Indicator" by KintsugiTrading is a tool designed for traders who follow price action methodologies inspired by Al Brooks. This indicator identifies key bar patterns and breakouts, plots an Exponential Moving Average (EMA), and highlights consecutive bullish and bearish bars. It is intended to assist traders in making informed decisions based on price action dynamics.
Features:
Consecutive Bar Patterns:
Identifies and highlights consecutive bullish and bearish bars.
Differentiates between bars that are above/below the EMA and those that are not.
Customizable EMA:
Option to display an Exponential Moving Average (EMA) with user-defined length and offset.
The EMA can be smoothed using various methods such as SMA, EMA, SMMA (RMA), WMA, and VWMA.
Breakout Patterns:
Recognizes bullish and bearish breakout bars and outside bars.
Tracks inside bars and prior bar conditions to better understand the market context.
Customizable Display:
Users can display or hide the EMA, consecutive bar patterns, and consecutive bars relative to the moving average.
How to Use:
Customize Settings:
First, I like to navigate to the top right corner of the chart (bolt icon), and change both the bull and bear body color to match the background (white/black) - this helps the user visualize the indicator far better.
Next, Toggle to display EMA, consecutive bar patterns, and consecutive bars relative to the moving average using the provided input options.
Adjust the EMA length, source, and offset as per your trading strategy.
Select the smoothing method and length for the EMA if desired.
Analyze Key Patterns:
Observe the highlighted bars on the chart to identify consecutive bullish and bearish patterns.
Use the plotted EMA to gauge the general trend and analyze the relationship between price bars and the moving average.
Informed Decision Making:
Utilize the identified bar patterns and breakouts to make informed trading decisions, such as identifying potential entry and exit points based on price action dynamics.
Good luck with your trading!

Brooks 18 Bars [KintsugiTrading]Brooks 18 Bars
Overview:
This indicator allows traders to specify a time frame within each trading day and plots lines at the highest and lowest prices recorded during that period. It is particularly useful for identifying key levels of support and resistance within a specified time range.
Features:
User-Defined Time Frame: Traders can input their desired start and end times in a 24-hour format, allowing flexibility to analyze different market sessions.
High and Low Price Levels: The indicator plots lines representing the highest and lowest prices observed within the specified time frame each day.
Clear Visual Representation: The high and low lines are color-coded for easy identification, with the high & low prices in Kintsugi Trading Gold.
How to Use:
Set the Time Frame:
Adjust the "Start Time Hour" and "Start Time Minute" to define the beginning of your desired time frame.
Adjust the "End Time Hour" and "End Time Minute" to define the end of your desired time frame.
Analyze Key Levels:
Al Brooks popularized the following idea and basis for creating this indicator:
On a 5-minute chart, Bar 1 has a 20-30% chance of being the High or Low of the day.
Bar 12 has a 50% chance.
Bar 18 has an 80-90% chance.
Use the plotted lines to identify significant support and resistance levels within your specified time frame. These levels can help inform your trading decisions, such as entry and exit points.
Good luck with your trading!

VSA | Volume Spread Analysis [Kintsugi Trading]What is the VSA | Volume Spread Analysis Indicator?
I created this premium volume indicator to find and place high probability forex trades as a part of the Kintsugi Trading 3LS | 3 Line Strike Strategy .
Originally developed by Tom Williams who is considered the father of Volume Spread Analysis, this tool is an amazing indicator and would make a great addition to any trading strategy.
You are free to customize all the inputs:
• 30 | Moving Average-1 Multiplier (Average Volume)
• 0.5 | Moving Average-1 Multiplier (Below Average Volume)
• 1.5 | Moving Average-2 Multiplier (High Volume)
• 3.0 | Moving Average-3 Multiplier (Ultra High Volume)
**Note The default inputs are based on my research and analysis.
Components of The Volume Spread Analysis:
1. The Volume (i.e. activity)
2. The Spread (i.e. range of the price bar)
3. The Close (the closing price of the current bar)
Volume: Volume is the activity of the frequency of transaction of the price change during a specified period of time.
Spread: Spread is the difference between opening and closing price.
Close: Close price tells us where the balance point is at the end of the period.
At Kintsugi Trading we strongly believe that we cannot beat or outperform institutional traders, instead, we have to trade along with them. With that in mind, we follow the footprints of smart players who leave behind trails.
I have designed this indicator so that it is capable of giving signals for all the phenomena explained in Tom William's book.
This Indicator is successful at visualizing the following phenomenon:
• Trapped Buyers
• Trapped Sellers
• Stopping Volume (long)
• Buying Climax
• Selling Climax
Good luck with your trading!
