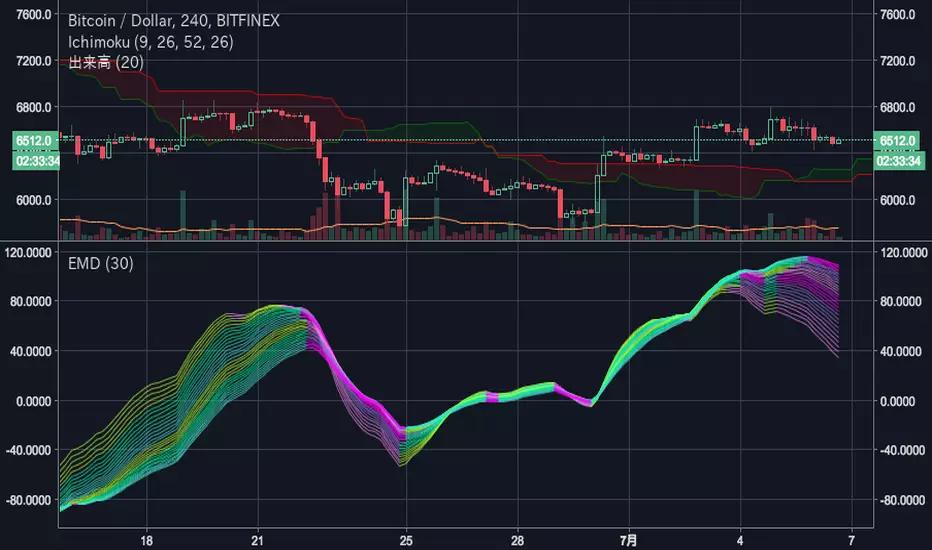
EvaMacD (ver. 3)Eva Chart calculate IIR Filter with Multiple MACD Histogram and estimate the cycle. This oscillator can find the most powerful frequency. This use 30 MACD histogram lines tuned for filter. Version3. Fix Bug.Indikator Pine Script®oleh pekimoche11111
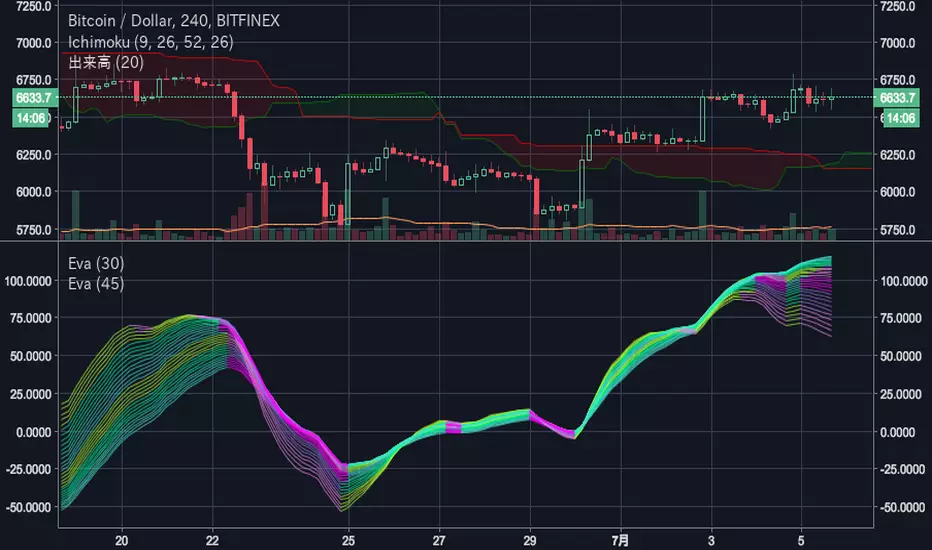
Eva ChartEva Chart calculate IIR Filter with Multiple MACD Histogram and estimate the cycle. This oscillator can find the most powerful frequency.Indikator Pine Script®oleh pekimoche33141
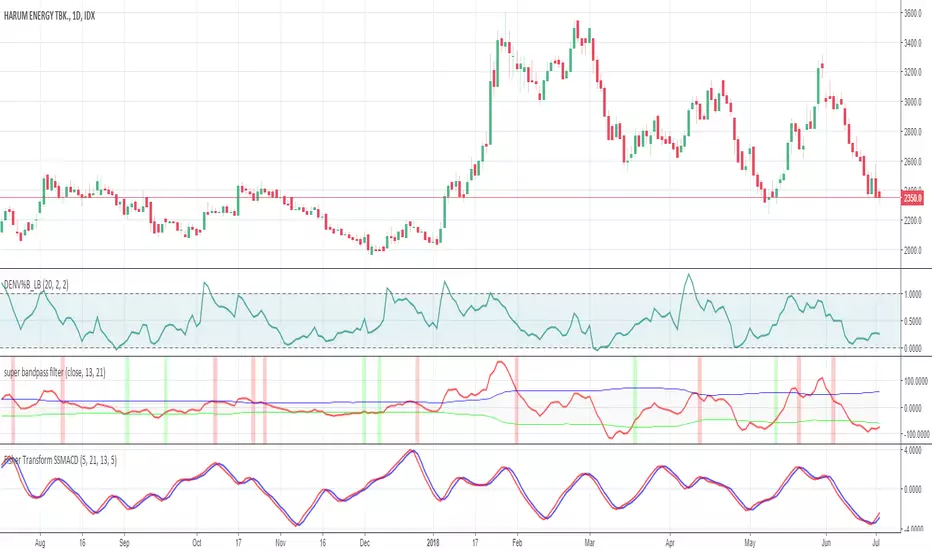
Fisher Transform SuperSmoothed MACD // This is a modification of Supersmoothed MACD (created by KIVANC using EHLERS' SUPER SMOOTHER FILTER) and sharpenned with Ehler fisher transform //all lengths and parameters are completely configurable, tune the length according to your instrument //give me what you think Indikator Pine Script®oleh haidinurhasfi11121
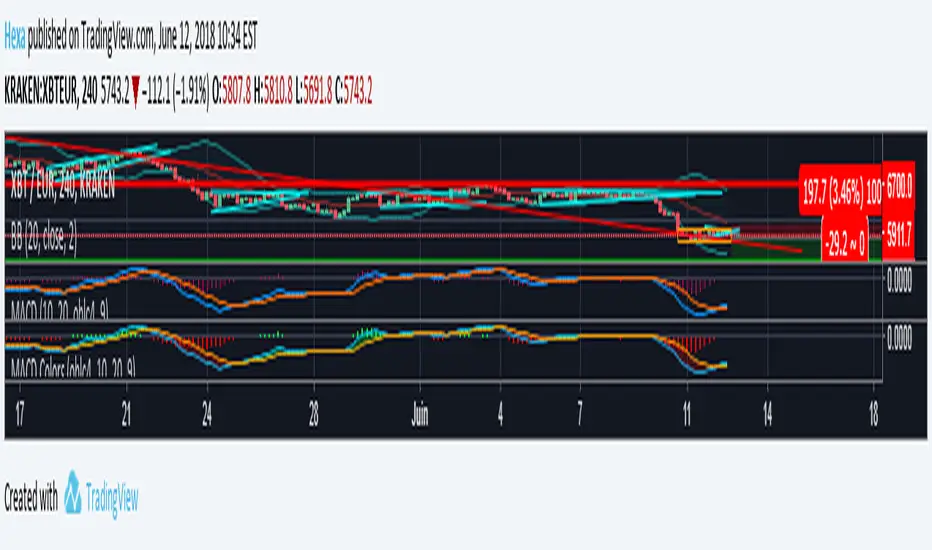
Moving Average Convergence/Divergence ColorsMACD with colors ;-DIndikator Pine Script®oleh HexaDiupdate 39
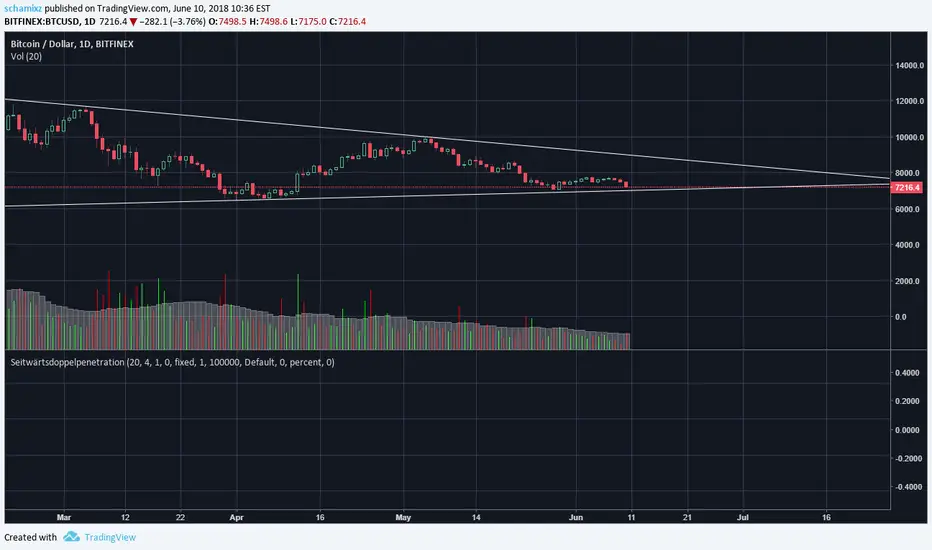
SeitwärtsdoppelpenetrationStrategy with Keltner Channels and MACDStrategi Pine Script®oleh schamixz20
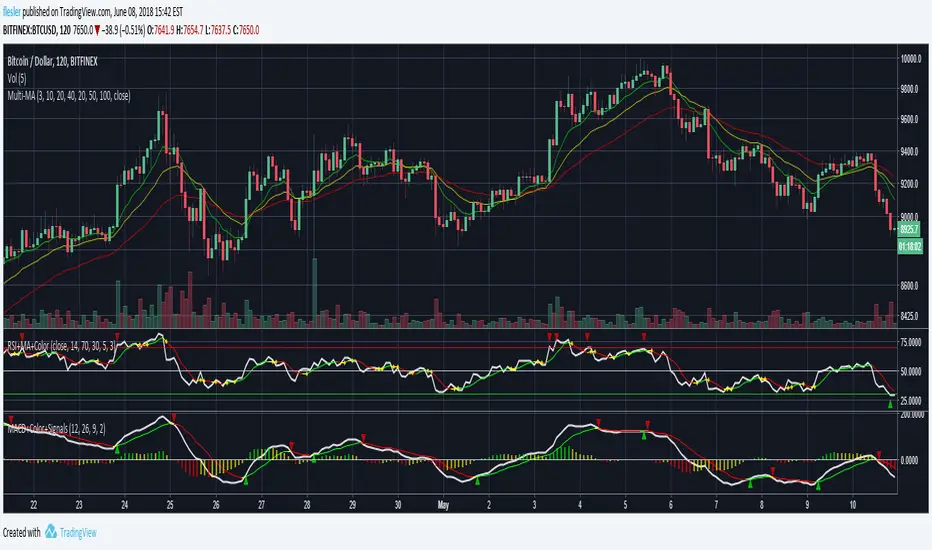
MACD + Colors + Signals Standard MACD with signal and histogram MACD and signal crossovers are marked with up/down triangles Signal is colored based on its direction, can be turned to a single color Histograms can be green, red and yellow based on their side and direction Histograms can be switch to be green when positive and red when negative Indikator Pine Script®oleh fleslerDiupdate 33351
MACD with Directional ColorsThis MACD indicator colors the MACD and signal lines according to the direction they are moving. - Eliminates the histogram from the traditional MACD indicator. - Uses a histogram for the MACD line. - Includes Bollinger Bands for the MACD line to help detect squeezes Indikator Pine Script®oleh TracksDiupdate 289
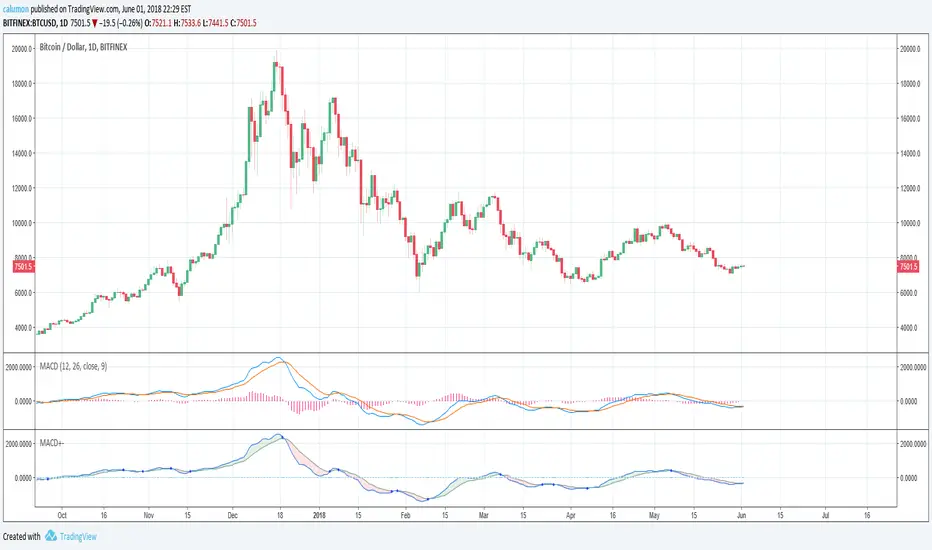
MACD with highlighted positive and negative trendThe values used by this indicator are equal to MACD 12 26 9 (and Signal). Only changes are made to looks: If MACD closes higher than Signal, then we are seeing green. Else, we are seeing red. Another point is that we get a blue circle when there is a trend change from bullish to bearish or vice versa. Please note that there needs to be an offset for this. We will only see the circle, when there already WAS (instead of is) a trend change. Indikator Pine Script®oleh calumon102
MACD with RSI Divergence [BitComRat]Combined MACD with RSI DivergenceIndikator Pine Script®oleh BatRatDiupdate 77327
MacD Convergence/DivergenceI made this script to get a line (or histogram) of the macd and the signal (macd + signal), the principle remains the same as with a standard macd. You can notice that the divergences are present, and that the interpretation does not change, personally, I use ema band, which helps me to confirm the tendencies and to detect divergences!Indikator Pine Script®oleh jod17Diupdate 1166
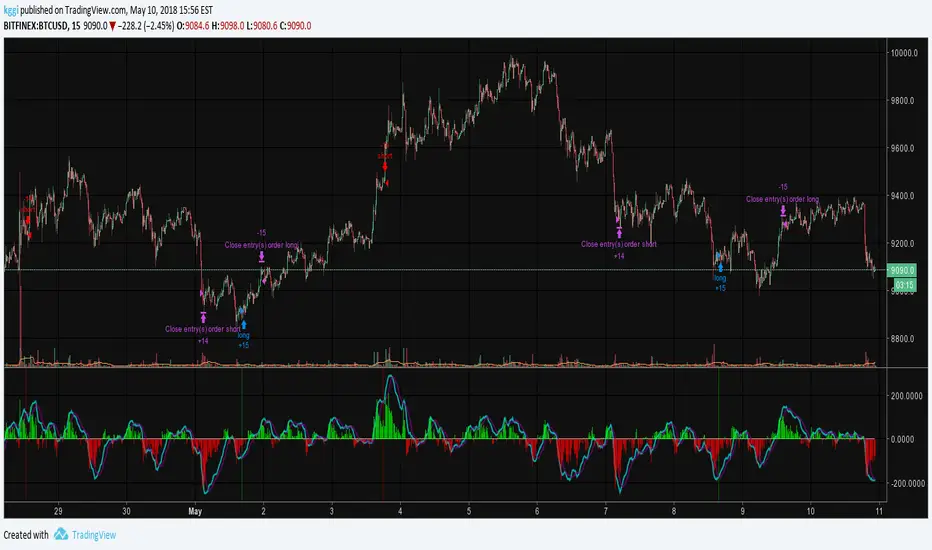
EMA50Diff & MACD StrategyOne of my attempts to create a strategy for BTC. Its a combination of EMA50Diff (the difference between spot and EMA50) and MACD. Buy signal if (EMA50Diff) < -(EMADiffThreshold), (MACD bearish crossunder), (MACD) < -(MACDThreshold), (EMA50Diff) > (EMA50Diff 1 candle ago), (EMA50Diff 1 candle ago) < (EMA50Diff 2 candles ago) Sell signal if (EMA50Diff) > (EMADiffThreshold), (MACD bullish crossover), (MACD) > (MACDThreshold), (EMA50Diff) < (EMA50Diff 1 candle ago), (EMA50Diff 1 candle ago) > (EMA50Diff 2 candles ago) Exit either when target or stoploss get reached. Initial capital is set to 100k and its currently going all-in on every trade but im looking for a better way to handle position sizes already.. Also i included slippage of 30 ticks and exchange commission of 0.15% (e.g. 2x BitMEX market taker fee) Works best on 15m on bitfinex, bitstamp and gdax and i'm still trying to optimize it for bitmex too, will update when i got there..Strategi Pine Script®oleh kggi22160
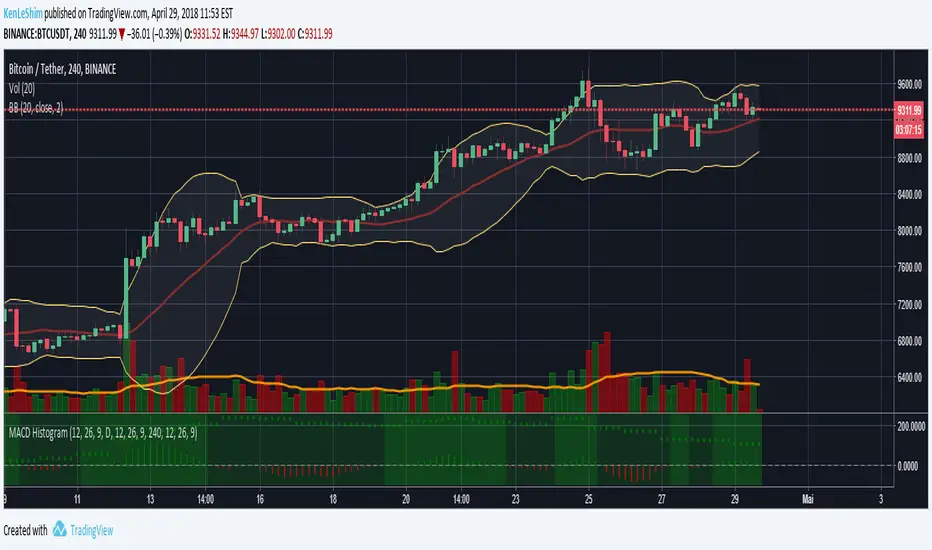
MACD Histogram Multi-TimeframeThe MACD-Histogram represents the difference between the MACD (i.e., the between the two EMAs) and the signal line (i.e., the 9-day EMA of the MACD). The histogram is positive (i.e., above the zero line) when the MACD is above the signal line and negative when the MACD is below the signal line. HOW IS IT USED ? A bullish crossover occurs when the MACD histogram is negative and a bearish cross over occurs when the MACD histogram is negative. I added the possibility to add on the chart a 2nd timeframe for confirmation. If you found this script useful, a tip is always welcome... :)Indikator Pine Script®oleh KenLeShim22300
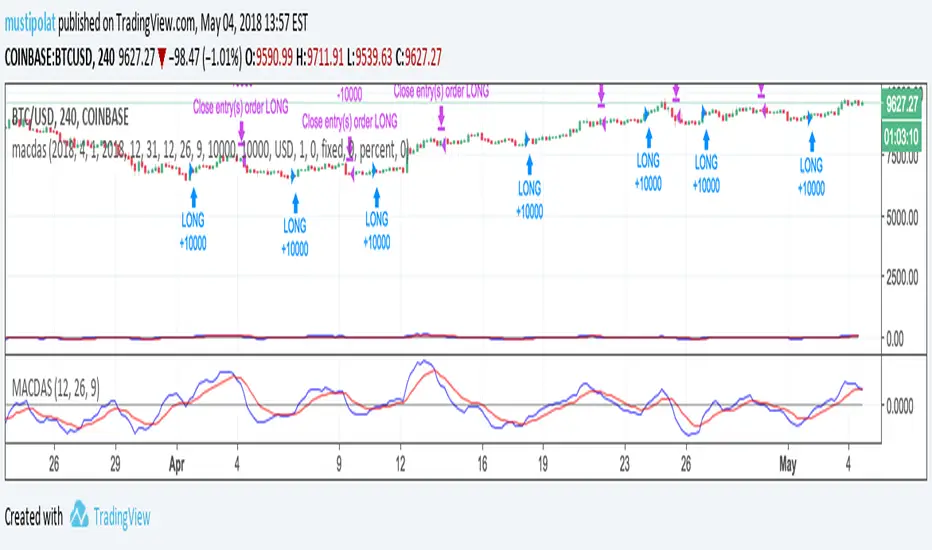
MACD percentage price oscillatorMACD Percentage Price Oscillator is a variation of the MACD indicator. Signal line crossovers are almost identical. The major difference is the MACD Percentage scale which enables comparison between stocks at different prices. MACD Percentage Price Oscillator's trading signals are the same as for the MACD indicator. The MACD indicator is primarily used to trade trends and should not be used in a ranging market. Signals are taken when MACD crosses its signal line, calculated as a 9 day exponential moving average of MACD. First check whether price is trending. If the MACD indicator is flat or stays close to the zero line, the market is ranging and signals are unreliable. Signals are far stronger if there is either: - a divergence on the MACD indicator; or - a large swing above or below the zero line. - Unless there is a divergence, do not go long if the signal is above the zero line, nor go short if the signal is below zero. Place stop-losses below the last minor Low when long, or the last minor High when short. The main advantage of MACD Percentage over MACD is the ability to compare indicator values across stocks. The only difference with MACD Percentage Price Oscillator is that the difference between the fast and slow moving averages is calculated as a percentage of the slow moving average: MACD = (12 Day EMA - 26 Day EMA) / 26 Day EMAIndikator Pine Script®oleh Gregg_s11108
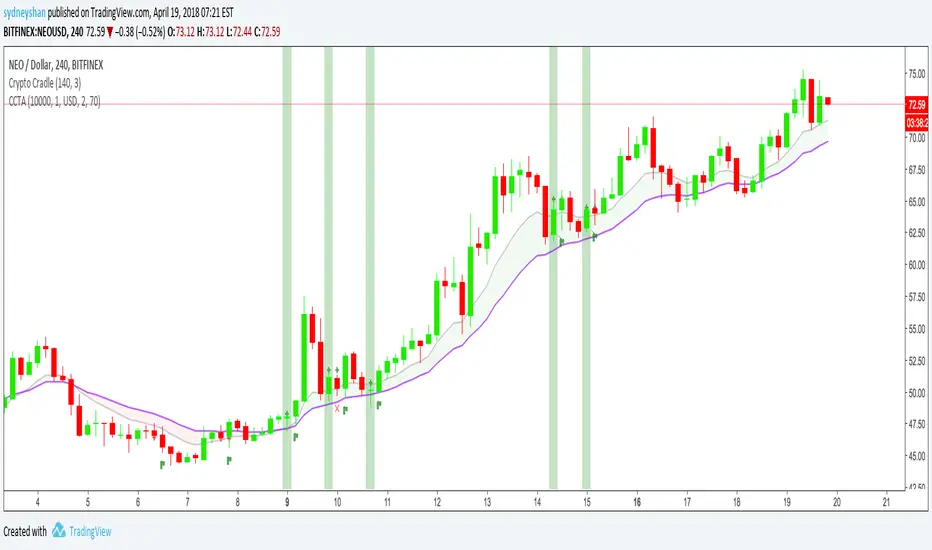
Crypto Cradle Trade AssistantThis indicator compliments the Crypto Cradle indicator by providing your entry, stop, 1:1 scale-out price, trade amount, and potential profit based on your target and scale-out strategy. 1. Ensure you have added the Crypto Cradle and Crypto Cradle Trade Assistant indicators to your chart 2. Click the cog icon to configure this indicator 3. Enter in your account balance and the % you are willing to risk on this trade (default: 1%). 3. Set your target price 4. Tweak the Trade Pair and Precision (Decimals) if required (USD/USDT only BTC & ETH coming soon) 5. Click on the 'Data Window' icon on the right-hand side of the screen and scroll down to CCTA 6. Hover over a highlighted crypto cradle candle (green for long, red for short) and a series of values will appear Entry price Stop price 1:1 scale out price Amount to buy/sell (ie NEO) Amount in traded currency (ie USD) Target price (that you set) Profit based on selling 50% of your bought amount when your reward equals your risk (1:1 scale-out) Profit based on risking 1% of your portfolio For more about the Crypto Cradle strategy, visit www.tradercobb.comIndikator Pine Script®oleh sydneyshan220
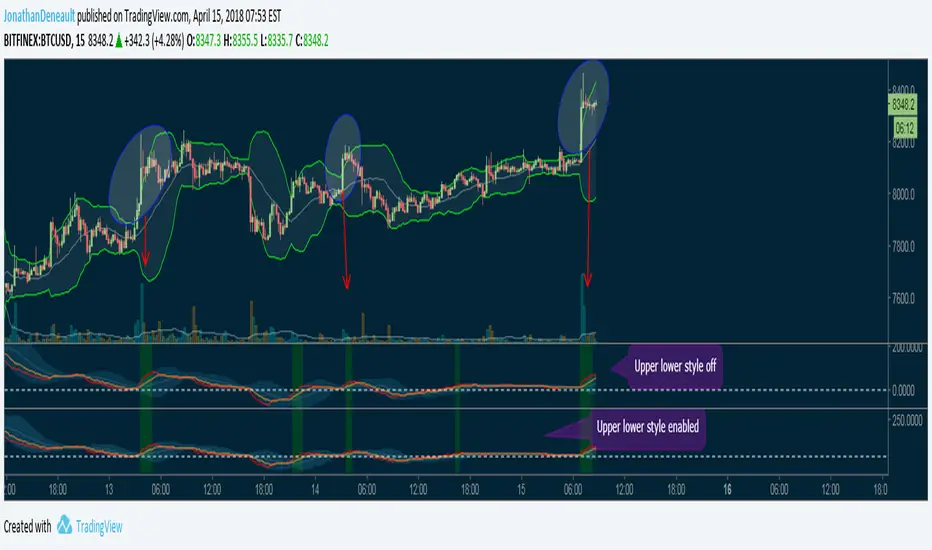
MacD with Bollinger BandsAnother MacD indicator with Bollinger Bands, this version includes the histogram, and you can enable/disable the breach, and I advise unchecking the upper/lower boxes for the Bollinger Bands, as this creates a crush effect on the bands of the MacD and the signal Indikator Pine Script®oleh jod17Diupdate 33156
MacD + Bollinger BandsI made this simple script to use the MacD's EMA tapes with bollinger bands to leave the board free to better visualize the marked features, can be noticed that when the candlesticks come out of the bollinger bands, the EMA strips of the MAcD are also coming out, so it's still useful and they are indicated by the green breaches. I also advise to disable the Upper / Lower in the style tab, this gives a crushing effect. You can turn off the breach too !Indikator Pine Script®oleh jod17Diupdate 108
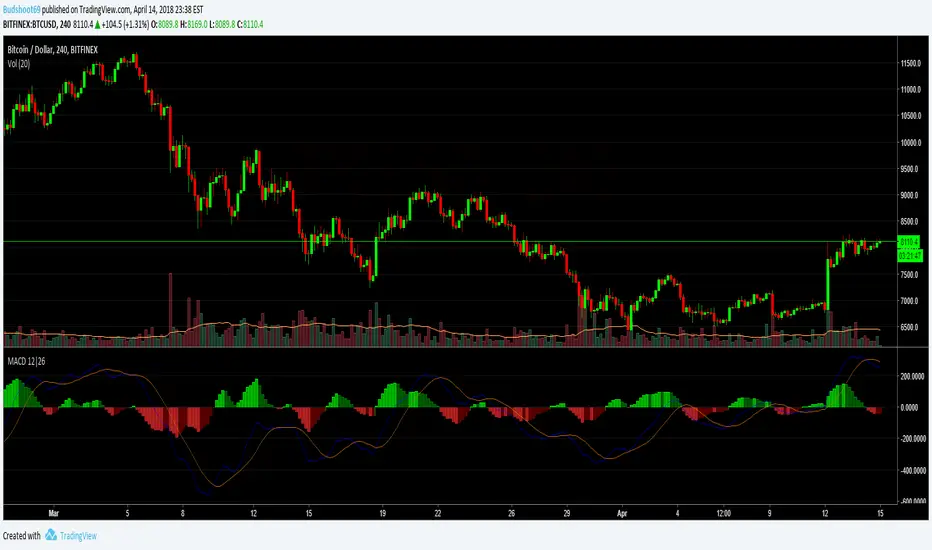
Multicolor MACD 12 & 26 periodIf you're tired of the single colored MACD indicator on TradingView, this is a good alternative. Setup with the same 12 & 26 day periods but has clear green/red histogram.Indikator Pine Script®oleh Budshoot6933288
Explosive PotentialThis script looks at times where MACD is within a specified range (very close to 0 values) and price action is very constrained (under 2%). Historically price has made a strong move after these conditions. I typically run this on an 8H timeframe. Review on BTCUSD and other cryptos.Indikator Pine Script®oleh sydneyshanDiupdate 88355
Riz Coloured MACD - StudyThis is a souped up common or garden MACD . The Histogram is coloured giving a clear visual representation of where we are UpTicking or DownTicking on the Histogram to help support trading decisions. When colour changes from pink to green market is bullish , and visa versa. Very useful as a supporting indicator to confirm other strategies, or even as a standalone strategy to some extent. Backtesting of strategy is enabled by converting script from a Study to a strategy, see comments in code. This version focuses on this indicators use as a day to day study rather than a useful strategy for automated trading. Indikator Pine Script®oleh HolRiz73
Riz Coloured MACDThis is a souped up common or garden MACD . The Histogram is coloured giving a clear visual representation of where we are UpTicking or DownTicking on the Histogram to help support trading decisions. When colour changes from pink to green market is bullish , and visa versa. Very useful as a supporting indicator to confirm other strategies, or even as a standalone strategy to some extent. Alerts are enabled by converting script from a Strategy to a Study, see comments in code.Strategi Pine Script®oleh HolRiz1180
Moving Average Convergence/DivergenceMoving Average Convergence/DivergenceIndikator Pine Script®oleh czarlieron147