Atareum Volume Ichimuku CandleAVIC (Atareum Volume Ichimoku Candles) is clearly an awesome indicator that is based on Ichimoku concepts by combination with volume. This is a new approach of volume candles that is combined with Ichimoku concepts and creates such a powerful tool to trace the market and assists traders to make better decisions, truly.
Concept:
Using Ichimoku leading periods and calculations on redesigning new candles in combination with volume, that makes unique reform candles on Tenkansen movement, but these new candles clearly omit noises in combination with volume, and then the new redesigned system of cloud calculations builds, new series of data for Senko Span A and Senko Span B which is so odd in first view, because they will barely ever cross each other, but they show very more informative and useful.
Parameters:
Section 1 : Candle colour setting for flourishing just as you desire !
Section 2 : Defining Periods of standard Ichimoku and source of candle data in combination with determining the smoothing type of moving averages and signal period.
Section 3 : Select using Heikin Ashi based candles alongside with redesigned cloud calculation type and three additional moving averages which can plot on each newly generated candles and standard candles on a chart with the type mode defined in the previous section.
Note: if you want to omit any or all of these moving averages, you can use 0 in period, instead of selecting "None" in the plot moving option!
Usage :
Overall:
Regardless of the additional moving averages which will lead to so many situations of market according to their types and designs, that is four different period for new redesign AVIC and three period for standard chart. You can easily select periods and type for these moving averages. Also, do not forget that signal moving averages is shown only on AVIC chart and have two different colour for upward and downward trends. Other moving averages are plot by just one single colour.
Cloud levels are so important because AVIC candles show respect to them and when they break the clouds upward or downward it's surly beginning of a trend that is may last long. Also when cloud levels flatten, it is determining a support or resistance according to up cloud or down cloud nature and as long as they will continue or repeated periodically on same level of AVIC chart, it will implement their weakness or strength.
Support and Resistance:
Any flattens of cloud up or down level means the support or resistance level due to its nature, but important thing is how long the cloud lasts flatten or how many times repeated in the same level in AVIC chart.
For plotting the support or resistance you should trace first candle of start of flattens in standard chart just like following picture.
Divergence:
All Higher high or Lower low of standard chart has its reflect in AVIC chart but there is secret in it, It is named divergence. When standard chart price candles generating lower low but the AVIC chart candles do not cross the bottom, it means we will spike high as soon as AVIC candle chart complete its divergence. You can see perfect example in following picture.
Cloud level Ends
When cloud down level become flattens and cloud up level start a bull run it means we will face a great up trend movement but as soon as cloud down level starts to move up it mean we are going to finish the bull run and maybe it goes with consolidation phase or reversal phase. This reaction is exactly happen in vice versa for bear run trend. You can see both examples in following pictures.
Note: if we face end of bull run and cloud down level make a U turn shape upside down it means we will have reversal phase even not too long but it is sharp and fast reversal. If cloud down level just turn right slightly, it means we should have consolidation phase, mostly or we can continue the last trend slightly. All these situations can happen in vice versa bear run. You can see example in following picture.
Signals:
Long but risky:
You can go long when AVIC candles are green and be in position as long as they are not change in colour.
Long and safe :
You can go long when AVIC candles cross up cloud down level and be in position as long as AVIC candles cross down cloud up level.
Long and sure:
You can go long when AVIC candles cross up cloud up level and be in position as long as AVIC candles cross down cloud down level.
Short but risky:
You can go short when AVIC candles are red and be in position as long as they are not change in colour.
Short and safe :
You can go short when AVIC candles cross down cloud up level and be in position as long as AVIC candles cross up cloud down level.
Short and sure:
You can go short when AVIC candles cross down cloud down level and be in position as long as AVIC candles cross up cloud up level.
Notice : Candles with large body are so strong but if a body candle is weak or flatten it may a signal of changing colour and direction, especially when using Heikin Ashi type.
It is the result of many years of experience in markets and there are so many details about this AVIC chart which I am in the experiment phase to publish in the future, so please help me with your ideas and do not hesitate to comment and inform me any suggestions or criticism.
Awan Ichimoku

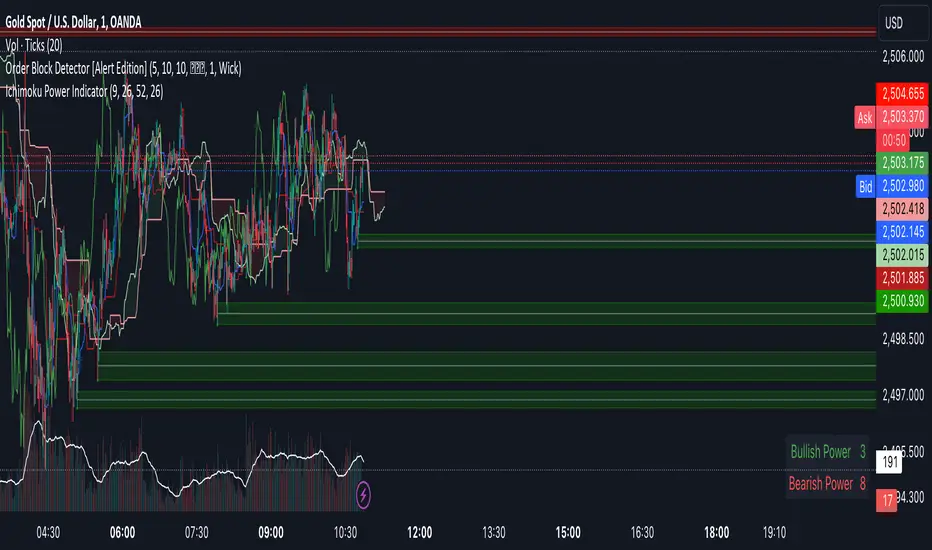
Ichimoku Power Indicator# Ichimoku Power Indicator
## Overview
The Ichimoku Power Indicator is an advanced tool that combines the traditional Ichimoku Cloud system with a unique power ranking mechanism. This indicator provides traders with a comprehensive view of market trends and potential reversal points, all while quantifying the strength of bullish and bearish signals.
## Key Features
1. **Full Ichimoku Cloud Visualization:** Displays all components of the Ichimoku Cloud system, including Conversion Line (Tenkan-sen), Base Line (Kijun-sen), Leading Span A and B (Kumo), and Lagging Span (Chikou Span).
2. **Power Ranking System:** Calculates and displays a bullish and bearish power score based on 11 different Ichimoku-derived conditions.
3. **Real-time Updates:** Power scores are updated in real-time as market conditions change.
4. **Easy-to-Read Display:** A clear, color-coded table shows the current bullish and bearish power scores.
5. **Customizable Parameters:** Allows adjustment of key Ichimoku settings to suit different trading styles and timeframes.
## How It Works
The indicator evaluates 11 different conditions derived from Ichimoku Cloud components:
1. Cloud color
2. Price position relative to the cloud
3. Tenkan-sen vs Kijun-sen
4. Price vs Tenkan-sen
5. Price vs Kijun-sen
6. Tenkan-sen vs Cloud
7. Kijun-sen vs Cloud
8. Chikou Span vs Cloud
9. Chikou Span vs Tenkan-sen
10. Chikou Span vs Kijun-sen
11. Chikou Span vs Price
Each bullish condition adds a point to the bullish power score, while each bearish condition adds a point to the bearish power score. The maximum score for each is 11.
## Interpretation
- Higher bullish scores suggest stronger upward trends or potential bullish reversals.
- Higher bearish scores indicate stronger downward trends or potential bearish reversals.
- When scores are close, it may indicate a period of consolidation or uncertainty.
## Use Cases
- Trend Confirmation: Use in conjunction with price action to confirm the strength of current trends.
- Reversal Detection: Watch for changes in power scores as early indicators of potential trend reversals.
- Entry and Exit Signals: High power scores can be used to identify optimal entry or exit points.
- Market Analysis: Gain a quick overview of market conditions across multiple assets or timeframes.
## Note
This indicator is designed to complement your existing trading strategy. Always use it in conjunction with other forms of analysis and proper risk management techniques.
Experiment with different timeframes and settings to find the configuration that best suits your trading style and the assets you trade.
Happy trading!
Advanced Fully Reversed Candles with Reversed IchimokuThe "Advanced Fully Reversed Candles with Reversed Ichimoku" indicator is a sophisticated tool designed for traders who seek a unique perspective on market dynamics. This innovative indicator not only reverses the traditional candlestick chart but also inverts the Ichimoku Cloud components, providing a comprehensive view of the market's inverted behavior.
Key Features:
Reversed Candlestick Chart:
The indicator recalculates the OHLC (Open, High, Low, Close) prices by reversing them along the price axis. This means that what typically would be an upward movement is displayed as a downward movement, and vice versa. This reversal provides an alternative view that can help traders identify hidden patterns and potential reversal points that might not be obvious on a standard chart.
Reversed Ichimoku Cloud:
All components of the Ichimoku Cloud indicator are recalculated based on the reversed price data. This includes:
Tenkan-sen (Conversion Line): Reversed based on the highest and lowest prices over the specified period.
Kijun-sen (Base Line): Reversed in a similar manner to the Tenkan-sen, providing a medium-term perspective on price trends.
Senkou Span A (Leading Span A): Reversed to form one boundary of the Kumo (cloud), offering insight into future support and resistance levels.
Senkou Span B (Leading Span B): Reversed to form the other boundary of the Kumo, complementing Senkou Span A.
Chikou Span (Lagging Span): Reversed and plotted backward for additional confirmation of trend direction and strength.
Dynamic Price Range Calculation:
The indicator dynamically calculates the maximum and minimum prices over the last 500 bars (or the available range if fewer bars are present). This ensures that the reversal is always based on the most relevant data, providing accurate and up-to-date visualizations.
Visual Enhancements:
The reversed candlesticks are color-coded for easy interpretation: green for upward movements and red for downward movements, based on the reversed data.
The Ichimoku Cloud is filled with semi-transparent colors to clearly distinguish between bullish and bearish conditions even in its reversed state.
Debugging Aids:
For transparency and accuracy, the indicator plots the maximum and minimum price lines used for the reversal calculations. This allows users to verify the internal workings of the indicator and ensure the reversal logic is correctly applied.
Usage:
This indicator is ideal for advanced traders and analysts who want to explore market behavior from an unconventional angle. By reversing both the candlestick chart and the Ichimoku Cloud, it provides a unique perspective that can uncover new trading opportunities and enhance market analysis.
Customization:
Users can customize the periods for the Tenkan-sen, Kijun-sen, and Senkou Span B, as well as the displacement for the Ichimoku Cloud. This flexibility allows traders to adapt the indicator to their specific trading strategies and timeframes.
Conclusion:
The "Advanced Fully Reversed Candles with Reversed Ichimoku" indicator is a powerful tool that transforms traditional market analysis. By inverting both price movements and key technical indicators, it opens up a new dimension of trading insights, helping traders to see the market in a completely different light.
Parameters:
Tenkan-sen period (default: 9)
Kijun-sen period (default: 26)
Senkou Span B period (default: 52)
Displacement (default: 26)
How to Apply:
Add the script to your TradingView account via the Pine Editor.
Customize the parameters according to your trading strategy.
Analyze the reversed candlestick chart and Ichimoku Cloud to gain unique insights into market trends and potential reversal points.

Ichimoku Cloud w/ HelpersIchimoku Cloud w/ Helpers is your standard Ichimoku Cloud indicator with two additions.
Checkout TradingView's write up on the Ichimoku Cloud here .
The two additions added to this indicator are described below:
1 — A box is drawn centered on the current bar and stretching a length equal to the 'Senkou Span B Period'.
• The box encompasses the highest high and lowest low in that period.
2 — Two new lines are added.
• Green Line : Projection from the Lagging Line (Chikou Span) to the Span A line, indicating historical price action relative to future projected support/resistance.
• Red Line : Projection from the Kijun-sen (Base Line) to the Span B line, indicating medium-term trend direction relative to future projected support/resistance.
Use cases :
• The Box is simply a visual cue to draw your eye towards the area that the Ichimoku Cloud is currently attempting to analyze: Past, Present and Future.
• The green and red lines add a way to interpret the sentiment:
• Diverging Lines with Green Above Red --> Interpret as Bullish Sentiment
• Converging Lines with Green Crossing Above Red --> Interpret as Bullish reversal or strengthening
• Converging Lines with Green Crossing Below Red --> Interpret as Bearish reversal or weakening.
• Diverging Lines with Red Above Green --> Interpret as Bearish Sentiment
• Converging Lines with Red Crossing Below Green --> Interpret as Bullish reversal or weakening bearish trend.
Current limitations :
• Under settings -> Styles, the plotted lines don't allow the colors to be changed. A bug I'm trying to figure out.
Bugs?
Kindly report any issues you run into and I'll try to fix them promptly.
Thank you!

KumoTrade Ichimoku StrategyThe KumoTrade Ichimoku Strategy is an advanced trading strategy designed to help users identify market trends and potential trading opportunities using the Ichimoku Kinko Hyo technical analysis indicator. This strategy leverages the Ichimoku cloud (Kumo) along with other crucial indicators such as the Tenkan-sen and Kijun-sen lines to generate strong signals.
Main Components of the Strategy:
Tenkan-sen (Conversion Line): Indicates the short-term direction of the price, typically calculated as the average of the highest high and the lowest low over the past 9 periods.
Kijun-sen (Base Line): Indicates the medium-term direction of the price, usually calculated as the average of the highest high and the lowest low over the past 26 periods.
Senkou Span A and Senkou Span B: These two lines form the cloud (Kumo), which projects future support and resistance levels.
Chikou Span (Lagging Span): Plots the current closing price 26 periods back to measure the market's momentum.
Strategy Rules:
Bullish Bias (Bias Bull): Indicates that the prices are in a long-term uptrend. In this strategy, this is confirmed if the low prices are above the daily EMA (Exponential Moving Average).
Kijun Sen Touch Down: Occurs when prices cross below the Kijun-sen line and then close back above it, indicating a potential bullish reversal.
Tenkan-Kijun Cross Up: A bullish signal generated when the Tenkan-sen line crosses above the Kijun-sen line.
Close Over Tenkan and Kijun: A strong bullish signal when the close price crosses above both the Tenkan-sen and Kijun-sen lines.
Trading Setups:
Long Setup: Generated when the Kijun-sen is above the highest point of the Kumo (senkou_max) and the closing price is below the lowest point of the Kumo (senkou_min). This setup is checked over the last 21 bars.
Short Setup: Generated when the Kijun-sen is below the lowest point of the Kumo (senkou_min) and the closing price is above the highest point of the Kumo (senkou_max). This setup is also checked over the last 21 bars. (Not avalible yet)
Entry Conditions:
Ultra Long Entry: This condition checks for a bullish bias, the Tenkan-Kijun cross up or Kijun Sen touch down, high volume, and that the price is not within the Kumo cloud.
Main Long Entry: This condition requires the closing price to be above the Kumo cloud, a green Kumo cloud, a bullish bias, the Tenkan rule, and that the price is not within the Kumo cloud.
Exit Conditions:
A trailing stop loss is implemented to protect profits. The stop loss level is dynamically updated based on the highest high of the last 5 bars minus three times the ATR (Average True Range) value.
Visuals on the Chart:
The Tenkan-sen and Kijun-sen lines are plotted for visual reference.
The Kumo cloud is displayed with different colors indicating bullish (green) or bearish (red) conditions.
Entry points are marked on the chart, and the trailing stop loss levels are plotted as well.
The KumoTrade Ichimoku Strategy aims to provide a comprehensive approach to trading by combining multiple aspects of the Ichimoku indicator to generate reliable trading signals and manage risk effectively.

Ichimoku Theories [LuxAlgo]The Ichimoku Theories indicator is the most complete Ichimoku tool you will ever need. Four tools combined into one to harness all the power of Ichimoku Kinkō Hyō.
This tool features the following concepts based on the work of Goichi Hosoda:
Ichimoku Kinkō Hyō: Original Ichimoku indicator with its five main lines and kumo.
Time Theory: automatic time cycle identification and forecasting to understand market timing.
Wave Theory: automatic wave identification to understand market structure.
Price Theory: automatic identification of developing N waves and possible price targets to understand future price behavior.
🔶 ICHIMOKU KINKŌ HYŌ
Ichimoku with lines only, Kumo only and both together
Let us start with the basics: the Ichimoku original indicator is a tool to understand the market, not to predict it, it is a trend-following tool, so it is best used in trending markets.
Ichimoku tells us what is happening in the market and what may happen next, the aim of the tool is to provide market understanding, not trading signals.
The tool is based on calculating the mid-point between the high and low of three pre-defined ranges as the equilibrium price for short (9 periods), medium (26 periods), and long (52 periods) time horizons:
Tenkan sen: middle point of the range of the last 9 candles
Kinjun sen: middle point of the range of the last 26 candles
Senkou span A: middle point between Tankan Sen and Kijun Sen, plotted 26 candles into the future
Senkou span B: midpoint of the range of the last 52 candles, plotted 26 candles into the future
Chikou span: closing price plotted 26 candles into the past
Kumo: area between Senkou pans A and B (kumo means cloud in Japanese)
The most basic use of the tool is to use the Kumo as an area of possible support or resistance.
🔶 TIME THEORY
Current cycles and forecast
Time theory is a critical concept used to identify historical and current market cycles, and use these to forecast the next ones. This concept is based on the Kihon Suchi (translating to "Basic Numbers" in Japanese), these are 9 and 26, and from their combinations we obtain the following sequence:
9, 17, 26, 33, 42, 51, 65, 76, 129, 172, 200, 257
The main idea is that the market moves in cycles with periods set by the Kihon Suchi sequence.
When the cycle has the same exact periods, we obtain the Taito Suchi (translating to "Same Number" in Japanese).
This tool allows traders to identify historical and current market cycles and forecast the next one.
🔹 Time Cycle Identification
Presentation of 4 different modes: SWINGS, HIGHS, KINJUN, and WAVES .
The tool draws a horizontal line at the bottom of the chart showing the cycles detected and their size.
The following settings are used:
Time Cycle Mode: up to 7 different modes
Wave Cycle: Which wave to use when WAVE mode is selected, only active waves in the Wave Theory settings will be used.
Show Time Cycles: keep a cleaner chart by disabling cycles visualisation
Show last X time cycles: how many cycles to display
🔹 Time Cycle Forecast
Showcasing the two forecasting patterns: Kihon Suchi and Taito Suchi
The tool plots horizontal lines, a solid anchor line, and several dotted forecast lines.
The following settings are used:
Show time cycle forecast: to keep things clean
Forecast Pattern: comes in two flavors
Kihon Suchi plots a line from the anchor at each number in the Kihon Suchi sequence.
Taito Suchi plot lines from the anchor with the same size detected in the anchored cycle
Anchor forecast on last X time cycle: traders can place the anchor in any detected cycle
🔶 WAVE THEORY
All waves activated with overlapping
The main idea behind this theory is that markets move like waves in the sea, back and forth (making swing lows and highs). Understanding the current market structure is key to having realistic expectations of what the market may do next. The waves are divided into Simple and Complex.
The following settings are used:
Basic Waves: allows traders to activate waves I, V and N
Complex Waves: allows traders to activate waves P, Y and W
Overlapping waves: to avoid missing out on any of the waves activated
Show last X waves: how many waves will be displayed
🔹 Basic Waves
The three basic waves
The basic waves from which all waves are made are I, V, and N
I wave: one leg moves
V wave: two legs move, one against the other
N wave: Three legs move, push, pull back, and another push
🔹 Complex Waves
Three complex waves
There are other waves like
P wave: contracting market
Y wave: expanding market
W wave: double top or double bottom
🔶 PRICE THEORY
All targets for the current N wave with their calculations
This theory is based on identifying developing N waves and predicting potential price targets based on that developing wave.
The tool displays 4 basic targets (V, E, N, and NT) and 3 extended targets (2E and 3E) according to the calculations shown in the chart above. Traders can enable or disable each target in the settings panel.
🔶 USING EVERYTHING TOGETHER
Please DON'T do this. This is not how you use it
Now the real example:
Daily chart of Nasdaq 100 futures (NQ1!) with our Ichimoku analysis
Time, waves, and price theories go together as one:
First, we identify the current time cycles and wave structure.
Then we forecast the next cycle and possible key price levels.
We identify a Taito Suchi with both legs of exactly 41 candles on each I wave, both together forming a V wave, the last two I waves are part of a developing N wave, and the time cycle of the first one is 191 candles. We forecast this cycle into the future and get 22nd April as a key date, so in 6 trading days (as of this writing) the market would have completed another Taito Suchi pattern if a new wave and time cycle starts. As we have a developing N wave we can see the potential price targets, the price is actually between the NT and V targets. We have a bullish Kumo and the price is touching it, if this Kumo provides enough support for the price to go further, the market could reach N or E targets.
So we have identified the cycle and wave, our expectations are that the current cycle is another Taito Suchi and the current wave is an N wave, the first I wave went for 191 candles, and we expect the second and third I waves together to amount to 191 candles, so in theory the N wave would complete in the next 6 trading days making a swing high. If this is indeed the case, the price could reach the V target (it is almost there) or even the N target if the bulls have the necessary strength.
We do not predict the future, we can only aim to understand the current market conditions and have future expectations of when (time), how (wave), and where (price) the market will make the next turning point where one side of the market overcomes the other (bulls vs bears).
To generate this chart, we change the following settings from the default ones:
Swing length: 64
Show lines: disabled
Forecast pattern: TAITO SUCHI
Anchor forecast: 2
Show last time cycles: 5
I WAVE: enabled
N WAVE: disabled
Show last waves: 5
🔶 SETTINGS
Show Swing Highs & Lows: Enable/Disable points on swing highs and swing lows.
Swing Length: Number of candles to confirm a swing high or swing low. A higher number detects larger swings.
🔹 Ichimoku Kinkō Hyō
Show Lines: Enable/Disable the 5 Ichimoku lines: Kijun sen, Tenkan sen, Senkou span A & B and Chikou Span.
Show Kumo: Enable/Disable the Kumo (cloud). The Kumo is formed by 2 lines: Senkou Span A and Senkou Span B.
Tenkan Sen Length: Number of candles for Tenkan Sen calculation.
Kinjun Sen Length: Number of candles for the Kijun Sen calculation.
Senkou Span B Length: Number of candles for Senkou Span B calculation.
Chikou & Senkou Offset: Number of candles for Chikou and Senkou Span calculation. Chikou Span is plotted in the past, and Senkou Span A & B in the future.
🔹 Time Theory
Show Time Cycle Forecast: Enable/Disable time cycle forecast vertical lines. Disable for better performance.
Forecast Pattern: Choose between two patterns: Kihon Suchi (basic numbers) or Taito Suchi (equal numbers).
Anchor forecast on last X time cycle: Number of time cycles in the past to anchor the time cycle forecast. The larger the number, the deeper in the past the anchor will be.
Time Cycle Mode: Choose from 7 time cycle detection modes: Tenkan Sen cross, Kijun Sen cross, Kumo change between bullish & bearish, swing highs only, swing lows only, both swing highs & lows and wave detection.
Wave Cycle: Choose which type of wave to detect from 6 different wave types when the time cycle mode is set to WAVES.
Show Time Cycles: Enable/Disable time cycle horizontal lines. Disable for better performance.
how last X time cycles: Maximum number of time cycles to display.
🔹 Wave Theory
Basic Waves: Enable/Disable the display of basic waves, all at once or one at a time. Disable for better performance.
Complex Waves: Enable/Disable complex wave display, all at once or one by one. Disable for better performance.
Overlapping Waves: Enable/Disable the display of waves ending on the same swing point.
Show last X waves: 'Maximum number of waves to display.
🔹 Price Theory
Basic Targets: Enable/Disable horizontal price target lines. Disable for better performance.
Extended Targets: Enable/Disable extended price target horizontal lines. Disable for better performance.

Ichimoku Slope Filtered Signals [UAlgo]
🔶Description:
The "Ichimoku Slope Filtered Signals" indicator is designed to provide trading signals based on the Ichimoku Cloud indicator while incorporating a slope filter. The Ichimoku Cloud is a comprehensive indicator that defines support and resistance, identifies trend direction, and provides trading signals. This script enhances the traditional Ichimoku Cloud signals by incorporating a slope filter, which helps to confirm the strength and direction of the trend.
🔶Key Features:
Ichimoku Cloud Parameters: Users can customize parameters such as Tenkan, Kijun, and Senkou Span lengths, along with multipliers, to adjust the sensitivity of the Ichimoku Cloud.
Slope Filter Settings: Users can specify the number of bars to measure the slope and the lookback period for trend measurement. Additionally, there are options to filter Ichimoku signals based on slope thresholds.
Normalized Slope: The indicator calculates the normalized slope of the selected data series (in this case, Tenkan-sen) and plots it alongside the Ichimoku Cloud.
Signal Generation: Trading signals are generated based on crossovers and crossunders of the Tenkan-sen and Kijun-sen lines of the Ichimoku Cloud. These signals can be further filtered based on the normalized slope of the selected data series.
🔶 Usage:
Customization: Traders can customize the parameters of the Ichimoku Cloud and slope filter according to their trading strategy and risk tolerance.
Interpretation of Signals:
Crossover: A buy signal is generated when the Tenkan-sen line crosses above the Kijun-sen line. This signal can be further filtered based on the normalized slope.
Crossunder: A sell signal is generated when the Tenkan-sen line crosses below the Kijun-sen line. Similar to the buy signal, this can also be filtered based on the normalized slope.
Trend Confirmation: The normalized slope provides additional confirmation of the strength and direction of the trend. A positive slope indicates an upward trend, while a negative slope indicates a downward trend.
Example:
Disclaimer:
Not Financial Advice: This script is provided for educational purposes only and should not be considered financial advice. Traders should conduct their own research and/or consult with a qualified financial advisor before making any investment decisions based on this script.
Risk of Loss: Trading in financial markets involves risk of loss, and past performance is not indicative of future results. Users of this script should be aware of the risks involved in trading and should only trade with capital they can afford to lose.
No Guarantees: There is no guarantee of success or profitability when using this script. Market conditions can change rapidly, and trading results may vary.
Use at Own Risk: The author of this script (UAlgo) does not assume any responsibility for losses incurred as a result of using this script. Traders use this script at their own risk and discretion.
Terms of Use: This script is subject to the terms of the Mozilla Public License 2.0. Users are encouraged to review the license terms before using or distributing the script.

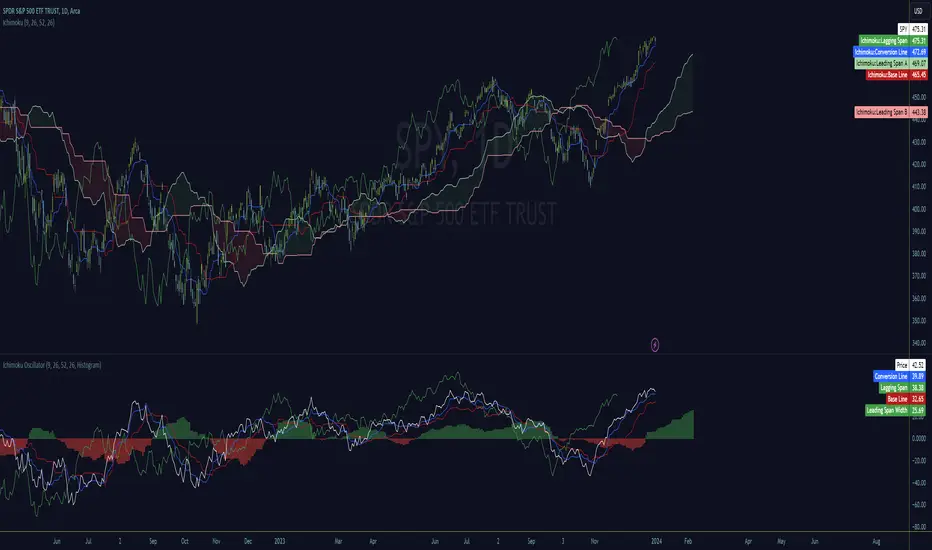
Ichimoku OscillatorHello All,
This is Ichimoku Oscillator that creates different oscillator layers, calculates the trend and possible entry/exit levels by using Ichimoku Cloud features.
There are four layer:
First layer is the distance between closing price and cloud (min or max, depending on the main trend)
Second layer is the distance between Lagging and Cloud X bars ago (X: the displacement)
Third layer is the distance between Conversion and Base lines
Fourth layer is the distance between both Leadlines
If all layers are visible maning that positive according to the main trend, you can take long/short position and when main trend changed then you should close the position. so it doesn't mean you can take position when main trend changed, you need to wait for all other conditions met (all layers(
there is take profit partially option. if Conversion and base lines cross then you can take profit partially. Optionally you can take profit partially when EMA line crosses Fourth layer.
Optionally ATR (average true range) is used for Conversion and baseline for protection from whipsaws. you can use it to stay on the trend longer time.
I added options to enable/disable the alert and customize alert messages. You can change alert messages as you wish. if you use ' close ' in the alert message then you can get closing price in the alert message when the alert was triggered.
There is an option Bounce Off Support/Resistance , if there is trend and if the price bounce off Support/Resistance zone then a tiny triangle is shown.
There are many other options for coloring, alerts etc.
Some screenshots:
Main trend:
Taking/closing positions:
Example alert messages:
Bounce off:
Colors:
Colors:
Colors:
Non-colored background:
P.S. For a few months I haven't published any new script because of some health issues. hope to be healthy and create new scripts in 2024 :)
Enjoy!

Ichimoku Clouds Strategy Long and ShortOverview:
The Ichimoku Clouds Strategy leverages the Ichimoku Kinko Hyo technique to offer traders a range of innovative features, enhancing market analysis and trading efficiency. This strategy is distinct in its combination of standard methodology and advanced customization, making it suitable for both novice and experienced traders.
Unique Features:
Enhanced Interpretation: The strategy introduces weak, neutral, and strong bullish/bearish signals, enabling detailed interpretation of the Ichimoku cloud and direct chart plotting.
Configurable Trading Periods: Users can tailor the strategy to specific market windows, adapting to different market conditions.
Dual Trading Modes: Long and Short modes are available, allowing alignment with market trends.
Flexible Risk Management: Offers three styles in each mode, combining fixed risk management with dynamic indicator states for versatile trade management.
Indicator Line Plotting: Enables plotting of Ichimoku indicator lines on the chart for visual decision-making support.
Methodology:
The strategy utilizes the standard Ichimoku Kinko Hyo model, interpreting indicator values with settings adjustable through a user-friendly menu. This approach is enhanced by TradingView's built-in strategy tester for customization and market selection.
Risk Management:
Our approach to risk management is dynamic and indicator-centric. With data from the last year, we focus on dynamic indicator states interpretations to mitigate manual setting causing human factor biases. Users still have the option to set a fixed stop loss and/or take profit per position using the corresponding parameters in settings, aligning with their risk tolerance.
Backtest Results:
Operating window: Date range of backtests is 2023.01.01 - 2024.01.04. It is chosen to let the strategy to close all opened positions.
Commission and Slippage: Includes a standard Binance commission of 0.1% and accounts for possible slippage over 5 ticks.
Maximum Single Position Loss: -6.29%
Maximum Single Profit: 22.32%
Net Profit: +10 901.95 USDT (+109.02%)
Total Trades: 119 (51.26% profitability)
Profit Factor: 1.775
Maximum Accumulated Loss: 4 185.37 USDT (-22.87%)
Average Profit per Trade: 91.67 USDT (+0.7%)
Average Trade Duration: 56 hours
These results are obtained with realistic parameters representing trading conditions observed at major exchanges such as Binance and with realistic trading portfolio usage parameters. Backtest is calculated using deep backtest option in TradingView built-in strategy tester
How to Use:
Add the script to favorites for easy access.
Apply to the desired chart and timeframe (optimal performance observed on the 1H chart, ForEx or cryptocurrency top-10 coins with quote asset USDT).
Configure settings using the dropdown choice list in the built-in menu.
Set up alerts to automate strategy positions through web hook with the text: {{strategy.order.alert_message}}
Disclaimer:
Educational and informational tool reflecting Skyrex commitment to informed trading. Past performance does not guarantee future results. Test strategies in a simulated environment before live implementation

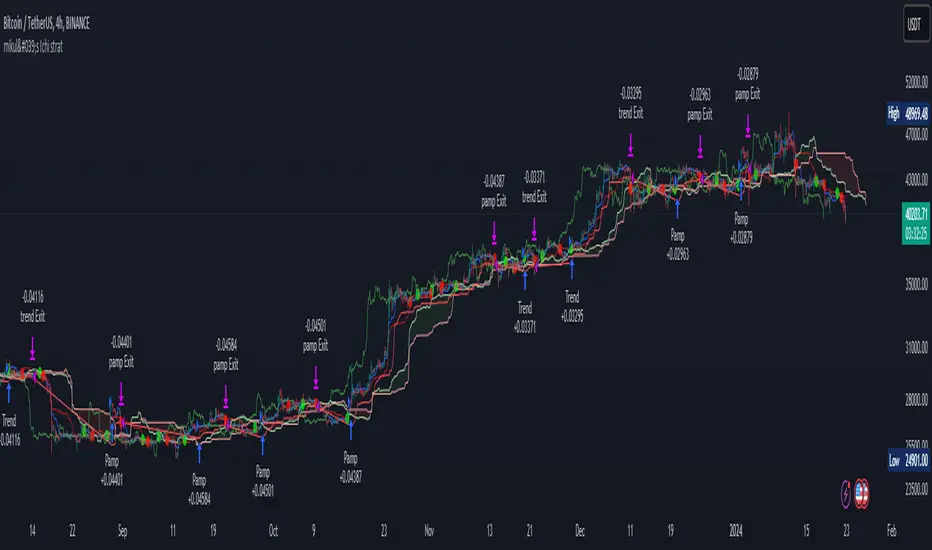
mikul's Ichimoku Cloud Strategy v 2.0This is an Ichimoku cloud (long) strategy with both pump signals and trend signals.
It has both ATR stop loss, trailing percentage stop loss and also ichomoku cloud exit signal.
You can also combine the ATR stop loss and the trailing percentage stop loss with the Ichimoku cloud exit signal and a the take profit percentage.
In this example I use the default ATR stop loss method for taking profit.
10000$ is my initial capital and I risking 10% every trade. Commission is set to 0.075%.
Everything is set to default in this example.
There is also a moving average filter that is available, set to 200 EMA and turned off by default.
Conditions for taking a long position:
Trend Signal:
• Positive cross above the cloud
• Chikou span(lagging span) above price action
• Price above the Cloud
Pump Signal:
• Cloud ahead of you is green
• Price above the cloud
• Positive cross (Doesn’t Matter Where)
• Chikou span(lagging span) above the cloud
Ichimoku cloud exit signals:
• Negative cross
• Chikou span(lagging span) touches the price action
This strategy is totally free as freedom and as in free beer!
I do this for myself, but I like sharing and I want everyone to have the ability to use what I make no matter your economic situation.
If you have any suggestions for this strategy or perhaps any filtering options that could be fun to experiment with, then please leave a comment with your suggestion and maybe I can add it to the next version.
Ichimoku OscillatorFans of the Ichimoku cloud indicator may enjoy this lower study version.
It's all the exact same representation but the cloud is converted to an oscillation in histogram or classic cloud fill formats.
All of the original lines, except Kumo cloud lines, are provided but adjusted to be positionally accurate to the oscillation values.
The oscillation value is calculated simply by absolute subtraction of span a and b lines and as such become an additional width detection mechanism in what I consider to be a slightly cleaner display.
Since the entire cloud can be removed from the main chart, it's necessary to understand price location relative to the values which is calculated and displayed as the 'Price' plot. It is positionally accurate to the oscillation and cross signals can be observed.
My hope is that this serves as a foundation for others to create interesting Ichimoku lower study indicators, and to provide relief to traders looking for cleaner main charts.
I've done my best to ensure accuracy but if any issues are found please let me know.
Feedback and suggestions are welcome, enjoy.
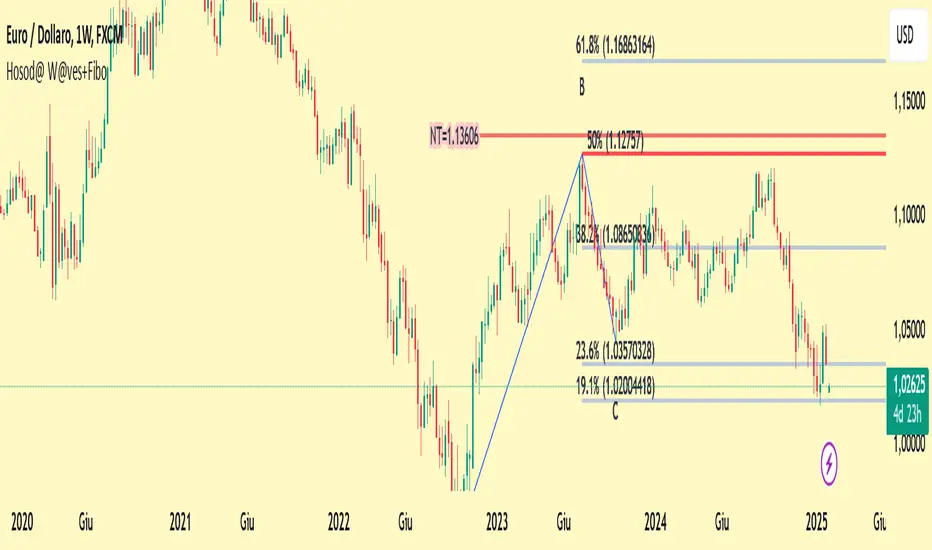
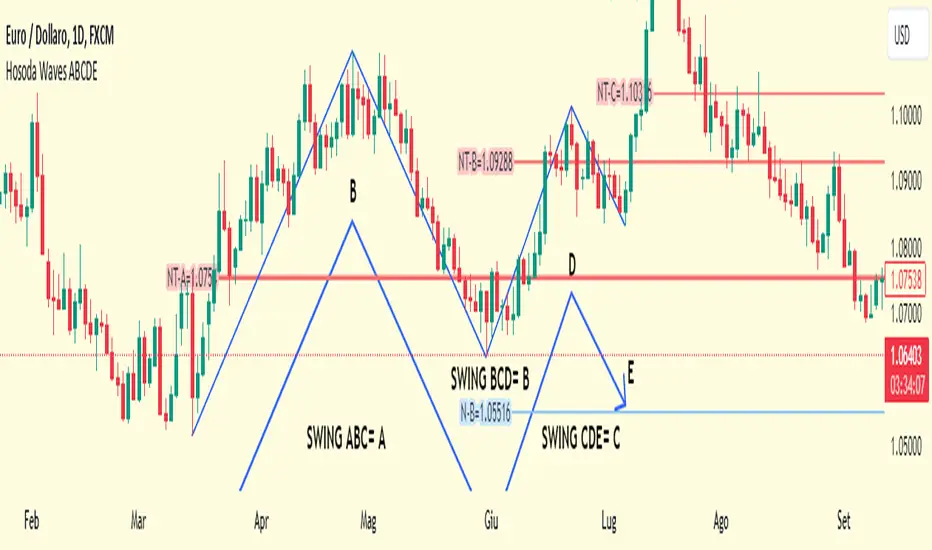
Hosoda Waves ABCThe Hosoda Waves indicator was devised by Goichi Hosoda, the creator of the Ichimoku system, with the idea that previous highs and lows could determine future price ranges to which the market would react. Hosoda's projections include the NT, N, V, and E waves, derived from calculations based on both upward and downward ABC swings. The calculations for Hosoda's waves are as follows:
NT Wave = C + (C - A)
N Wave = B + (B - A)
V Wave = B + (B - C)
E Wave = C + (B - A)
This indicator visually represents the calculations by Hosoda. Additionally, Hosoda indicated time cycles: 9, 17, 26, 33, 42, 51, 65, 76, etc., which are not integrated into this indicator as they are not considered effective in contemporary times.
Once applied to the chart, the interactive Pine Script tool version 5 will prompt you to identify 3 points of "low-high-low" or "high-low-high," both for upward and downward movements. Once clicked, these price points can be moved. If you change the time frame or market instrument, the indicator must be removed because it remains tied to the prices where it was initially drawn.
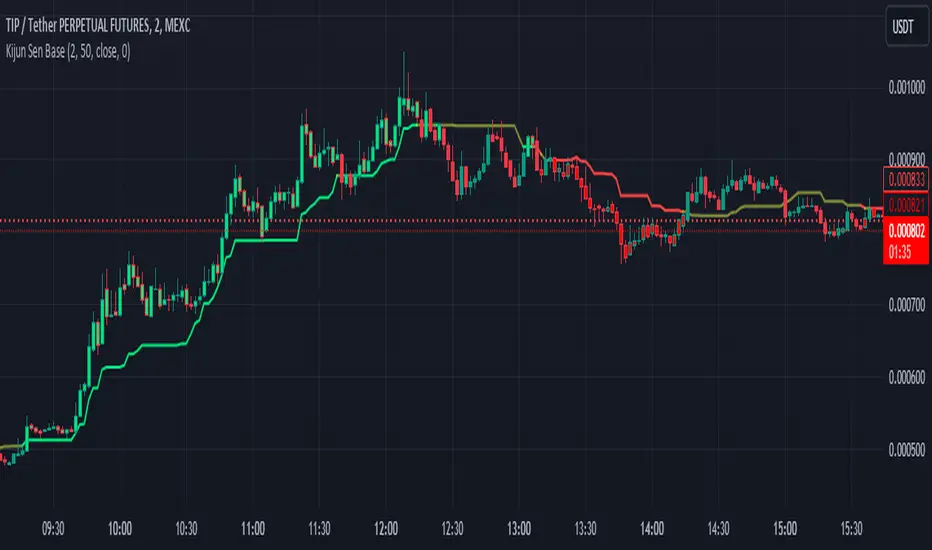
Kijun Sen BaseWhat is Kijun Sen?
Kijun-sen also means "base line" and is the mid-point of the 26-period high and low. Kijun-sen is typically used in conjunction with Tenkan-sen (conversion line) or (the 9-period midpoint price) to generate trade signals when they cross. Kijun-sen is typically used in conjunction with the other Ichimoku indicators.
What is the Kijun Sen Base?
The Kijun Sen Base is the center line in the Ichimoku Cloud Indicator. We have taken that line out and made it an indicator on its own , color-coded it, and allowed traders to track the price for a clean and simple base filter.
Is this a Moving Average?
NO
The Difference Between Kijun-sen (Base Line) and a Simple Moving Average (SMA)
The Kijun-sen is a midpoint of the high and low prices over the last 26 periods. This is not an average.
How do I trade with this Indicator?
Unless there's a lot of recent price movement, enough to pull the price away from the 26-period midpoint, the Kijun-sen will often trade near and intersect with the current price. At times like these, it is not an ideal tool for helping with trend direction. If, however, there is a strong price move away from Kijun Sen and the gap between Kijun Sen and the price is "increasing" or "widening", this is an indication that a trend is forming.
Kijun Sen Base can be used to confirm a trend and is a clean addition to other indicators the trader may use on their charts while at the same time keeping the chart less cluttered.
Happy Trading and Good Luck!
Fiboborsa+BistTitle: "Fiboborsa+Bist Indicator for TradingView"
Description: The "Fiboborsa+Bist" indicator is a powerful tool designed for TradingView users. This indicator offers a comprehensive set of technical indicators to assist you in your technical analysis and trading decisions.
Features:
Simple Moving Averages (SMA): You can enable or disable SMA with different periods (20, 50, 100, 200) to observe different timeframes and trends.
SMA Strategy: Use SMA crossovers to determine trends. Watch for the 20-period SMA crossing above the 50-period SMA for a bullish signal. For a bearish signal, observe the 50-period SMA crossing below the 100-period SMA.
Exponential Moving Averages (EMA): Similar to SMA, you can enable or disable EMA with different periods (5, 8, 14, 21, 34, 55, 89, 144, 233) for more precise trend analysis.
EMA Strategy: Use EMA crossovers and crossunders for short-term trend changes. A buy signal may occur when the 5-period EMA crosses above the 14-period EMA, while a crossunder suggests a selling opportunity.
Weighted Moving Averages (WMA): Customize WMA settings with various periods (5, 13, 21, 34, 89, 144, 233, 377, 610, 987) to suit your trading style.
WMA Strategy: Use WMA crossovers to verify trends. When the 13-period WMA crosses above the 34-period WMA, it may indicate an uptrend.
Buy and Sell Signals: The indicator provides buy and sell signals based on EMA crossovers and crossunders. Strong signals are also highlighted.
EMA Buy and Sell Strategy: Make informed trading decisions using buy and sell signals generated by EMA crossovers and crossunders.
Ichimoku Cloud: You can enable the Ichimoku Cloud for a clear visual representation of support and resistance levels.
Ichimoku Strategy: Use the Ichimoku Cloud to determine trend direction. Entering long positions is common when the price is above the cloud and considering short positions when it's below the cloud. Verify the trend with the Chikou Span.
Bollinger Bands: Easily visualize price volatility by enabling the Bollinger Bands feature.
Bollinger Bands Strategy: Bollinger Bands help you visualize price volatility. Look for potential reversal points when the price touches or crosses the upper or lower bands.
Use the "Fiboborsa+Bist" indicator to enhance your trading strategies and make informed decisions in the dynamic world of financial markets.
Additional Information:
Bollinger Bands: Bollinger Bands are a technical analysis tool used to monitor price volatility and determine overbought or oversold conditions. This indicator consists of three components:
Middle Moving Average (SMA): Typically, a 20-day SMA is used.
Upper Band: Calculated by adding two times the standard deviation to the SMA.
Lower Band: Calculated by subtracting two times the standard deviation from the SMA.
As the price moves between these two bands, it becomes possible to identify potential buying or selling points by comparing its height or low with these bands.
Ichimoku Cloud: The Ichimoku Cloud is a comprehensive indicator used for trend identification, defining support and resistance levels, and measuring trend strength. The Ichimoku Cloud comprises five key components:
Tenkan Sen (Conversion Line): Used to identify short-term trends.
Kijun Sen (Base Line): Used to identify medium-term trends.
Senkou Span A (Leading Span A): Calculated as (Tenkan Sen + Kijun Sen) / 2 and shows future support and resistance levels.
Senkou Span B (Leading Span B): Calculated as (highest high + lowest low) / 2 and indicates future support and resistance levels.
Chikou Span (Lagging Line): Enables tracking the price backward.
The Ichimoku Cloud interprets a price above the cloud as an uptrend and below the cloud as a downtrend. The Chikou Span assists in verifying the current trend.
ADDITIONAL STRATEGY WITH RSI AND MACD INDICATORS
**Strategy: Two-Stage Trading Strategy Using RSI, MACD, and Fiboborsa+Bist Indicators**
**Stage 1: Determining the Trend and Selecting the Trading Direction**
1. **Trend Identification with Fiboborsa+Bist Indicator:**
- Analyze the simple moving averages (SMA), exponential moving averages (EMA), and weighted moving averages (WMA) used with the Fiboborsa+Bist indicator. These indicators will provide information about the direction of the market trend.
2. **Identifying Overbought and Oversold Conditions with RSI:**
- Use the RSI indicator to identify overbought (70 and above) and oversold (30 and below) conditions. This helps in measuring the strength of the trend. If RSI enters the overbought zone, a downward correction is likely. If RSI enters the oversold zone, an upward correction is probable.
3. **Evaluating Momentum with MACD:**
- Examine price momentum using the MACD indicator. When the MACD line crosses above the signal line, it may indicate an increasing upward momentum. Conversely, a downward cross can suggest an increasing downward momentum.
**Stage 2: Generating Buy and Sell Signals**
4. **Combining RSI, MACD, and Fiboborsa+Bist Indicators:**
- To generate a buy signal, wait for RSI to move out of the oversold region into an uptrend and for the MACD line to cross above the signal line.
- To generate a sell signal, wait for RSI to move out of the overbought region into a downtrend and for the MACD line to cross below the signal line.
5. **Confirmation with Fiboborsa+Bist Indicator:**
- When you receive a buy or sell signal, use the Fiboborsa+Bist indicator to confirm the market trend. Confirming the trend can strengthen your trade signals.
6. **Setting Stop-Loss and Take-Profit Levels:**
- Remember to manage risk when opening buy or sell positions. Set stop-loss and take-profit levels to limit your risk.
7. **Monitor and Adjust Your Trades:**
- Continuously monitor your trade positions and adjust your strategy as per market conditions.
This two-stage trading strategy offers the ability to determine trends and generate trade signals using different indicators. However, every trading strategy involves risks, so risk management and practical application are essential. Also, it's recommended to test this strategy in a demo account before using it in a real trading account.

Ichimoku Oscillator With Divergences [ChartPrime]The Ichimoku Oscillator is a trading indicator designed to streamline the interpretation of Ichimoku clouds. It aims to refine and condense the complexities of the Chikou (the lag line), presenting its implications in real-time through an oscillator format, beneficial for those familiar with Ichimoku components but to have a new interpretation of their indicators.
The basics of an Ichimoku:
Conversion Line (Tenkan-Sen): It represents a midpoint of the highest and lowest prices over a specific period, usually 9 periods, reflecting short-term price movements.
Base Line (Kijun-Sen): It acts similarly to the Conversion Line but over a longer period, typically 26 periods, representing medium-term price movements.
Leading Span A & B (Kumo): Span A is the average of the Conversion Line and Base Line, and Span B is the midpoint of the highest and lowest prices over a usually longer period, typically 52 periods. Their interaction denotes trend direction, and the cloud color changes depending on whether Span A is above or below Span B, indicating bullish or bearish market conditions, respectively.
Lagging Span (Chikou Span): It is the current closing price plotted 26 periods behind, assisting in confirming the trend direction and potential momentum.
Advantage of an Oscillator:
Utilizing the oscillator format allows traders to interpret market dynamics more efficiently by visualizing the momentum and trend strength in a bounded range, enabling quick assessments of overbought or oversold conditions. Creating this oscillator provides multiple advantageous; particularly in sideway markets, helping to identify potential reversal points and offering insights on market entries and exits. When building this oscillator we've put a focus on unique interpretations such as overbought and sold areas and divergences; otherwise not found in traditional Ichimoku techniques. It is important to note these divergences are naturally not 100% real time.
When the oscillator turns green; the market is in an uptrend, red for downtrend and yellow for a transitioning market. The center line and the inner most cloud represent a balanced market state.
Key Features & Input Parameters:
Signal Source: Allows the selection of the price data source for signal generation, such as closing prices, and it’s the foundational parameter upon which the oscillator functions.
Normalization Settings: Users can select the normalization mode (“All”, “Window”, or “Disabled”), influencing how the oscillator scales its values. When enabled, it will scale from 100 to -100, allowing the user to understand better the relative positioning of price data.
Smoothing: This indicator offers advanced smoothing features, with options for additional smoothing, allowing traders to adjust the signal's sensitivity to price movements.
Kumo & Chikou Visibility: Traders can customize the visibility settings of Kumo and Chikou, tailoring the display of each component to their preference, enabling a cleaner and more intuitive view of market conditions.
Color Coding: Each component and condition, like bullish or bearish states, can be color-coded, providing visual cues to enhance the interpretability of market trends and states.
Color on Conversion: The oscillator provides an option to color the signal based on the crossover of the conversion and base lines.
Divergence: The oscillator can detect and highlight regular and hidden bullish and bearish divergences between the signal and price, aiding traders in identifying potential trend reversals or continuations.
Alerts:
The list of inbuilt alerts are provided below:
Inside Cloud: The signal line is inside the cloud.
Up Out of Cloud: The signal line crossed above the cloud.
Down Out of Cloud: The signal line crossed below the cloud.
Future Kumo Cross Bullish: The future Kumo lines have crossed in a bullish manner.
Future Kumo Cross Bearish: The future Kumo lines have crossed in a bearish manner.
Current Kumo Cross Bullish: The current Kumo lines have crossed in a bullish manner.
Current Kumo Cross Bearish: The current Kumo lines have crossed in a bearish manner.
Conversion Base Bullish: The conversion line crossed above the base line.
Conversion Base Bearish: The conversion line crossed below the base line.
Signal Bullish on Conversion Base: The signal line crossed above the maximum of conversion and base lines.
Signal Bearish on Conversion Base: The signal line crossed below the minimum of conversion and base lines.
Chikou Bullish: The Chikou line crossed above zero.
Chikou Bearish: The Chikou line crossed below zero.
Signal Over Max: The signal line crossed above the max level.
Signal Over High: The signal line crossed above the high level.
Signal Under Min: The signal line crossed below the min level.
Signal Under Low: The signal line crossed below the low level.
Chikou Over Max: The Chikou line crossed above the max level.
Chikou Over High: The Chikou line crossed above the high level.
Chikou Under Min: The Chikou line crossed below the min level.
Chikou Under Low: The Chikou line crossed below the low level.
Signal Crossover MA: The signal line crossed over the moving average.
Signal Crossunder MA: The signal line crossed under the moving average.
Regular Bullish Divergence: Regular bullish divergence detected.
Hidden Bullish Divergence: Hidden bullish divergence detected.
Regular Bearish Divergence: Regular bearish divergence detected.
Hidden Bearish Divergence: Hidden bearish divergence detected.
Bounce off of Kumo Up: Bullish Bounce off of Kumo.
Bounce off of Kumo Down: Bearish Bounce off of Kumo.
By providing a cohesive visualization of the Ichimoku elements and market momentum within a bounded range, this oscillator is a unique tool and insight into markets.

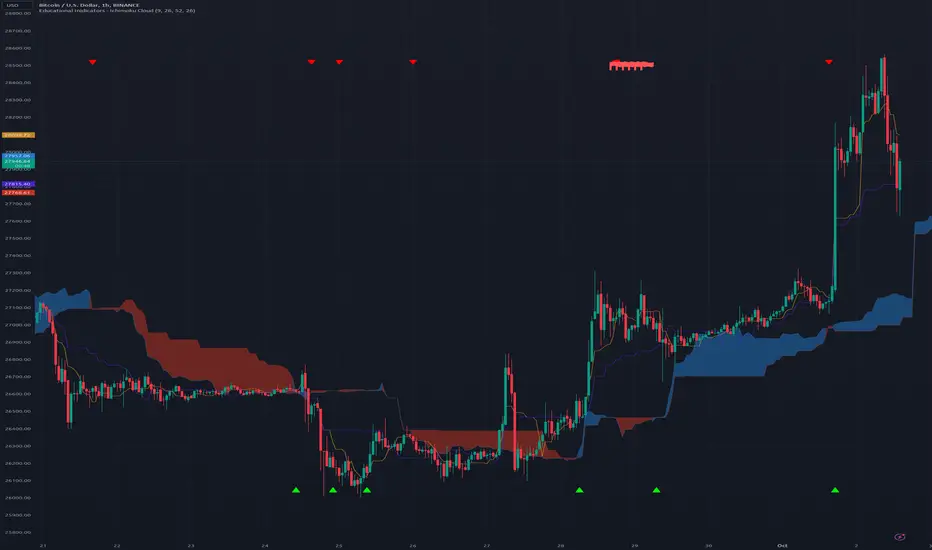
Educational Inidicators - Ichimoku CloudThis indicator is part of the Indicator Educational Series, intended to help newer traders understand and interact with various indicators. The goal is to allow users to gain a stronger understanding of an indicator's underlying philosophy, and visually see how changes to an indicator's parameters affects the trades suggested by that indicator.
The scripts in this series are all open source, with the code broken up into logical section and notated so beginner users can also understand some PineScript fundamentals.
Please understand that no indicator presented in and of itself constitutes a complete trading strategy. Rather, this series is to help users determine which indicators make sense to them, and which ones to combine to create their own trading strategy. All material presented is purely for educational purposes.
Presented here is the Ichimoku Cloud.
The Ichimoku Cloud was developed by Goichi Hosada, and first published in the late 1960s. It is used by traders to understand price momentum, and help forecast future price movements.
The indicator at its core can be understood from four component parts:
The Conversion Line - An average of the highest and lowest price in a given window. Typically, this is a "fast" average, and as such, this line has the lowest period
The Base Line - An average of the highest and lowest price in a given window. This is a "slower" average than the Conversion Line, and as such should have a larger period than the Conversion Line
Leading Span A - The average of the Conversion Line and the Base Line
[*}Leading Span B - An average of the highest and lowest price in a given window. This is the "slowest" average of all three, and as such should have the largest period
When plotted, the Conversion Line (orange by default), Base Line (purple by default), Leading Span A (blue by default), and Leading Span B (red by defaults) are all drawn on the chart along with the price candles. The area between the Leading Span A and Leading Span B lines are also shaded depending on which of the two lines is greater: whenever Leading Span A is greater the area is shaded positively (blue by default), whenever Leading Span B is greater the area is shaded negatively (red by defaults).
One interesting feature of the Ichimoku Cloud is that it drawn a certain number of candles forward. What this means is that where the cloud is drawn on the chart is reflective of prices that have occurred a number of candles in the past. This is done intentionally to help traders see how the current price is moving in relation to historical price movements on the asset.
See below for how the indicators look in their default colors on the chart
These indicators can then be used to start analyzing the price movement, and making trade decisions.
The first inference we can make is the momentum of the price. Since the lines are drawn from averages of varying speeds, the shaded area between the Leading Span lines can tell us whether the momentum is bullish (up) or bearish (down).
Whenever Leading Span A, the faster of the two lines, is above Leading Span B, that means that price is moving upward faster than it typically has, ergo we are in Bullish Momentum. On the chart, this is indicated in two ways:
The area is shaded positively (blue by default)
A green upward triangle is added to the chart to indicate where the momentum first turned Bullish
Whenever Leading Span A is below Leading Span B, that means that price is moving downward faster than it typically has, ergo we are in Bearish Momentum. On the chart, this is indicated in two ways:
The area is shaded negatively (red by default)
A red downward triangle is added to the chart to indicate where the momentum first turned Bearish
The next inference we can make is possible trading points. When we're in a period of momentum, as determined above, we know that price is going up or down, depending on the momentum we're in. We can then use the Conversion Line, Base Line, and the Price itself to confirm a good trade price.
When the asset is in Bullish Momentum, and the Conversion Line, our fastest average, is above the Base Line, our mid speed average, we know that the price is coming up quickly in the short term. When the Base Line and current Price are also above the cloud, then we have triple confirmation that price is going up, and we should enter a Long position. On the chart, this point is indicated with a green flag.
When the asset is in Bearish Momentum, and the Conversion Line is below the Base Line, we know that the price is going down quickly in the short term. When the Base Line and current Price are also below the cloud, then we have triple confirmation that price is going down, and we should enter a Short position. On the chart, this point is indicated with a red flag.
The script presented here also allows users to customize the various parameters of the Ichimoku Cloud, and visually see how analysis is affected by these changes. This is designed to allow users to modify parameters as they see fit, within certain constraints, to find the best set for them. The lines, cloud, and chart indicators will all update automatically with the users' inputs.
DIY Custom Strategy Builder [ZP] - v1DISCLAIMER:
This indicator as my first ever Tradingview indicator, has been developed for my personal trading analysis, consolidating various powerful indicators that I frequently use. A number of the embedded indicators within this tool are the creations of esteemed Pine Script developers from the TradingView community. In recognition of their contributions, the names of these developers will be prominently displayed alongside the respective indicator names. My selection of these indicators is rooted in my own experience and reflects those that have proven most effective for me. Please note that the past performance of any trading system or methodology is not necessarily indicative of future results. Always conduct your own research and due diligence before using any indicator or tool.
===========================================================================
Introducing the ultimate all-in-one DIY strategy builder indicator, With over 30+ famous indicators (some with custom configuration/settings) indicators included, you now have the power to mix and match to create your own custom strategy for shorter time or longer time frames depending on your trading style. Say goodbye to cluttered charts and manual/visual confirmation of multiple indicators and hello to endless possibilities with this indicator.
What it does
==================
This indicator basically help users to do 2 things:
1) Strategy Builder
With more than 30 indicators available, you can select any combination you prefer and the indicator will generate buy and sell signals accordingly. Alternative to the time-consuming process of manually confirming signals from multiple indicators! This indicator streamlines the process by automatically printing buy and sell signals based on your chosen combination of indicators. No more staring at the screen for hours on end, simply set up alerts and let the indicator do the work for you.
Available indicators that you can choose to build your strategy, are coded to seamlessly print the BUY and SELL signal upon confirmation of all selected indicators:
EMA Filter
2 EMA Cross
3 EMA Cross
Range Filter (Guikroth)
SuperTrend
Ichimoku Cloud
SuperIchi (LuxAlgo)
B-Xtrender (QuantTherapy)
Bull Bear Power Trend (Dreadblitz)
VWAP
BB Oscillator (Veryfid)
Trend Meter (Lij_MC)
Chandelier Exit (Everget)
CCI
Awesome Oscillator
DMI ( Adx )
Parabolic SAR
Waddah Attar Explosion (Shayankm)
Volatility Oscillator (Veryfid)
Damiani Volatility ( DV ) (RichardoSantos)
Stochastic
RSI
MACD
SSL Channel (ErwinBeckers)
Schaff Trend Cycle ( STC ) (LazyBear)
Chaikin Money Flow
Volume
Wolfpack Id (Darrellfischer1)
QQE Mod (Mihkhel00)
Hull Suite (Insilico)
Vortex Indicator
2) Overlay Indicators
Access the full potential of this indicator using the SWITCH BOARD section! Here, you have the ability to turn on and plot up to 14 of the included indicators on your chart. Simply select from the following options:
EMA
Support/Resistance (HeWhoMustNotBeNamed)
Supply/ Demand Zone ( SMC ) (Pmgjiv)
Parabolic SAR
Ichimoku Cloud
Superichi (LuxAlgo)
SuperTrend
Range Filter (Guikroth)
Average True Range (ATR)
VWAP
Schaff Trend Cycle ( STC ) (LazyBear)
PVSRA (TradersReality)
Liquidity Zone/Vector Candle Zone (TradersReality)
Market Sessions (Aurocks_AIF)
How it does it
==================
To explain how this indictor generate signal or does what it does, its best to put in points.
I have coded the strategy for each of the indicator, for some of the indicator you will see the option to choose strategy variation, these variants are either famous among the traders or its the ones I found more accurate based on my usage. By coding the strategy I will have the BUY and SELL signal generated by each indicator in the backend.
Next, the indicator will identify your selected LEADING INDICATOR and the CONFIRMATION INDICATOR(s).
On each candle close, the indicator will check if the selected LEADING INDICATOR generates signal (long or short).
Once the leading indicator generates the signal, then the indicator will scan each of the selected CONFIRMATION INDICATORS on candle close to check if any of the CONFIRMATION INDICATOR generated signal (long or short).
Until this point, all the process is happening in the backend, the indicator will print LONG or SHORT signal on the chart ONLY if LEADING INDICATOR and all the selected CONFIRMATION INDICATORS generates signal on candle close. example for long signal, the LEADING INDICATOR and all selected CONFIRMATION INDICATORS must print long signal.
The dashboard table will show your selected LEADING and CONFIRMATION INDICATORS and if LEADING or the CONFIRMATION INDICATORS have generated signal. Signal generated by LEADING and CONFIRMATION indicator whether long or short, is indicated by tick icon ✔. and if any of the selected CONFIRMATION or LEADING indicator does not generate signal on candle close, it will be indicated with cross symbol ✖.
how to use this indicator
==============================
Using the indicator is pretty simple, but it depends on your goal, whether you want to use it for overlaying the available indicators or using it to build your strategy or for both.
To use for Building your strategy: Select your LEADING INDICATOR, and then select your CONFIRMATION INDICATOR(s). if on candle close all the indicators generate signal, then this indicator will print SHORT or LONG signal on the chart for your entry. There are plenty of indicators you can use to build your strategy, some indicators are best for longer time frame setups while others are responsive indicators that are best for short time frame.
To use for overlaying the indicators: Open the setting of this indicator and scroll to the SWITCHBOARD section, from there you can select which indicator you want to plot on the chart.
For each of the listed indicators, you have the flexibility to customize the settings and configurations to suit your preferences. simply open indicator setting and scroll down, you will find configuration for each of the indicators used.
I will also release the Strategy Backtester for this indicator soon.

Hosoda Waves ABCDEThe Hosoda Waves indicator was devised by Goichi Hosoda, who is also the creator of the Ichimoku system, with the idea that previous highs and lows could determine future price ranges that the market would react to.
Hosoda's projections are the NT, N, V, and E waves, which are derived from calculations based on both upward and downward ABC swings.
Hosoda's waves are derived from the following calculations:
NT Wave = C + (C - A)
N Wave = B + (B - A)
V Wave = B + (B - C)
E Wave = C + (B - A)
There are already scripts for the Hosoda waves, and my idea is to project an ABCDE swing simultaneously, meaning projecting three swings:
ABC, indicated with an A, resulting in NT-A, N-A, V-A, E-A.
BCD, indicated with a B, resulting in NT-B, N-B, V-B, E-B.
CDE, indicated with a C, resulting in NT-C, N-C, V-C, E-C.
Once the indicator is applied to the chart, the interactive Pine Script tool version 5 will prompt you to identify 5 points of "low-high-low-high-low" or "high-low-high-low-high," both for upward and downward movements and mixed.
Once clicked, these price points can be moved. If you change the time frame or market instrument, the indicator must be removed because it remains tied to the prices where it was initially drawn.
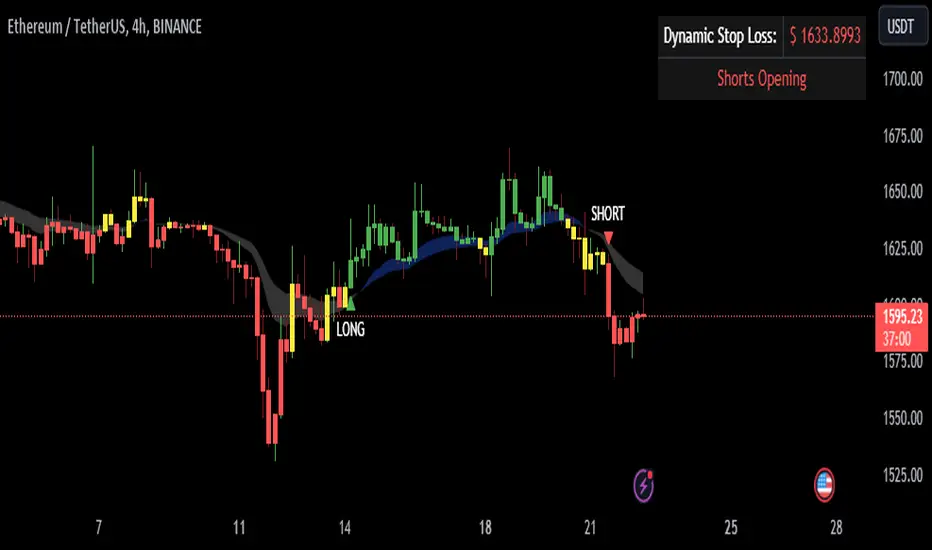
Ichimoku MA BandsThis indicator is based on the price average of the Ichimoku Strategy taking into account the last twenty five bars.
The blue band represents an upward momentum whereas the white band represents a downward momentum.
The red line is the 50 EMA which is used as a dynamic support resistance level for this strategy.
This indicator also has alerts that can be enabled by the user.
Disclaimer :
The current script should be used in confluence with other trading strategies and not in isolation. The scripts works best on 5M and 15M Timeframes and should be used with caution on lower timeframes.
This indicator is not intended to give exact entry or exit points for a trade but to provide a general idea of the trend & determine a good range for entering or exiting the trade. Please DYOR
Credit & References :
This script uses the default technical analysis reference library provided by PineScript (denoted as ta)
IKH Cloud V1.0 (nextSignals)The IKH Cloud V1.0 (nextSignals) is an Ichomoku-type indicator that can be used for various trading strategies. It's based on a ThinkScript study from @stephenharlinmd (aka nextSignals) that uses an instantaneous moving average as the base MA, and a custom trailing stop. Both of these components form the cloud.
Indicator Components and Calculation
The indicator comprises two key components:
Instantaneous Moving Average (IMA) : This is a type of moving average that places a greater weight on the most recent data points, and is based on Ehler's book "Rocket Science for Traders". This is slightly different from the Doc's original, but is very approximate.
Trailing Stop : This component helps determine the stop loss level that moves along with the price. The trailing stop is based on the highest high and the lowest low of the last 5 bars, as well as the simple moving averages of the low and high of the previous bar. The trailing stop is calculated separately for each condition: when the bar index is greater than 1 and when the previous 'a' variable is either 1 or 0.
These two components are used to create a filled area on the chart, also known as the 'cloud'. The color of the cloud and the candlesticks change based on the relative positions of the IMA and the trailing stop.
How to Use the Indicator
The following are just ideas on how to use this indicator, and is not financial advice in any form:
Trend Identification: When the IMA is above the trailing stop (cloud), it indicates an uptrend, and when it's below, it indicates a downtrend.
Entry/Exit Signals: Traders can consider going long when the candlesticks move above the cloud and short when they move below the cloud.
Stop Loss Level: The trailing stop line (the cloud's edge) can serve as a dynamic stop loss level.
Please don't use just this indicator on its own. Please use this in conjunction with other analysis tools, indicators, and systems you already have in place. Always consider the overall market context and use appropriate risk management strategies.
Ichimoku Cloud Momentum & Trend Indicator «NoaTrader»If you like Ichimoku cloud and use it in your analysis, or you are new to it and sometimes gets tricky to figure out all the details, this indicator tries to simplify that and visualize the change of trend and momentum relative to the past based on ichimoku.
The RED/GREEN columns are showing momentum strength while the black diamond line suggests the trend change. The conditions are simple enough to check them out on the script.
As you can see highlighted cyan circles on the chart as major important signals on the chart of Bitcoin daily timeframe.
This script tries to be complementary to the ichimoku cloud itself and cannot replace the levels represented by the cloud on chart.
Banded Chikou Breakout — Quantifying Ichimoku MomentumTitle: Banded Chikou Breakout — Quantifying Ichimoku Momentum
Overview:
Banded Chikou Breakout (BCB) is a unique, algorithmic script designed to augment the capabilities of traders seeking substantial breakout opportunities. Constructed on the robust principles of the Ichimoku trading strategy, BCB is designed to quantify and filter the Chikou Span's significant breakouts above or below the price action. This script does not aim to replace the Ichimoku system; instead, it enhances it, providing an optimized tool for momentum trading.
Rationale:
Ichimoku traders often scrutinize the Chikou Span's position relative to price action to identify market trends. However, determining whether the Chikou Span is above or below due to a genuine trend or mere market noise can be challenging in choppy markets. BCB resolves this predicament by offering a unique way to interpret the Chikou Span's movement. It does so by quantifying the Chikou Span's momentum and utilizing Bollinger Bands to determine its significance. By effectively differentiating substantial movements from the insignificant, BCB can help traders better navigate the market and increase their potential for profitable trades.
How it Works:
BCB combines three key elements: a Momentum Script (simulating Chikou Span), a Bollinger Band Script, and a Timeframe Switcher, all working together to provide a refined trading perspective.
Momentum Script: Calculates the price difference between the current price and the price 'n' periods ago, transforming the Chikou Span into a quantifiable momentum value that signifies the strength and speed of a market move.
Bollinger Band Script: Computes a Simple Moving Average (SMA) around the momentum, plotting two 'bands' at a specified standard deviation from this SMA. This functionality allows traders to discern when the Chikou Span's momentum is abnormally high or low, signifying a potential significant breakout.
Timeframe Switcher: This feature lets traders apply the BCB script to a different timeframe from the one they are currently viewing. This capability can help traders identify higher timeframe breakouts and trade them with precision on the lower timeframe.
How to Use:
BCB is designed to complement the Ichimoku strategy for effective breakout identification.
Add the BCB script to your trading chart. It plots the momentum (yellow line) and Bollinger Bands (green lines) with the area between the bands shaded blue.
Utilize the Ichimoku strategy to identify larger and smaller timeframe trends.
Optional: Leverage the timeframe switcher to synchronize your trades with higher timeframe trends while operating on lower timeframes.
If the BCB momentum line crosses the upper Bollinger Band while the Ichimoku indicates a bullish trend, it signifies a potential significant upward breakout. Similarly, a cross below the lower band during a bearish trend could denote a significant downward breakout.
Remember, without the context provided by the Ichimoku system's trend analysis, BCB can yield false breakouts. It is, therefore, crucial to use these tools in tandem. I like to check for an Ichimoku trend on the 4H and 1H charts, and then use BCB on charts <60 minutes to capture trends with precision.

Simple Ichimoku Kinko Hyo Cloud█ OVERVIEW
This indicator as an educational and showcase the usage of user-defined types or objects (UDT) for Ichimoku Kinko Hyo or Ichimoku Cloud.
█ CREDITS
TradingView
