Current Price (Customizable) by DRtradeCurrent Price Line & Dynamic Label (Fully Customizable)
The ultimate tool for clear, real-time price visualization.
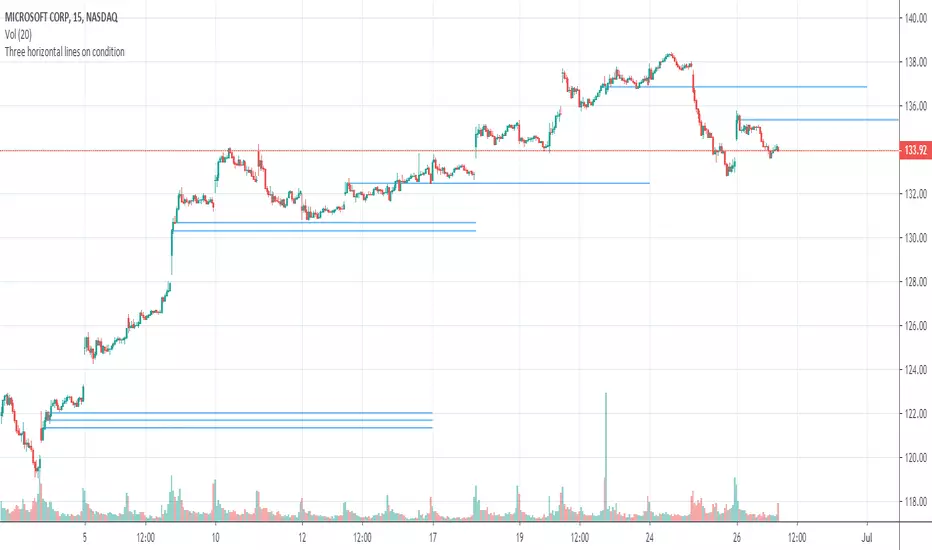
This powerful, lightweight indicator draws a clean horizontal line at the current market price, updating instantly with every price tick. Unlike other current price line scripts, this tool ensures you always see where the price is right now and provides full control over every visual element.
Key Features:
- Real-Time Tracking: The line moves dynamically with price ticks within the current candle, eliminating lag and providing true current market price awareness.
- Line Extension Control: Choose to extend: Left, Right, or Both. Helpful for scalpers and options traders
- Visual Customizations: Color, Style, Size, Width, etc.
- Label Positioning: Left of Candle, Above Candle, or Right of Candle
All customization options are available in the indicator's settings menu.
Ping me with feature reqeusts.
Horizontal-line

Multi-Timeframe 20 EMA Horizontal LinesOverview
This Multi-Timeframe 20 EMA indicator provides intelligent trend analysis by displaying your current timeframe EMA alongside relevant higher timeframe EMA levels as horizontal support/resistance lines. On lower timeframes, you see all higher EMA levels for comprehensive multi-timeframe confluence, while on higher timeframes, it filters out lower timeframe noise to maintain focus on macro trends. This allows traders to align short-term entries with long-term market structure, identifying high-probability setups where multiple timeframe EMAs converge while using the current timeframe EMA for precise timing.
Feature
Multi-Timeframe Horizontal EMA Lines
The indicator fetches and displays 20 EMAs from five higher timeframes:
Daily (D): Daily 20 EMA
Weekly (W): Weekly 20 EMA
Monthly (M): Monthly 20 EMA
Quarterly (Q): 3-Month 20 EMA
Half-Yearly (HY): 6-Month 20 EMA
Intelligent Timeframe Filtering
Smart Display Logic: Only shows EMAs from timeframes higher than your current chart timeframe
Prevents Redundancy: Automatically filters out lower timeframe EMAs to avoid clutter
Example: On a 4-hour chart, you'll see Daily, Weekly, Monthly, Quarterly, and Half-Yearly EMAs, but on a Weekly chart, you'll only see Weekly and higher timeframes
Half-Yearly (HY): 6-Month 20 EMA
Shows only current timeframe EMA with half-yearly horizontal line, filtering out all lower timeframes.
Quarterly (Q): 3-Month 20 EMA
Displays current timeframe EMA with quarterly and higher horizontal lines, hiding monthly, weekly, and daily EMAs.
Monthly (M): Monthly 20 EMA
Shows current timeframe EMA with monthly and higher horizontal EMAs, excluding weekly and daily timeframes.
Weekly (W): Weekly 20 EMA
Displays current timeframe EMA with weekly and higher horizontal EMA lines, filtering out daily timeframe.
Daily (D):
Shows current timeframe EMA with all higher timeframe horizontal EMAs (daily, weekly, monthly, quarterly, half-yearly).
Note: Make sure to enable Price-Line in Style Settings after Importing Script.