RSI Scaling (UO)Plot price scaled by the RSI. Also, plot high and low of the scaled price so that the trend is visible as well as sell-high/buy-low points...
Before the prices change direction, RSI generally makes a double top/bottom... Or a lower high/higher low.
This is more emphasized on the scaled price. You can see the high/low band change direction
Highlow

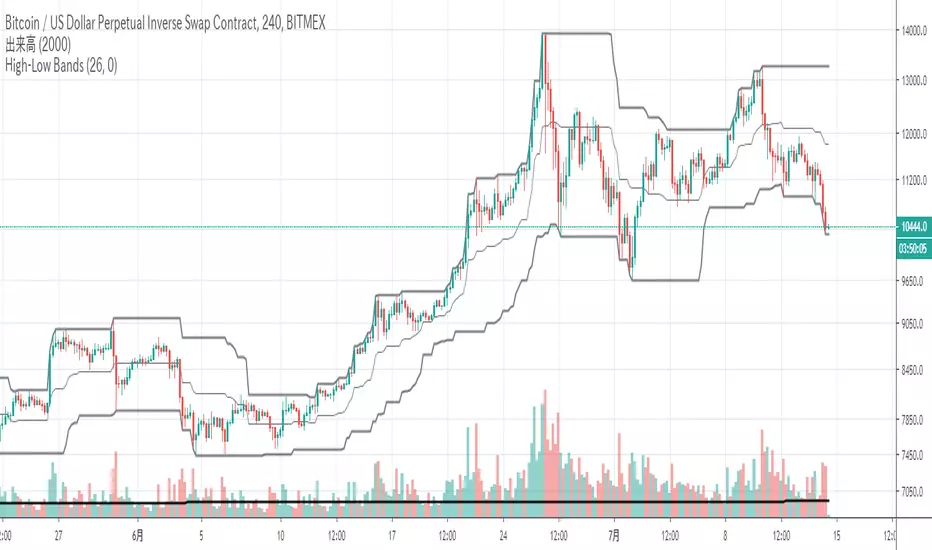
High Low BandsIt is just a high-low band. I published it because I could not find something good.
ただのハイローバンドです。何故か良いのが見つからないので公開しました。


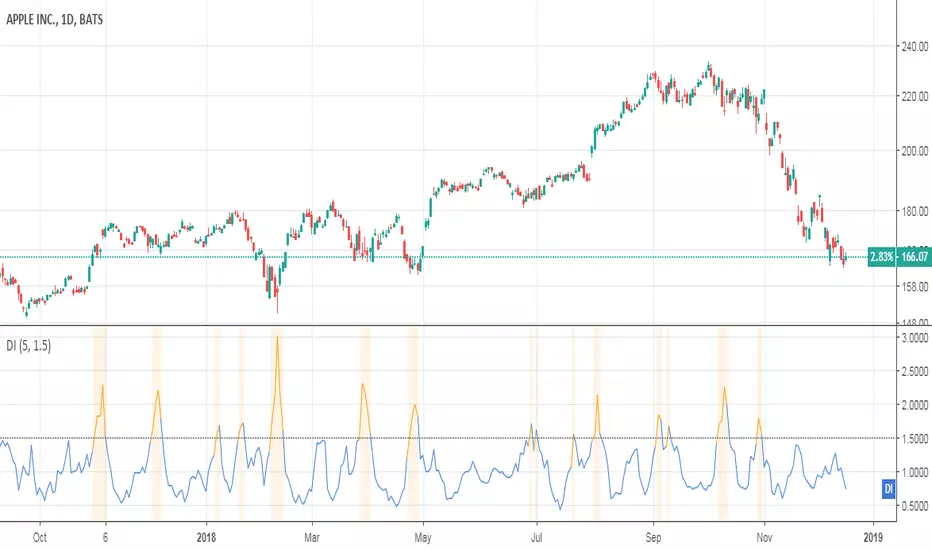
Damping IndexThis indicator was originally developed by Curtis McKallip Jr. (Stocks & Commodities, V.10:7 (296-299): "The Damping Index").
It indentifies bars where the highs and lows are getting close and closer. A high Damping Index value means that the difference between the high price and low price is becoming lower and the security price is reaching equilibrium. A low Damping Index value means that the difference between the high and low prices is increasing.
Good luck and happy trading!
Hermes Scalping Study by ZekisA simple scalping indicator, based on Highs and Lows.
It's working in any timeframe, the only condition is ... volatility .
Values are already set, but you can change them according to your preferences and to your chart.
Alerts are enabled.
Enjoy!
@ Zekis

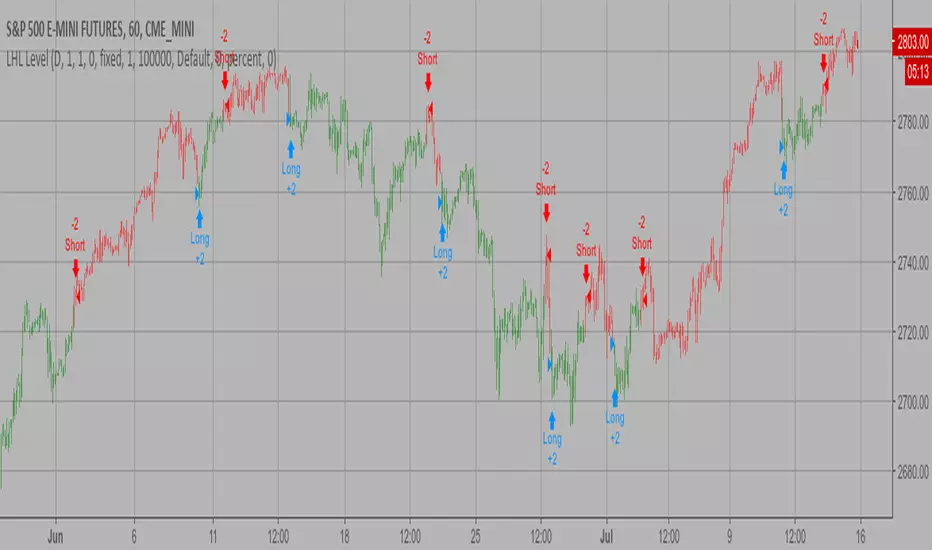
Last High and Low Level Backtest This script shows a high and low period value.
SelectPeriod - Day or Week or Month and etc.
LookBackPeriods - Shift levels 0 - current period, 1 - previous and etc.
You can change long to short in the Input Settings
WARNING:
- For purpose educate only
- This script to change bars colors.
Last High and Low Level Strategy This script shows a high and low period value.
SelectPeriod - Day or Week or Month and etc.
LookBackPeriods - Shift levels 0 - current period, 1 - previous and etc.
WARNING:
- This script to change bars colors

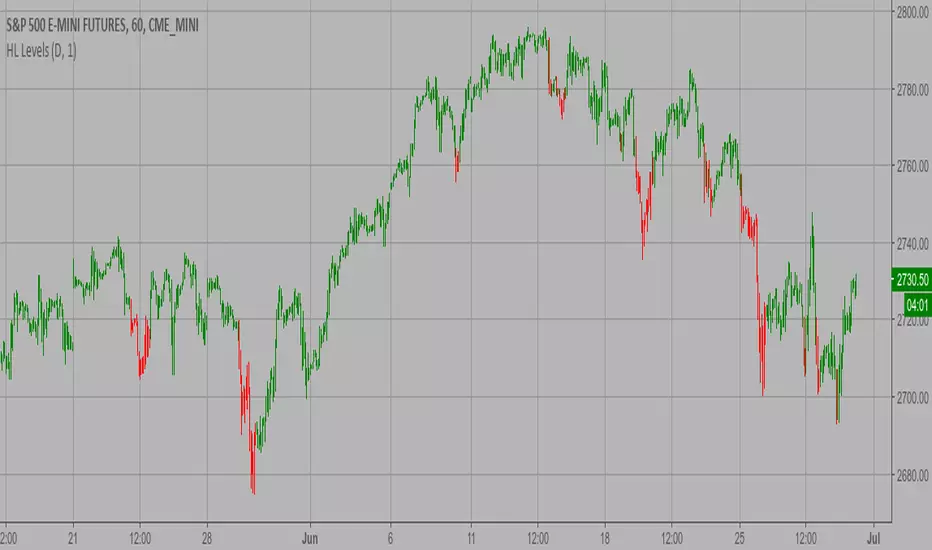
High and Low Levels Backtest This script shows a high and low period value.
Width - width of lines
SelectPeriod - Day or Week or Month and etc.
LookBack - Shift levels 0 - current period, 1 - previous and etc.
You can change long to short in the Input Settings
WARNING:
- For purpose educate only
- This script to change bars colors.

High and Low Levels Strategy This script shows a high and low period value.
Width - width of lines
SelectPeriod - Day or Week or Month and etc.
LookBack - Shift levels 0 - current period, 1 - previous and etc.
WARNING:
- This script to change bars colors.
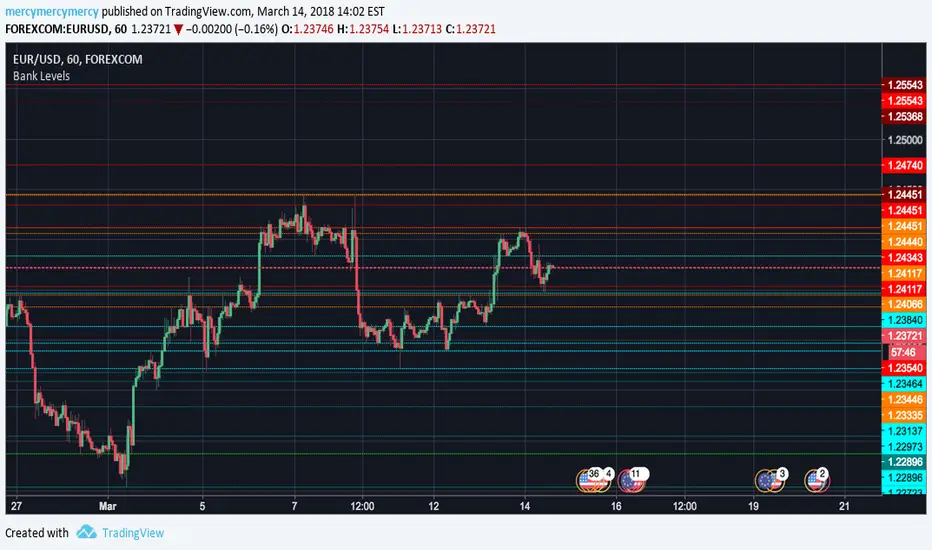
Bank Levels (Colored)Bank levels - highs and lows - of the previous day, week, and month only, colored in for visual effect. Includes history of past bank levels as opposed to my other bank levels script.
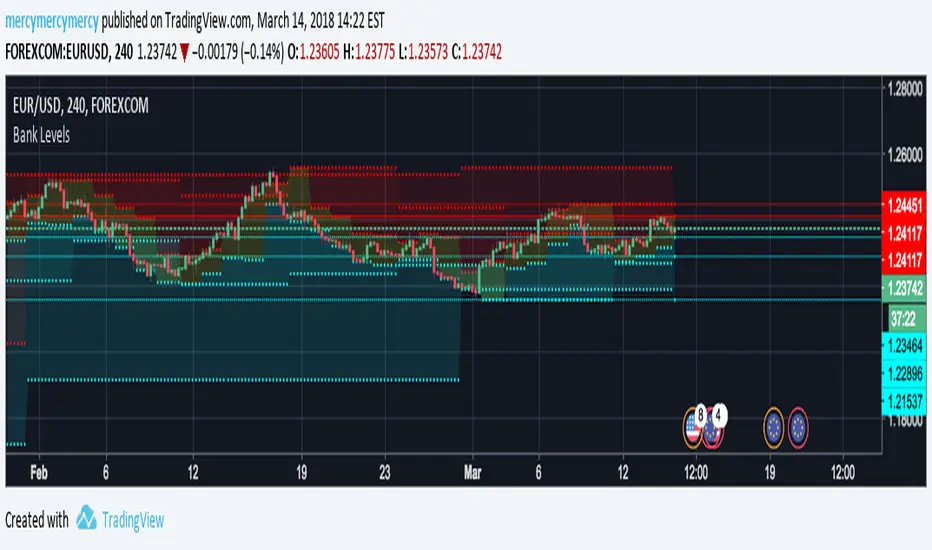
Bank Levels, 6 Previous, D W MIf you trade Forex this is the indicator you need above all. Most recent six highs and lows on the daily, weekly, and monthly (includes current day). Support and resistance isn't quite what it is...until when that's exactly how it often plays out on the lines. They are called bank levels for a reason. *Not every line will support or resist of course*
B3 Bar Cycle MTF (fix)Apologies, there was an error in printing for the thick gray boxes, happened when MTF was switched on. All better, and here is the details from before:
This is an interesting study that can be used as a tool for determining trend direction, and also could be a trailing stop setter. I use it as a gauge on MTF settings. If on, you can look at the bar cycle of the 1h while on the 15m giving you a lot of information in one tool. If a line is missing high or low, it is because it was broken, if both exist you are trading in range and cloud appears. If both sides break you get thick gray boxes above and below bar.
Get used to editing the inputs to suit your liking. Often 3-5 length and always looking at different resolutions to get a big picture story. You could put multiple instances of the study up to see them simultaneously. I based the idea off of Krausz's 3 day cycle which you can read about in his teachings. I tend to find it looking better using Heikin Ashi bar-style.

B3 Bar Cycle MTFThis is an interesting study that can be used as a tool for determining trend direction, and also could be a trailing stop setter. I use it as a gauge on MTF settings, in the pic MTF is turned off. If on, you can look at the bar cycle of the 1h while on the 15m giving you a lot of information in one tool. If a line is missing high or low, it is because it was broken, if both exist you are trading in range and cloud appears. If both sides break you get thick gray boxes above and below bar.
Get used to editing the inputs to suit your liking. Often 3-5 length and always looking at different resolutions to get a big picture story. You could put multiple instances of the study up to see them simultaneously. I based the idea off of Krausz's 3 day cycle which you can read about in his teachings. I tend to find it looking better using Heikin Ashi bar-style.

Currency Pairs High Low RangeIndicator gives the High-Low range of 18 currency pairs. There is a High Ave which is the average of the top four (you may need to adjust which ones are in the average) as well as the bottom four Low Ave. The picture is of a weekly chart with the indicator set at 12 week average of the High-Low range with a .7 (70%) multiplier. When I am looking for week long trades with lots of movement I pick my pairs based on the most actives with a 70% capture of the range as a guide line of when to exit. Sometime when I am not in the mood for volatility I go with the ones in the Low Ave area. Further, when I day trade I set the indicator to a 1Day chart and move the percent to 20% or 30% as a guideline to tell when to get out of a trade.
