[uPaSKaL] Adaptive Swing StructureOverview :
Adaptive Swing Structure identifies and labels swing structure using HH / HL / LH / LL and can optionally draw wave connectors between successive swing points.
The goal is to provide a clean, practical view of market structure that remains readable across different market conditions.
Instead of relying only on a classic fixed-window pivot scan (left/right bars), this indicator uses an adaptive swing-detection approach designed to better match how traders visually interpret legs and structure.
Why this approach (vs. a simple pivot scan)?
Classic pivot scans (e.g., “pivot high/low with left/right bars”) are simple and widely used, but they often have practical limitations:
They depend heavily on a fixed window size (too sensitive in chop, too slow in trends)
They can mark pivots that are locally valid but not always representative of the broader leg
They may produce frequent structure changes during ranges, reducing readability
What you get with this indicator
A more stable swing structure view that adapts to price movement
Cleaner HH / HL / LH / LL labeling for context and decision-making
Optional wave connectors to visually follow the swing path
Visual comparison:
The screenshots below illustrate the difference in how structure can appear when using a classic pivot scan versus Adaptive Swing Structure.
Classic Pivot Points (High / Low):
Adaptive Swing Structure (This Indicator):
How to read the labels
This indicator labels swing structure using the standard notation:
HH = Higher High
HL = Higher Low
LH = Lower High
LL = Lower Low
How to interpret Wave Lines
When enabled, wave lines connect successive swing points to help you visually track the current swing path and structural transitions.
Inputs guide
Tracer Line Len
Main sensitivity control. Adjust this to fit the instrument and timeframe.
Higher values → fewer swing points, smoother structure (macro view)
Lower values → more swing points, more detail (micro view)
Show Wick (High / Low) Line
Shows the wick-based tracer (visual reference).
More sensitive to extremes and wick behavior
Useful when wicks matter (liquidity spikes / stop-runs)
Show Body (Open / Close) Line
Shows the body-based tracer (visual reference).
Filters wick noise and often looks smoother
Useful when you prefer structure based on candle bodies
Show Slope Flip Labels
Shows small markers that highlight swing turning moments (study/verification).
Helpful for understanding where structure updates
Optional and can be disabled for a cleaner chart
Wave Labels (WICK)
Shows HH/HL/LH/LL labels using wick-based swings.
More responsive to wick extremes
Wave Lines (WICK)
Connects wick-based swing points with wave lines.
Improves visual continuity of swings
Wave Labels (BODY)
Shows HH/HL/LH/LL labels using body-based swings.
Typically smoother and less sensitive to wick spikes
Wave Lines (BODY)
Connects body-based swing points with wave lines.
Cleaner wave path for body-based structure
Max Wave Labels Kept (per Wick / Body)
Limits the number of labels kept on the chart (older ones are removed first).
Reduces clutter
Helps maintain performance
Max Wave Lines Kept (per Wick / Body)
Limits the number of wave lines kept on the chart (older ones are removed first).
Keeps the chart readable
Helps maintain performance
History Window (map size / scan clamp)
Performance / stability control for how much recent history is considered.
Higher values → more history considered, higher CPU usage
Lower values → lighter execution, structure limited to more recent swings
Usage / Tuning
1) Find “your number” for each market
There is no universal best setting. The optimal Tracer Line Len depends on:
Instrument volatility
Your trading timeframe
Whether you want micro structure or macro structure
2) Build a simple baseline
Choose your chart timeframe (e.g., 4H).
Start with a moderate Len (e.g., 10–30).
Increase or decrease Len until the swing structure matches how you would manually map it.
3) Practical “timeframe scaling” intuition
You can use Len to “zoom out” or “zoom in” structure without changing your chart timeframe.
Example on 4H :
If Len = 20 produces the swing structure you want for 4H decisions, keep it as your baseline.
If you increase it to something like Len = 120 , the structure becomes much smoother and swing points appear less frequently.
This means:
4H with a smaller Len → focuses on 4H-level swings (more detail).
4H with a much larger Len → filters many local swings and highlights broader legs (more “higher-timeframe-like” context).
This is not a strict mathematical replacement for switching timeframes, but it is a practical and effective way to compress or expand structure density on the same chart.
4) Wick vs Body (which one to choose?)
WICK : Choose when extreme wicks matter to your reading of structure.
BODY : Choose when you want smoother structure and less sensitivity to wick spikes.
5) Suggested workflow for active traders
Use one preset for local structure (entries / short-term decisions).
Use a second preset with a larger Len for higher-level context (major swings / directional bias).
Hhll

Simple Zigzag UDT█ OVERVIEW
This indicator displays zigzag based on high and low, which is using user-defined types (UDT) or objects .
█ CREDITS
LonesomeTheBlue
█ FEATURES
1. Label can be resized.
2. Label can be display either short (Eg : HH, LL, H, L, etc) and long (Eg : Higher Low, etc)
3. Color can be customized either contrast color of chart background, trend color or customized color.
█ EXAMPLES / USAGES

Shotoki Force IndexHi,
I publish my private indicator.
The colored line is called SFI
When it turns blue, it's bullish (enter with a dot)
When it turns purple, it's bearish (enter with dot)
The SFI is "followed" by he bollinger bands.
I use the RV²I as factor
Do not use it allow to trade
I added a RSI option to see when to exit early
Shotoki
Thank's Muxxy for the idea (BB bands)

Counting HH/LL w FractalsWork in progress. Will indicate when a certain number of highest/lowest fractals have occurred from a starting point.
E.g. if lowest in 50, start counting highest fractals until N number is reached.
You can see my current status/attempts in the code comments. I am publishing to invite others to help via TV chat and StackOverflow. I will update the script when a solution is achieved.
Thanks!

Fractals with HH/LLStandard fractals indicator with an additional signal to show if it was higher than the last "up" or lower than the last "down"
A blue dot indicates the higher/lower fractal.
Working on an update to add a counting feature which will indicate when a certain number of higher highs from a given starting point has been achived.

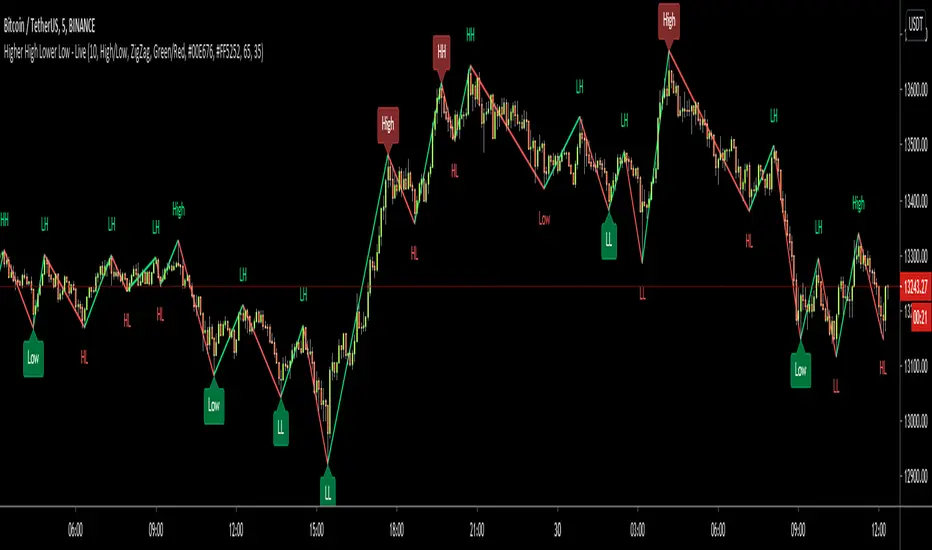
Higher High Lower Low - LiveHello All!
This is Higher High Lower Low - Live script. HHLL Live means Labels are calculated and placed dynamically. if you don't know what the Higher High - Lower Low is then you should search it on the net ;)
This is not Buy/Sell indicator but you can use it to analyse the trend or you can use it with other indicators to get signals and confirmation. You have option to use High/Low or Open/Close prices.
The script checks some indicators to see if it's in OB/OS levels and if they are in OB/OS levels then label colors are changed optionally. default OB level = 65, OS level = 35. you can set them as you wish.
I felt I need to protect the source code of the script, so this time it's not open-source.
Before you asked I should answer; it's non-repainting, live and dynamic script, you can use this with all time frames and any pair, indices, stocks etc ;)
You have option to get support/resistance levels and option to change bar color according to the trend that is calculated using broken S/R levels.
You can use different colors:
You can use Close/Open prices as source:
You have option to see only HH LL labels:
Enjoy and Good luck!
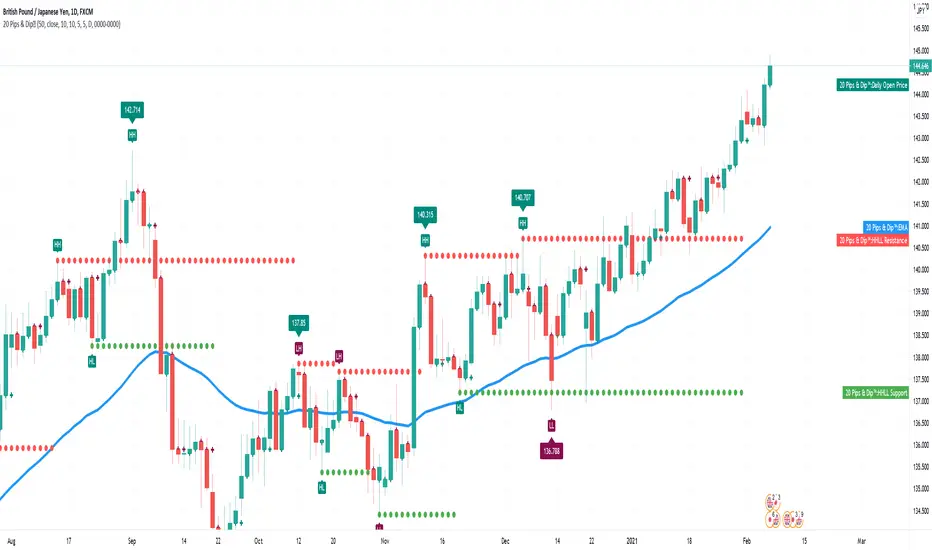
20 Pips & Dip™ Indicator20 Pips & Dipp script based on a few different indicators which together provides powerful help for all level of traders, especially beginners. Also, script have toggles to switch on/off: Renko Reversal, EMA, HHLL, Support/Resistance, Daily Open modules.
1st Module – Renko Reversal Alerts Indicator. The Indicator point out a spot where the revers are happens. Any changes in Price that do not reach a minimum amount are usually filtered. This helps to keep attention on larger, significant moves, and helps not to avoid the minute fluctuations in the market.
How it’s works?
- ENTER a trade JUST AFTER 1 Renko brick is printed. BUY triangle (green buy text with green triangle) is generated if a bearish Renko Brick is followed by a bullish brick. In other words, a buy signal happens when a white block is drawn after a black one. The buy happens then at the closing price that may be higher than the top of the last brick. It can go two bricks up minus a tick or pip.
- EXIT that trade, and open a new reverse position, just after 1 Renko brick is printed in the opposite direction. SELL triangle (red sell text with red triangle) is generated if a bullish brick is followed by a bearish brick. In other words, a sell signal happens when a black block is drawn, after a white block. The same situation as with a buy signal happens on sell signals. There is an uncertainty on the close price that may go as far as one tick above the next potential bearish block.
How to create custom ALERTS? Right click on a sell or buy triangle > Add Alert > 20 Pips & Dipp > Choose between Long or Short opportunity. In options field choose ONCE PER BAR. All other options you can choose according to your personal needs. If you want alert for another option (i.e. Short opportunity) just add one more.
Just to know! To understand how those module work better to switch to Renko chart. But Renko Chart with Renko brick size & Timeframe less than 1 day available only for PRO+ accounts and better. Also, we need to say that TradingView platform do not provide TICK data as we know. So, it may confuse you. Be careful!
2nd Module – Moving Average Exponential. The exponential moving average (EMA) is a weighted moving average (WMA) that gives more weighting, or importance, to recent price data than the simple moving average (SMA) does. The EMA responds more quickly to recent price changes than the SMA. The formula for calculating the EMA just involves using a multiplier and starting with the SMA. Like all moving averages, this technical indicator is used to produce buy and sell signals based on crossovers and divergences from the historical average. By default, our EMA have 50 period. The 50 moving average is the standard swing-trading moving average and very popular. Most traders use it to ride trends because it’s the ideal compromise between too short and too long term. Some people call it medium-term.
How to use it? EMAs are commonly used in conjunction with other indicators to confirm significant market moves and to gauge their validity. For traders who trade intraday and fast-moving markets, the EMA is more applicable. Quite often, traders use EMAs to determine a trading bias. For example, if an EMA on a daily chart shows a strong upward trend, an intraday trader’s strategy may be to trade only from the long side on an intraday chart.
Limitations of EMA! An EMA relies wholly on historical data. Many people believe that markets are efficient - that is, that current market prices already reflect all available information. If markets are indeed efficient, using historical data should tell us nothing about the future direction of asset prices.
3rd Module - Pivot Points (High/Low). Also known as Bar Count Reversals, are used to anticipate potential price reversals. Pivot Point Highs are determined by the number of bars with lower highs on either side of a Pivot Point High. Pivot Point Lows are determined by the number of bars with higher lows on either side of a Pivot Point Low. Default period is 10.
How this indicator works? The longer the trend (the higher the period selected) before and after the Pivot Point, the more significant the Pivot Point. Pivot Points can be used to help determine where to draw trendlines in order to visualize price patterns.
Calculation! Pivot Point Highs are determined by the number of bars with lower highs on either side of a Pivot Point High. Pivot Point Lows are determined by the number of bars with higher lows on either side of a Pivot Point Low.
4th Module - Higher High Lower Low indicator. Higher high and higher lows and Lower lows and lower highs are trends in a chart. Stocks in general never go up or down in linear fashion, every rise is followed by correction and then again it may either go up or down, same is true for downtrend every fall is followed by a correction in the upward direction and then new downtrend or uptrend is followed. After every rise, the stock took breather corrected to some extent and then new uptrend began, when you see the correction every low is higher than the previous lows and every next peak is higher than it’s previous peak. This is higher highs and higher lows trend.
How it’s work? This script finds pivot highs and pivot lows then calculates Higher Highs, Higher Lows & Lower Lows, Lower Highs. And it calculates support/resistance by using HH-HL-LL-LH points. Generally, HH and HL shows up-trend, LL and LH shows down-trend. If price breaks resistance levels it means the trend is up or if price breaks support level it means the trend is down, so the script can change bar colour blue or black by default. if there is up-trend then bar colour is blue, or if down-trend then bar colour is black. Support and resistance levels change dynamically.
Trick! If you use smaller numbers for Left Hand/Right Hand sides then it will be more sensitive!
5th Module - Daily Open Price. The opening price is the price at which a security first trades upon the opening of an exchange on a trading day; for example, the New York Stock Exchange (NYSE) opens at precisely 9:30 a.m. Eastern time. The price of the first trade for any listed stock is its daily opening price. The opening price is an important marker for that day's trading activity, particularly for those interested in measuring short-term results such as day traders.
Important! If daily open price was higher than current price, crosses will be red. And if daily open price lower than current price crosses will be green. Colours change dynamically.
You need to know it! An opening price is not identical to the previous day's closing price. There are several day-trading strategies based on the opening price of a market or security. Research “Gap Fade and Fill” or “Fade”.
Author – Christian Kopachelli . Huge thanks and credits to peoples which ideas, formulas, calculations, code snippets and code parts were used: Robert Nance, CryptoJoncis , FritzHaber , vacalo69 , Molle de Jong, Baris Yakut, LonesomeTheBlue , ChrisMoody , Robert N. ~~~ THANK you all! You are awesome!
DISCLAIMER! RISK WARNING!
PAST PERFORMANCE IS NOT NECESSARILY INDICATIVE OF FUTURE RESULTS. TRADERS SHOULD NOT BASE THEIR DECISION ON INVESTING IN ANY TRADING PROGRAM SOLELY ON THE PAST PERFORMANCE PRESENTED, ADDITIONALLY, IN MAKING AN INVESTMENT DECISION, TRADERS MUST ALSO RELY ON THEIR OWN EXAMINATION OF THE PERSON // OR ENTITY MAKING THE TRADING DECISIONS.
BreakBreak
The idea of this indicator is to show the price trend, the pivot-based control points and possible Long and short trades.
The pivot points create levels of support and resistance, if the price breaks the resistance means that the price is bullish, if the price breaks the supports means that the price is bearish.
It shows the highs and lows based on pivot points, showing HH LH HL LL depending on the previous pivots.
A better confirmation for an uptrend is to expect higher high (HH) and then a Higher Low (HL), and for a downtrend expect Lower Low (LL) and then a Lower High (LH).
When the price breaks a previous high or low level, a signal will be triggered in that direction, it is also possible to filter these signals with a ribbon of moving averages, you can choose up to 14 different types of MA's.

Smart Indicator 28 - Swing Pivots (Higher Highs and Lower Lows)A simple way to find Higher Highs and Lower Lows (HH and LL) whit automatic Fibonacci Lines in the most common levels.
In this indicator the Higher Highs only happens when a high value are rising from each other in the last "Length of Real Pivots" highs and the next same number of highs are falling in every single bar.
The Lower Lows are inverted, LL only appears if a low is falling in every single bar in the last number of length and the lows price of the "n" bars next are rising.
You can use this Indicator in any kind of market.

Higher High Lower Low StrategyThis script finds pivot highs and pivot lows then calculates higher highs & lower lows. And also it calculates support/resistance by using HH-HL-LL-LH points.
Generally HH and HL shows up-trend, LL and LH shows down-trend.
If price breaks resistance levels it means the trend is up or if price breaks support level it means the trend is down, so the script changes bar color blue or black. if there is up-trend then bar color is blue, or if down-trend then bar color is black. also as you can see support and resistance levels change dynamically.
If you use smaller numbers for left/right bars then it will be more sensitive.
free to use but the code is hidden and not free of charge, if you want the code please send me message.
comments are welcome.

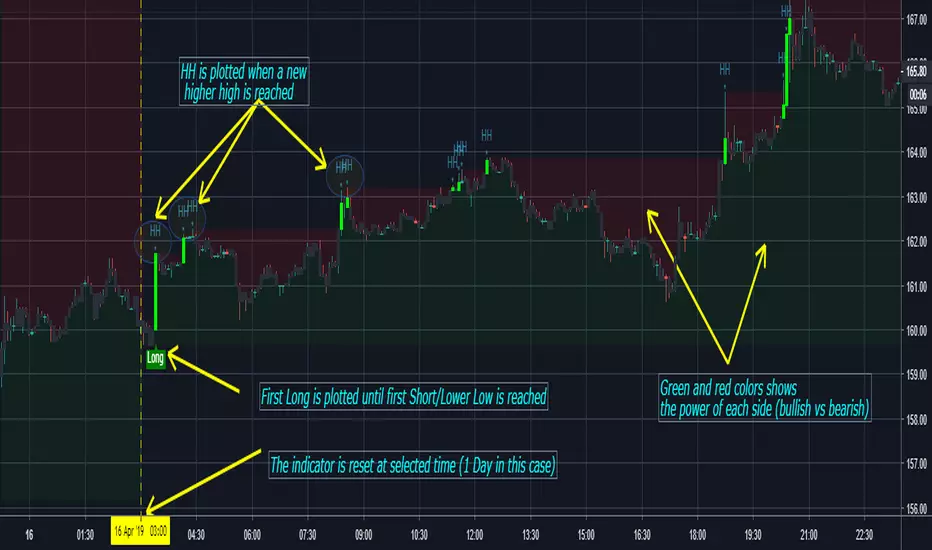
Higher Highs / Lower Lows - m,H,D,W,M w/ Alerts by ZekisA simple but very useful indicator that plots higher highs and lowers lows and that can be reset each hour, day, week or month, so it can plot new HH and new LL only in that range.
It can be used as it it, combined with other indicators or for TA (it's an entire story about highs and lows, google and youtube are your friends).
Alerts for HH/LL and for the first in the series plotted with Long and Short labels.
Use with caution!
Enjoy!
@Zekis
MoD Soleman Double RSI + HTF HLuses HTF trend and provides specific input on lower timeframe using a combo of RSI and HHLL criteria. tested on M5/H1 timeframes
red/green background highlights retracement zone before HTF trend should continue.
blue bar is entry point. Look for 1:1 RR before closing off 75% and riding the wave up/down :-)
Works best with trending markets but should be also work with sideways markets.
