BinaryInsertionSortLibrary "BinaryInsertionSort"
Library containing functions which can help create sorted array based on binary insertion sort.
This sorting will be quicker than array.sort function if the sorting needs to be done on every bar and the size of the array is comparatively big.
method binary_search_basic(sortedArray, item, order)
binary_search_basic - finds the closest index of the value
Namespace types: array
Parameters:
sortedArray (array) : array which is assumed to be sorted in the requested order
item (float) : float item which needs to be searched in the sorted array
order (int) : Sort order - positive number means ascending order whereas negative number represents descending order
Returns: int index at which the item can be inserted into sorted array
method binary_search_basic(sortedArray, item, order)
binary_search_basic - finds the closest index of the value
Namespace types: array
Parameters:
sortedArray (array) : array which is assumed to be sorted in the requested order
item (int) : int item which needs to be searched in the sorted array
order (int) : Sort order - positive number means ascending order whereas negative number represents descending order
Returns: int index at which the item can be inserted into sorted array
method binary_insertion_sort(sortedArray, item, order)
binary insertion sort - inserts item into sorted array while maintaining sort order
Namespace types: array
Parameters:
sortedArray (array) : array which is assumed to be sorted in the requested order
item (float) : float item which needs to be inserted into sorted array
order (int) : Sort order - positive number means ascending order whereas negative number represents descending order
Returns: int index at which the item is inserted into sorted array
method binary_insertion_sort(sortedArray, item, order)
binary insertion sort - inserts item into sorted array while maintaining sort order
Namespace types: array
Parameters:
sortedArray (array) : array which is assumed to be sorted in the requested order
item (int) : int item which needs to be inserted into sorted array
order (int) : Sort order - positive number means ascending order whereas negative number represents descending order
Returns: int index at which the item is inserted into sorted array
update_sort_indices(sortIndices, newItemIndex)
adds the sort index of new item added to sorted array and also updates existing sort indices.
Parameters:
sortIndices (array) : array containing sort indices of an array.
newItemIndex (int) : sort index of new item added to sorted array
Returns: void
get_array_of_series(item, order)
Converts series into array and sorted array.
Parameters:
item (float) : float series
order (int) : Sort order - positive number means ascending order whereas negative number represents descending order
Returns:
get_array_of_series(item, order)
Converts series into array and sorted array.
Parameters:
item (int) : int series
order (int) : Sort order - positive number means ascending order whereas negative number represents descending order
Returns:
get_sorted_arrays(item, order)
Converts series into array and sorted array. Also calculates the sort order of the value array
Parameters:
item (float) : float|int series
order (int) : Sort order - positive number means ascending order whereas negative number represents descending order
Returns:
get_sorted_arrays(item, order)
Converts series into array and sorted array. Also calculates the sort order of the value array
Parameters:
item (int) : int series
order (int) : Sort order - positive number means ascending order whereas negative number represents descending order
Returns:
Hewhomustnotbenamed
WavesLibrary "Waves"
Methods for elliot wave detection
method delete(this)
deletes the subwave drawing
Namespace types: Subwave
Parameters:
this (Subwave) : Subwave object to be deleted
Returns: deleted subwave object
method delete(this)
deletes the wave drawing and the corresponding subwaves
Namespace types: Wave
Parameters:
this (Wave) : Wave object to be deleted
Returns: deleted wave object
method createWave(pivot, lineColor, waves, limit)
Create wave object
Namespace types: zg.Pivot
Parameters:
pivot (Pivot type from Trendoscope/Zigzag/7) : pivot object where the wave needs to be created
lineColor (color) : color of the wave to be drawn
waves (array) : array of existing waves
limit (int) : max number of waves to be shown in the chart
Returns: wave object created
method createSubWaves(wave, subwavePivots)
Create sub waves for the wave
Namespace types: Wave
Parameters:
wave (Wave)
subwavePivots (array) : array of sub wave pivots
Returns: wave object created
method draw(subWave)
Draw subwave
Namespace types: Subwave
Parameters:
subWave (Subwave)
Returns: subwsubWave object
method draw(wave, limitSubwaves)
Draw Wave
Namespace types: Wave
Parameters:
wave (Wave) : Wave object to be drawn
limitSubwaves (bool) : limit the number of subwave combinations within the wave
Returns: wave object
method checkMotiveWave(prices)
based on the price array, check if there is motive wave and identify the type
Namespace types: array
Parameters:
prices (array) : float array of prices
Returns: WaveType representing the identified wave type. na otherwise
method scanMotiveWave(pivot, lastPivot, existingWaves, allowedTypes)
Scan for motive wave
Namespace types: zg.Pivot
Parameters:
pivot (Pivot type from Trendoscope/Zigzag/7) : Zigzag pivot that will be checked for motive wave
lastPivot (Pivot type from Trendoscope/Zigzag/7) : previous Zigzag pivot
existingWaves (array) : array of existing waves
allowedTypes (array) : allowed Wave types to filter them
Returns: array of subwave pivots
SubwavePivots
SubwavePivots represents the sub pivots of the main wave
Fields:
waveType (series WaveType) : Type of the Wave
indices (array) : Bar index values of sub waves
subPivots (array type from Trendoscope/Zigzag/7) : sub pivot objects of the wave
Subwave
Subwave represents the drawing of sub waves
Fields:
waves (array type from Trendoscope/Drawing/1) : array of sub wave lines
points (array type from Trendoscope/Drawing/1) : Array of subwave pivot labels
subwavePivots (SubwavePivots) : array of subwave pivots being drawn
Wave
Wave object type
Fields:
pivot (Pivot type from Trendoscope/Zigzag/7) : starting point of the wave
wave (Line type from Trendoscope/Drawing/1) : Line representing the wave
waveLabel (Label type from Trendoscope/Drawing/1) : label containing wave details
subWaves (array) : array of sub waves
DrawingLibrary "Drawing"
User Defined types and methods for basic drawing structure. Consolidated from the earlier libraries - DrawingTypes and DrawingMethods
method get_price(this, bar)
get line price based on bar
Namespace types: Line
Parameters:
this (Line) : (series Line) Line object.
bar (int) : (series/int) bar at which line price need to be calculated
Returns: line price at given bar.
method init(this)
Namespace types: PolyLine
Parameters:
this (PolyLine)
method tostring(this, sortKeys, sortOrder, includeKeys)
Converts DrawingTypes/Point object to string representation
Namespace types: chart.point
Parameters:
this (chart.point) : DrawingTypes/Point object
sortKeys (bool) : If set to true, string output is sorted by keys.
sortOrder (int) : Applicable only if sortKeys is set to true. Positive number will sort them in ascending order whreas negative numer will sort them in descending order. Passing 0 will not sort the keys
includeKeys (array) : Array of string containing selective keys. Optional parmaeter. If not provided, all the keys are considered
Returns: string representation of DrawingTypes/Point
method tostring(this, sortKeys, sortOrder, includeKeys)
Converts DrawingTypes/LineProperties object to string representation
Namespace types: LineProperties
Parameters:
this (LineProperties) : DrawingTypes/LineProperties object
sortKeys (bool) : If set to true, string output is sorted by keys.
sortOrder (int) : Applicable only if sortKeys is set to true. Positive number will sort them in ascending order whreas negative numer will sort them in descending order. Passing 0 will not sort the keys
includeKeys (array) : Array of string containing selective keys. Optional parmaeter. If not provided, all the keys are considered
Returns: string representation of DrawingTypes/LineProperties
method tostring(this, sortKeys, sortOrder, includeKeys)
Converts DrawingTypes/Line object to string representation
Namespace types: Line
Parameters:
this (Line) : DrawingTypes/Line object
sortKeys (bool) : If set to true, string output is sorted by keys.
sortOrder (int) : Applicable only if sortKeys is set to true. Positive number will sort them in ascending order whreas negative numer will sort them in descending order. Passing 0 will not sort the keys
includeKeys (array) : Array of string containing selective keys. Optional parmaeter. If not provided, all the keys are considered
Returns: string representation of DrawingTypes/Line
method tostring(this, sortKeys, sortOrder, includeKeys)
Converts DrawingTypes/LabelProperties object to string representation
Namespace types: LabelProperties
Parameters:
this (LabelProperties) : DrawingTypes/LabelProperties object
sortKeys (bool) : If set to true, string output is sorted by keys.
sortOrder (int) : Applicable only if sortKeys is set to true. Positive number will sort them in ascending order whreas negative numer will sort them in descending order. Passing 0 will not sort the keys
includeKeys (array) : Array of string containing selective keys. Optional parmaeter. If not provided, all the keys are considered
Returns: string representation of DrawingTypes/LabelProperties
method tostring(this, sortKeys, sortOrder, includeKeys)
Converts DrawingTypes/Label object to string representation
Namespace types: Label
Parameters:
this (Label) : DrawingTypes/Label object
sortKeys (bool) : If set to true, string output is sorted by keys.
sortOrder (int) : Applicable only if sortKeys is set to true. Positive number will sort them in ascending order whreas negative numer will sort them in descending order. Passing 0 will not sort the keys
includeKeys (array) : Array of string containing selective keys. Optional parmaeter. If not provided, all the keys are considered
Returns: string representation of DrawingTypes/Label
method tostring(this, sortKeys, sortOrder, includeKeys)
Converts DrawingTypes/Linefill object to string representation
Namespace types: Linefill
Parameters:
this (Linefill) : DrawingTypes/Linefill object
sortKeys (bool) : If set to true, string output is sorted by keys.
sortOrder (int) : Applicable only if sortKeys is set to true. Positive number will sort them in ascending order whreas negative numer will sort them in descending order. Passing 0 will not sort the keys
includeKeys (array) : Array of string containing selective keys. Optional parmaeter. If not provided, all the keys are considered
Returns: string representation of DrawingTypes/Linefill
method tostring(this, sortKeys, sortOrder, includeKeys)
Converts DrawingTypes/BoxProperties object to string representation
Namespace types: BoxProperties
Parameters:
this (BoxProperties) : DrawingTypes/BoxProperties object
sortKeys (bool) : If set to true, string output is sorted by keys.
sortOrder (int) : Applicable only if sortKeys is set to true. Positive number will sort them in ascending order whreas negative numer will sort them in descending order. Passing 0 will not sort the keys
includeKeys (array) : Array of string containing selective keys. Optional parmaeter. If not provided, all the keys are considered
Returns: string representation of DrawingTypes/BoxProperties
method tostring(this, sortKeys, sortOrder, includeKeys)
Converts DrawingTypes/BoxText object to string representation
Namespace types: BoxText
Parameters:
this (BoxText) : DrawingTypes/BoxText object
sortKeys (bool) : If set to true, string output is sorted by keys.
sortOrder (int) : Applicable only if sortKeys is set to true. Positive number will sort them in ascending order whreas negative numer will sort them in descending order. Passing 0 will not sort the keys
includeKeys (array) : Array of string containing selective keys. Optional parmaeter. If not provided, all the keys are considered
Returns: string representation of DrawingTypes/BoxText
method tostring(this, sortKeys, sortOrder, includeKeys)
Converts DrawingTypes/Box object to string representation
Namespace types: Box
Parameters:
this (Box) : DrawingTypes/Box object
sortKeys (bool) : If set to true, string output is sorted by keys.
sortOrder (int) : Applicable only if sortKeys is set to true. Positive number will sort them in ascending order whreas negative numer will sort them in descending order. Passing 0 will not sort the keys
includeKeys (array) : Array of string containing selective keys. Optional parmaeter. If not provided, all the keys are considered
Returns: string representation of DrawingTypes/Box
method delete(this)
Deletes line from DrawingTypes/Line object
Namespace types: Line
Parameters:
this (Line) : DrawingTypes/Line object
Returns: Line object deleted
method delete(this)
Deletes label from DrawingTypes/Label object
Namespace types: Label
Parameters:
this (Label) : DrawingTypes/Label object
Returns: Label object deleted
method delete(this)
Deletes Linefill from DrawingTypes/Linefill object
Namespace types: Linefill
Parameters:
this (Linefill) : DrawingTypes/Linefill object
Returns: Linefill object deleted
method delete(this)
Deletes box from DrawingTypes/Box object
Namespace types: Box
Parameters:
this (Box) : DrawingTypes/Box object
Returns: DrawingTypes/Box object deleted
method delete(this)
Deletes lines from array of DrawingTypes/Line objects
Namespace types: array
Parameters:
this (array) : Array of DrawingTypes/Line objects
Returns: Array of DrawingTypes/Line objects
method delete(this)
Deletes labels from array of DrawingTypes/Label objects
Namespace types: array
Parameters:
this (array) : Array of DrawingTypes/Label objects
Returns: Array of DrawingTypes/Label objects
method delete(this)
Deletes linefill from array of DrawingTypes/Linefill objects
Namespace types: array
Parameters:
this (array) : Array of DrawingTypes/Linefill objects
Returns: Array of DrawingTypes/Linefill objects
method delete(this)
Deletes boxes from array of DrawingTypes/Box objects
Namespace types: array
Parameters:
this (array) : Array of DrawingTypes/Box objects
Returns: Array of DrawingTypes/Box objects
method clear(this)
clear items from array of DrawingTypes/Line while deleting underlying objects
Namespace types: array
Parameters:
this (array) : array
Returns: void
method clear(this)
clear items from array of DrawingTypes/Label while deleting underlying objects
Namespace types: array
Parameters:
this (array) : array
Returns: void
method clear(this)
clear items from array of DrawingTypes/Linefill while deleting underlying objects
Namespace types: array
Parameters:
this (array) : array
Returns: void
method clear(this)
clear items from array of DrawingTypes/Box while deleting underlying objects
Namespace types: array
Parameters:
this (array) : array
Returns: void
method draw(this)
Creates line from DrawingTypes/Line object
Namespace types: Line
Parameters:
this (Line) : DrawingTypes/Line object
Returns: line created from DrawingTypes/Line object
method draw(this)
Creates lines from array of DrawingTypes/Line objects
Namespace types: array
Parameters:
this (array) : Array of DrawingTypes/Line objects
Returns: Array of DrawingTypes/Line objects
method draw(this)
Creates label from DrawingTypes/Label object
Namespace types: Label
Parameters:
this (Label) : DrawingTypes/Label object
Returns: label created from DrawingTypes/Label object
method draw(this)
Creates labels from array of DrawingTypes/Label objects
Namespace types: array
Parameters:
this (array) : Array of DrawingTypes/Label objects
Returns: Array of DrawingTypes/Label objects
method draw(this)
Creates linefill object from DrawingTypes/Linefill
Namespace types: Linefill
Parameters:
this (Linefill) : DrawingTypes/Linefill objects
Returns: linefill object created
method draw(this)
Creates linefill objects from array of DrawingTypes/Linefill objects
Namespace types: array
Parameters:
this (array) : Array of DrawingTypes/Linefill objects
Returns: Array of DrawingTypes/Linefill used for creating linefills
method draw(this)
Creates box from DrawingTypes/Box object
Namespace types: Box
Parameters:
this (Box) : DrawingTypes/Box object
Returns: box created from DrawingTypes/Box object
method draw(this)
Creates labels from array of DrawingTypes/Label objects
Namespace types: array
Parameters:
this (array) : Array of DrawingTypes/Label objects
Returns: Array of DrawingTypes/Label objects
method createLabel(this, lblText, tooltip, properties)
Creates DrawingTypes/Label object from DrawingTypes/Point
Namespace types: chart.point
Parameters:
this (chart.point) : DrawingTypes/Point object
lblText (string) : Label text
tooltip (string) : Tooltip text. Default is na
properties (LabelProperties) : DrawingTypes/LabelProperties object. Default is na - meaning default values are used.
Returns: DrawingTypes/Label object
method createLine(this, other, properties)
Creates DrawingTypes/Line object from one DrawingTypes/Point to other
Namespace types: chart.point
Parameters:
this (chart.point) : First DrawingTypes/Point object
other (chart.point) : Second DrawingTypes/Point object
properties (LineProperties) : DrawingTypes/LineProperties object. Default set to na - meaning default values are used.
Returns: DrawingTypes/Line object
method createLinefill(this, other, fillColor, transparency)
Creates DrawingTypes/Linefill object from DrawingTypes/Line object to other DrawingTypes/Line object
Namespace types: Line
Parameters:
this (Line) : First DrawingTypes/Line object
other (Line) : Other DrawingTypes/Line object
fillColor (color) : fill color of linefill. Default is color.blue
transparency (int) : fill transparency for linefill. Default is 80
Returns: Array of DrawingTypes/Linefill object
method createBox(this, other, properties, textProperties)
Creates DrawingTypes/Box object from one DrawingTypes/Point to other
Namespace types: chart.point
Parameters:
this (chart.point) : First DrawingTypes/Point object
other (chart.point) : Second DrawingTypes/Point object
properties (BoxProperties) : DrawingTypes/BoxProperties object. Default set to na - meaning default values are used.
textProperties (BoxText) : DrawingTypes/BoxText object. Default is na - meaning no text will be drawn
Returns: DrawingTypes/Box object
method createBox(this, properties, textProperties)
Creates DrawingTypes/Box object from DrawingTypes/Line as diagonal line
Namespace types: Line
Parameters:
this (Line) : Diagonal DrawingTypes/PoLineint object
properties (BoxProperties) : DrawingTypes/BoxProperties object. Default set to na - meaning default values are used.
textProperties (BoxText) : DrawingTypes/BoxText object. Default is na - meaning no text will be drawn
Returns: DrawingTypes/Box object
LineProperties
Properties of line object
Fields:
xloc (series string) : X Reference - can be either xloc.bar_index or xloc.bar_time. Default is xloc.bar_index
extend (series string) : Property which sets line to extend towards either right or left or both. Valid values are extend.right, extend.left, extend.both, extend.none. Default is extend.none
color (series color) : Line color
style (series string) : Line style, valid values are line.style_solid, line.style_dashed, line.style_dotted, line.style_arrow_left, line.style_arrow_right, line.style_arrow_both. Default is line.style_solid
width (series int) : Line width. Default is 1
Line
Line object created from points
Fields:
start (chart.point) : Starting point of the line
end (chart.point) : Ending point of the line
properties (LineProperties) : LineProperties object which defines the style of line
object (series line) : Derived line object
LabelProperties
Properties of label object
Fields:
xloc (series string) : X Reference - can be either xloc.bar_index or xloc.bar_time. Default is xloc.bar_index
yloc (series string) : Y reference - can be yloc.price, yloc.abovebar, yloc.belowbar. Default is yloc.price
color (series color) : Label fill color
style (series string) : Label style as defined in Tradingview Documentation. Default is label.style_none
textcolor (series color) : text color. Default is color.black
size (series string) : Label text size. Default is size.normal. Other values are size.auto, size.tiny, size.small, size.normal, size.large, size.huge
textalign (series string) : Label text alignment. Default if text.align_center. Other allowed values - text.align_right, text.align_left, text.align_top, text.align_bottom
text_font_family (series string) : The font family of the text. Default value is font.family_default. Other available option is font.family_monospace
Label
Label object
Fields:
point (chart.point) : Point where label is drawn
lblText (series string) : label text
tooltip (series string) : Tooltip text. Default is na
properties (LabelProperties) : LabelProperties object
object (series label) : Pine label object
Linefill
Linefill object
Fields:
line1 (Line) : First line to create linefill
line2 (Line) : Second line to create linefill
fillColor (series color) : Fill color
transparency (series int) : Fill transparency range from 0 to 100
object (series linefill) : linefill object created from wrapper
BoxProperties
BoxProperties object
Fields:
border_color (series color) : Box border color. Default is color.blue
bgcolor (series color) : box background color
border_width (series int) : Box border width. Default is 1
border_style (series string) : Box border style. Default is line.style_solid
extend (series string) : Extend property of box. default is extend.none
xloc (series string) : defines if drawing needs to be done based on bar index or time. default is xloc.bar_index
BoxText
Box Text properties.
Fields:
boxText (series string) : Text to be printed on the box
text_size (series string) : Text size. Default is size.auto
text_color (series color) : Box text color. Default is color.yellow.
text_halign (series string) : horizontal align style - default is text.align_center
text_valign (series string) : vertical align style - default is text.align_center
text_wrap (series string) : text wrap style - default is text.wrap_auto
text_font_family (series string) : Text font. Default is
Box
Box object
Fields:
p1 (chart.point) : Diagonal point one
p2 (chart.point) : Diagonal point two
properties (BoxProperties) : Box properties
textProperties (BoxText) : Box text properties
object (series box) : Box object created
PolyLineProperties
Fields:
curved (series bool)
closed (series bool)
xloc (series string)
lineColor (series color)
fillColor (series color)
lineStyle (series string)
lineWidth (series int)
PolyLine
Fields:
points (array)
properties (PolyLineProperties)
object (series polyline)
ABCD Projection [Trendoscope®]Over the years, we have extensively explored and published numerous scripts centered around various chart patterns, including Harmonic Patterns, Reversal Patterns, Elliott Waves, and more. Our expertise in these areas has led to frequent requests for an indicator based on the ABCD pattern. Although we didn't include it as part of our Harmonic Patterns collection, the development of a dedicated ABCD Projection Indicator has always been a priority for us.
🎲 Overview of the ABCD Projection Indicator
The ABCD Projection Indicator is designed to identify and project ABCD patterns using a Zigzag-based approach. This pattern, characterized by alternating pivot highs and lows labeled as A, B, C, and D, is particularly significant in trending markets where it signifies trend continuation following deep pullbacks.
The indicator works by confirming the ABC pivots and projecting the D pivot based on the established price swings. Since ABCD patterns are most effective in trending environments, the indicator focuses on filtering patterns where the retracement from the C pivot has not compromised the trade's potential. Specifically, it ensures that the starting point (S)—where the pattern is detected—has not retraced beyond a defined threshold, preserving the opportunity to execute a trade with the goal of reaching the projected D pivot.
Additionally, the ABCD Projection Indicator considers the retracement ratio from the C pivot, which plays a crucial role in risk management. A higher retracement ratio reduces the stop distance (from pivot A to the entry point S) while increasing the distance to the target (pivot D), thereby enhancing the reward/risk ratio for trades.
🎲 Components of the ABCD Projection Indicator
The ABCD Projection Indicator comprises several key components:
A, B, C Pivots and Zigzag Wave : These elements form the foundational structure of the ABCD pattern.
S Point : This is the location where the pattern is identified, positioned a few bars away from the confirmed C pivot.
Estimated D Pivot : The D pivot is projected based on the A, B, and C price levels. The time or distance to the D pivot is influenced by the starting point S.
Mini Stats Table : Located in the top right corner, this table displays win/loss ratios and risk/reward data for both bullish and bearish scenarios.
Fibonacci Levels : Calculated from the C to D pivots, these levels are provided as a reference for additional analysis.
🎲 Indicator Settings
The settings for the ABCD Projection Indicator are minimal and intuitive, with tooltips provided to guide users through the configuration process.

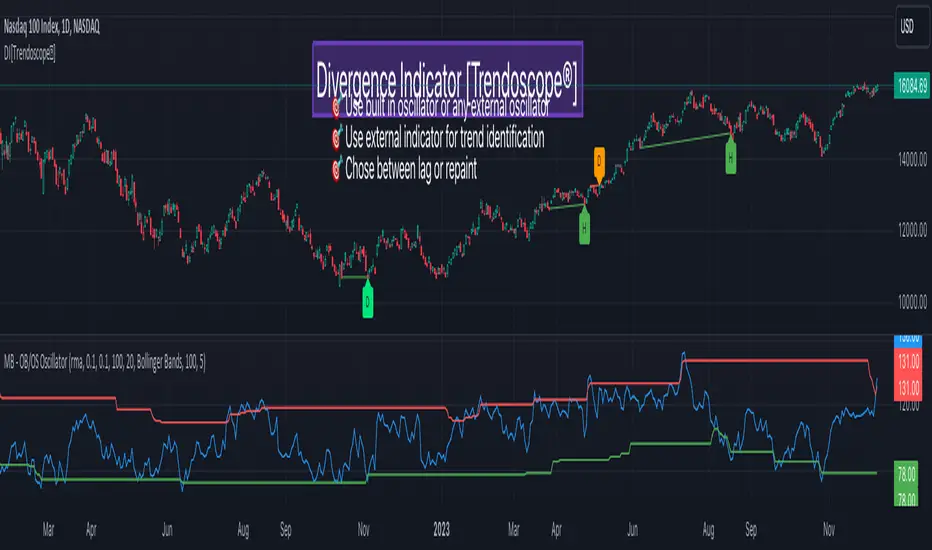
Oscillator Scatterplot Analysis [Trendoscope®]In this indicator, we demonstrate how to plot oscillator behavior of oversold-overbought against price movements in the form of scatterplots and perform analysis. Scatterplots are drawn on a graph containing x and y-axis, where x represent one measure whereas y represents another. We use the library Graph to collect the data and plot it as scatterplot.
Pictorial explanation of components is defined in the chart below.
🎲 This indicator performs following tasks
Calculate and plot oscillator
Identify oversold and overbought areas based on various methods
Measure the price and bar movement from overbought to oversold and vice versa and plot them on the chart.
In our example,
The x-axis represents price movement. The plots found on the right side of the graph has positive price movements, whereas the plots found on the left side of the graph has negative price movements.
The y-axis represents the number of bars it took for reaching overbought to oversold and/or oversold to overbought. Positive bars mean we are measuring oversold to overbought, whereas negative bars are a measure of overbought to oversold.
🎲 Graph is divided into 4 equal quadrants
Quadrant 1 is the top right portion of the graph. Plots in this quadrant represent the instances where positive price movement is observed when the oscillator moved from oversold to overbought
Quadrant 2 is the top left portion of the graph. Plots in this quadrant represent the instances where negative price movement is observed when the oscillator moved from oversold to overbought.
Quadrant 3 is the bottom left portion of the chart. Plots in this quadrant represent the instances where negative price movement is observed when the oscillator moved from overbought to oversold.
Quadrant 4 is the bottom right portion of the chart. Plots in this quadrant represent the instances where positive price movement is observed when the oscillator moved from overbought to oversold.
🎲 Indicator components in Detail
Let's dive deep into the indicator.
🎯 Oscillator Selection
Select the Oscillator and define the overbought oversold conditions through input settings
Indicator - Oscillator base used for performing analysis
Length - Loopback length on which the oscillator is calculated
OB/OS Method - We use Bollinger Bands, Keltener Channel and Donchian channel to calculate dynamic overbought and oversold levels instead of static 80-10. This is also useful as other type of indicators may not be within 0-100 range.
Length and Multiplier are used for the bands for calculating Overbought/Oversold boundaries.
🎯 Define Graph Properties
Select different graph properties from the input settings that will instruct how to display the scatterplot.
Type - this can be either scatterplot or heatmap. Scatterplot will display plots with specific transparency to indicate the data, whereas heatmap will display background with different transparencies.
Plot Color - this is the color in which the scatterplot or heatmap is drawn
Plot Size - applicable mainly for scatterplot. Since the character we use for scatterplot is very tiny, the large at present looks optimal. But, based on the user's screen size, we may need to select different sizes so that it will render properly.
Rows and Columns - Number of rows and columns allocated per quadrant. This means, the total size of the chart is 2X rows and 2X columns. Data sets are divided into buckets based on the number of available rows and columns. Hence, changing this can change the appearance of the overall chart, even though they are representing the same data. Also, please note that tables can have max 10000 cells. If we increase the rows and columns by too much, we may get runtime errors.
Outliers - this is used to exclude the extreme data. 20% outlier means, the chart will ignore bottom 20% and top 20% when defining the chart boundaries. However, the extreme data is still added to the boundaries.

GraphLibrary "Graph"
Library to collect data and draw scatterplot and heatmap as graph
method init(this)
Initialise Quadrant Data
Namespace types: Quadrant
Parameters:
this (Quadrant) : Quadrant object that needs to be initialised
Returns: current Quadrant object
method init(this)
Initialise Graph Data
Namespace types: Graph
Parameters:
this (Graph) : Graph object that needs to be initialised with 4 Quadrants
Returns: current Graph object
method add(this, data)
Add coordinates to graph
Namespace types: Graph
Parameters:
this (Graph) : Graph object
data (Coordinate) : Coordinates containing x, y data
Returns: current Graph object
method calculate(this)
Calculation required for plotting the graph
Namespace types: Graph
Parameters:
this (Graph) : Graph object
Returns: current Graph object
method paint(this)
Draw graph
Namespace types: Graph
Parameters:
this (Graph) : Graph object
Returns: current Graph object
Coordinate
Coordinates of sample data
Fields:
xValue (series float) : x value of the sample data
yValue (series float) : y value of the sample data
Quadrant
Data belonging to particular quadrant
Fields:
coordinates (array) : Coordinates present in given quadrant
GraphProperties
Properties of Graph that needs to be drawn
Fields:
rows (series int) : Number of rows (y values) in each quadrant
columns (series int) : number of columns (x values) in each quadrant
graphtype (series GraphType) : Type of graph - scatterplot or heatmap
plotColor (series color) : color of plots or heatmap
plotSize (series string) : size of cells in the table
plotchar (series string) : Character to be printed for display of scatterplot
outliers (series int) : Excude the outlier percent of data from calculating the min and max
position (series string) : Table position
bgColor (series color) : graph background color
PlotRange
Range of a plot in terms of x and y values and the number of data points that fall within the Range
Fields:
minX (series float) : min range of X value
maxX (series float) : max range of X value
minY (series float) : min range of Y value
maxY (series float) : max range of Y value
count (series int) : number of samples in the range
Graph
Graph data and properties
Fields:
properties (GraphProperties) : Graph Properties object associated
quadrants (array) : Array containing 4 quadrant data
plotRanges (matrix) : range and count for each cell
xArray (array) : array of x values
yArray (array) : arrray of y values

InsertionSortLibrary "InsertionSort"
Library of sorting algorithm for binary insertion sort and related methods
method binary_insertion_sort(sortedArray, item, order)
binary insertion sort - inserts item into sorted array while maintaining sort order
Namespace types: array
Parameters:
sortedArray (array) : array which is assumed to be sorted in the requested order
item (float) : float|int item which needs to be inserted into sorted array
order (series ORDER) : Sort order - positive number means ascending order whereas negative number represents descending order
Returns: int index at which the item is inserted into sorted array
method binary_insertion_sort(sortedArray, item, order)
Namespace types: array
Parameters:
sortedArray (array)
item (int)
order (series ORDER)

divergingchartpatternLibrary "divergingchartpattern"
Library having implementation of converging chart patterns
getPatternNameByType(patternType)
Returns pattern name based on type
Parameters:
patternType (int) : integer value representing pattern type
Returns: string name of the pattern
method find(this, sProperties, dProperties, patterns, ohlcArray)
find converging patterns for given zigzag
Namespace types: zg.Zigzag
Parameters:
this (Zigzag type from Trendoscope/ZigzagLite/2) : Current zigzag Object
sProperties (ScanProperties) : ScanProperties Object
dProperties (DrawingProperties type from Trendoscope/abstractchartpatterns/5) : DrawingProperties Object
patterns (array type from Trendoscope/abstractchartpatterns/5) : array of existing patterns to check for duplicates
ohlcArray (array type from Trendoscope/ohlc/1) : array of OHLC values for historical reference
Returns: string name of the pattern
ScanProperties
Object containing properties for pattern scanning
Fields:
baseProperties (ScanProperties type from Trendoscope/abstractchartpatterns/5) : Object of Base Scan Properties
convergingDistanceMultiplier (series float)
convergingpatternsLibrary "convergingpatterns"
Library having implementation of converging chart patterns
getPatternNameByType(patternType)
Returns pattern name based on type
Parameters:
patternType (int) : integer value representing pattern type
Returns: string name of the pattern
method find(this, sProperties, dProperties, patterns, ohlcArray)
find converging patterns for given zigzag
Namespace types: zg.Zigzag
Parameters:
this (Zigzag type from Trendoscope/ZigzagLite/2) : Current zigzag Object
sProperties (ScanProperties) : ScanProperties Object
dProperties (DrawingProperties type from Trendoscope/abstractchartpatterns/5) : DrawingProperties Object
patterns (array type from Trendoscope/abstractchartpatterns/5) : array of existing patterns to check for duplicates
ohlcArray (array type from Trendoscope/ohlc/1) : array of OHLC values for historical reference
Returns: string name of the pattern
ScanProperties
Object containing properties for pattern scanning
Fields:
baseProperties (ScanProperties type from Trendoscope/abstractchartpatterns/5) : Object of Base Scan Properties
convergingDistanceMultiplier (series float) : when multiplied with pattern size gets the max number of bars within which the pattern should converge
simpletradeLibrary "simpletrade"
Library with Simple Trade types and tracking mechanism
method evaluate(this)
Evaluate current trade and update status
Namespace types: SimpleTrade
Parameters:
this (SimpleTrade) : SimpleTrade object that need to be evaluated
Returns: current SimpleTrade object
method erase(this)
Erase SimpleTrade drawings
Namespace types: SimpleTrade
Parameters:
this (SimpleTrade) : SimpleTrade object that needs to be erased
Returns: void
method draw(this, offset, gap)
Draw SimpleTrade drawings
Namespace types: SimpleTrade
Parameters:
this (SimpleTrade) : SimpleTrade object that needs to be drawn
offset (int) : offset distance at which the drawing needs to be drawn.
gap (int) : gap between start and end of the Simple trade drawings
Returns: updated offset
TradeDrawing
Object containing Trade drawings
Fields:
entryToStop (series box) : box showing entry to stop range
entryToTarget (series box) : box showing entry to target range
maxGain (series box) : box highlighting max gain of the Trade
maxLoss (series box) : box highlighting max lowss of the Trade
invalidationLine (series line) : line displaying trade invalidation price
invalidationLabel (series label) : label displaying trade invalidation price
stopLabel (series label) : label displaying trade stop price
entryLabel (series label) : label displaying trade entry price
targetLabel (series label) : label displaying trade target price
patternLabel (series label) : label displaying trade pattern details
SimpleTrade
Object containing Simple trade details for tracking
Fields:
id (series int) : Unique trade id
pid (series int) : parent id for trade. Multiple trades can have single parent id
dir (series int) : trade direction
tradeName (series string) : Trade name or description
tradeColor (series color) : color in which the trade needs to be drawn
entry (series float) : trade entry price
stop (series float) : trade stop price
invalidation (series float) : trade invalidation price
target (series float) : trade target price
maxGainPrice (series float) : price at which the trade attained max gain
maxLossPrice (series float) : price at which the trade attained max loss
drawing (TradeDrawing) : TradeDrawing object contianing drawing items
status (series int) : current status of the trade
maxStatus (series int) : max status attained by the trade

basechartpatternsLibrary "basechartpatterns"
Library having complete chart pattern implementation
getPatternNameById(id)
Returns pattern name by id
Parameters:
id (int) : pattern id
Returns: Pattern name
method find(points, properties, dProperties, ohlcArray)
Find patterns based on array of points
Namespace types: chart.point
Parameters:
points (chart.point ) : array of chart.point objects
properties (ScanProperties type from Trendoscope/abstractchartpatterns/1) : ScanProperties object
dProperties (DrawingProperties type from Trendoscope/abstractchartpatterns/1) : DrawingProperties object
ohlcArray (OHLC type from Trendoscope/ohlc/1)
Returns: Flag indicating if the pattern is valid, Current Pattern object
method find(this, properties, dProperties, patterns, ohlcArray)
Find patterns based on the currect zigzag object but will not store them in the pattern array.
Namespace types: zg.Zigzag
Parameters:
this (Zigzag type from Trendoscope/ZigzagLite/2) : Zigzag object containing pivots
properties (ScanProperties type from Trendoscope/abstractchartpatterns/1) : ScanProperties object
dProperties (DrawingProperties type from Trendoscope/abstractchartpatterns/1) : DrawingProperties object
patterns (Pattern type from Trendoscope/abstractchartpatterns/1) : Array of Pattern objects
ohlcArray (OHLC type from Trendoscope/ohlc/1)
Returns: Flag indicating if the pattern is valid, Current Pattern object
abstractchartpatternsLibrary "abstractchartpatterns"
Library having abstract types and methods for chart pattern implementations
checkBarRatio(p1, p2, p3, properties)
checks if three zigzag pivot points are having uniform bar ratios
Parameters:
p1 (chart.point) : First pivot point
p2 (chart.point) : Second pivot point
p3 (chart.point) : Third pivot point
properties (ScanProperties)
Returns: true if points are having uniform bar ratio
getRatioDiff(p1, p2, p3)
gets ratio difference between 3 pivot combinations
Parameters:
p1 (chart.point)
p2 (chart.point)
p3 (chart.point)
Returns: returns the ratio difference between pivot2/pivot1 ratio and pivot3/pivot2 ratio
method inspect(points, stratingBar, endingBar, direction, ohlcArray)
Creates a trend line between 2 or 3 points and validates and selects best combination
Namespace types: chart.point
Parameters:
points (chart.point ) : Array of chart.point objects used for drawing trend line
stratingBar (int) : starting bar of the trend line
endingBar (int) : ending bar of the trend line
direction (float) : direction of the last pivot. Tells whether the line is joining upper pivots or the lower pivots
ohlcArray (OHLC type from Trendoscope/ohlc/1) : Array of OHLC values
Returns: boolean flag indicating if the trend line is valid and the trend line object as tuple
method draw(this)
draws pattern on the chart
Namespace types: Pattern
Parameters:
this (Pattern) : Pattern object that needs to be drawn
Returns: Current Pattern object
method erase(this)
erase the given pattern on the chart
Namespace types: Pattern
Parameters:
this (Pattern) : Pattern object that needs to be erased
Returns: Current Pattern object
method push(this, p, maxItems)
push Pattern object to the array by keeping maxItems limit
Namespace types: Pattern
Parameters:
this (Pattern ) : array of Pattern objects
p (Pattern) : Pattern object to be added to array
@oaram maxItems Max number of items the array can hold
maxItems (int)
Returns: Current Pattern array
method deepcopy(this)
Perform deep copy of a chart point array
Namespace types: chart.point
Parameters:
this (chart.point ) : array of chart.point objects
Returns: deep copy array
DrawingProperties
Object containing properties for pattern drawing
Fields:
patternLineWidth (series int) : Line width of the pattern trend lines
showZigzag (series bool) : show zigzag associated with pattern
zigzagLineWidth (series int) : line width of the zigzag lines. Used only when showZigzag is set to true
zigzagLineColor (series color) : color of the zigzag lines. Used only when showZigzag is set to true
showPatternLabel (series bool) : display pattern label containing the name
patternLabelSize (series string) : size of the pattern label. Used only when showPatternLabel is set to true
showPivotLabels (series bool) : Display pivot labels of the patterns marking 1-6
pivotLabelSize (series string) : size of the pivot label. Used only when showPivotLabels is set to true
pivotLabelColor (series color) : color of the pivot label outline. chart.bg_color or chart.fg_color are the appropriate values.
deleteOnPop (series bool) : delete the pattern when popping out from the array of Patterns.
Pattern
Object containing Individual Pattern data
Fields:
points (chart.point )
originalPoints (chart.point )
trendLine1 (Line type from Trendoscope/LineWrapper/1) : First trend line joining pivots 1, 3, 5
trendLine2 (Line type from Trendoscope/LineWrapper/1) : Second trend line joining pivots 2, 4 (, 6)
properties (DrawingProperties) : DrawingProperties Object carrying common properties
patternColor (series color) : Individual pattern color. Lines and labels will be using this color.
ratioDiff (series float) : Difference between trendLine1 and trendLine2 ratios
zigzagLine (series polyline) : Internal zigzag line drawing Object
pivotLabels (label ) : array containning Pivot labels
patternLabel (series label) : pattern label Object
patternType (series int) : integer representing the pattern type
patternName (series string) : Type of pattern in string
ScanProperties
Object containing properties for pattern scanning
Fields:
offset (series int) : Zigzag pivot offset. Set it to 1 for non repainting scan.
numberOfPivots (series int) : Number of pivots to be used in pattern search. Can be either 5 or 6
errorRatio (series float) : Error Threshold to be considered for comparing the slope of lines
flatRatio (series float) : Retracement ratio threshold used to determine if the lines are flat
checkBarRatio (series bool) : Also check bar ratio are within the limits while scanning the patterns
barRatioLimit (series float) : Bar ratio limit used for checking the bars. Used only when checkBarRatio is set to true
avoidOverlap (series bool) : avoid overlapping patterns.
allowedPatterns (bool ) : array of bool encoding the allowed pattern types.
allowedLastPivotDirections (int ) : array of int representing allowed last pivot direction for each pattern types
themeColors (color ) : color array of themes to be used.

Flags and Pennants [Trendoscope®]🎲 An extension to Chart Patterns based on Trend Line Pairs - Flags and Pennants
After exploring Algorithmic Identification and Classification of Chart Patterns and developing Auto Chart Patterns Indicator , we now delve into extensions of these patterns, focusing on Flag and Pennant Chart Patterns. These patterns evolve from basic trend line pair-based structures, often influenced by preceding market impulses.
🎲 Identification rules for the Extension Patterns
🎯 Identify the existence of Base Chart Patterns
Before identifying the flag and pennant patterns, we first need to identify the existence of following base trend line pair based converging or parallel patterns.
Ascending Channel
Descending Channel
Rising Wedge (Contracting)
Falling Wedge (Contracting)
Converging Triangle
Descending Triangle (Contracting)
Ascending Triangle (Contracting)
🎯 Identifying Extension Patterns.
The key to pinpointing these patterns lies in spotting a strong impulsive wave – akin to a flagpole – preceding a base pattern. This setup suggests potential for an extension pattern:
A Bullish Flag emerges from a positive impulse followed by a descending channel or a falling wedge
A Bearish Flag appears after a negative impulse leading to an ascending channel or a rising wedge.
A Bullish Pennant is indicated by a positive thrust preceding a converging triangle or ascending triangle.
A Bearish Pennant follows a negative impulse and a converging or descending triangle.
🎲 Pattern Classifications and Characteristics
🎯 Bullish Flag Pattern
Characteristics of Bullish Flag Pattern are as follows
Starts with a positive impulse wave
Immediately followed by either a short descending channel or a falling wedge
Here is an example of Bullish Flag Pattern
🎯 Bearish Flag Pattern
Characteristics of Bearish Flag Pattern are as follows
Starts with a negative impulse wave
Immediately followed by either a short ascending channel or a rising wedge
Here is an example of Bearish Flag Pattern
🎯 Bullish Pennant Pattern
Characteristics of Bullish Pennant Pattern are as follows
Starts with a positive impulse wave
Immediately followed by either a converging triangle or ascending triangle pattern.
Here is an example of Bullish Pennant Pattern
🎯 Bearish Pennant Pattern
Characteristics of Bearish Pennant Pattern are as follows
Starts with a negative impulse wave
Immediately followed by either a converging triangle or a descending converging triangle pattern.
Here is an example of Bearish Pennant Pattern
🎲 Trading Extension Patterns
In a strong market trend, it's common to see temporary periods of consolidation, forming patterns that either converge or range, often counter to the ongoing trend direction. Such pauses may lay the groundwork for the continuation of the trend post-breakout. The assumption that the trend will resume shapes the underlying bias of Flag and Pennant patterns
It's important, however, not to base decisions solely on past trends. Conducting personal back testing is crucial to ascertain the most effective entry and exit strategies for these patterns. Remember, the behavior of these patterns can vary significantly with the volatility of the asset and the specific timeframe being analyzed.
Approach the interpretation of these patterns with prudence, considering that market dynamics are subject to a wide array of influencing factors that might deviate from expected outcomes. For investors and traders, it's essential to engage in thorough back testing, establishing entry points, stop-loss orders, and target goals that align with your individual trading style and risk appetite. This step is key to assessing the viability of these patterns in line with your personal trading strategies and goals.
It's fairly common to witness a breakout followed by a swift price reversal after these patterns have formed. Additionally, there's room for innovation in trading by going against the bias if the breakout occurs in the opposite direction, specially when the trend before the formation of the pattern is in against the pattern bias.
🎲 Cheat Sheet
🎲 Indicator Settings
Custom Source : Enables users to set custom OHLC - this means, the indicator can also be applied on oscillators and other indicators having OHLC values.
Zigzag Settings : Allows users to enable different zigzag base and set length and depth for each zigzag.
Scanning Settings : Pattern scanning settings set some parameters that define the pattern recognition process.
Display Settings : Determine the display of indicators including colors, lines, labels etc.
Backtest Settings : Allows users to set a predetermined back test bars so that the indicator will not time out while trying to run for all available bars.

Auto Chart Patterns [Trendoscope®]🎲 Introducing our most comprehensive automatic chart pattern recognition indicator.
Last week, we published an idea on how to algorithmically identify and classify chart patterns.
This indicator is nothing but the initial implementation of the idea. Whatever we explained in that publication that users can do manually to identify and classify the pattern, this indicator will do it for them.
🎲 Process of identifying the patterns.
The bulk of the logic is implemented as part of the library - chartpatterns . The indicator is a shell that captures the user inputs and makes use of the library to deliver the outcome.
🎯 Here is the list of steps executed to identify the patterns on the chart.
Derive multi level recursive zigzag for multiple base zigzag length and depth combinations.
For each zigzag and level, check the last 5 pivots or 6 pivots (based on the input setting) for possibility of valid trend line pairs.
If there is a valid trend line pair, then there is pattern.
🎯 Rules for identifying the valid trend line pairs
There should be at least two trend lines that does not intersect between the starting and ending pivots.
The upper trend line should touch all the pivot highs of the last 5 or 6 pivots considered for scanning the patterns
The lower trend line should touch all the pivot lows of the last 5 or 6 pivots considered for scanning the patterns.
None of the candles from starting pivot to ending pivot should fall outside the trend lines (above upper trend line and below lower trend line)
The existence of a valid trend line pair signifies the existence of pattern. What type of pattern it is, to identify that we need to go through the classification rules.
🎲 Process of classification of the patterns.
We need to gather the following information before we classify the pattern.
Direction of upper trend line - rising, falling or flat
Direction of lower trend line - rising, falling or flat
Characteristics of trend line pair - converging, expanding, parallel
🎯 Broader Classifications
Broader classification would include the following types.
🚩 Classification Based on Geometrical Shapes
This includes
Wedges - both trend lines are moving in the same direction. But, the trend lines are either converging or diverging and not parallel to each other.
Triangles - trend lines are moving in different directions. Naturally, they are either converging or diverging.
Channels - Both trend lines are moving in the same direction, and they are parallel to each other within the limits of error.
🚩 Classification Based on Pattern Direction
This includes
Ascending/Rising Patterns - No trend line is moving in the downward direction and at least one trend line is moving upwards
Descending/Falling Patterns - No trend line is moving in the upward direction, and at least one trend line is moving downwards.
Flat - Both Trend Lines are Flat
Bi-Directional - Both trend lines are moving in opposite direction and none of them is flat.
🚩 Classification Based on Formation Dynamics
This includes
Converging Patterns - Trend Lines are converging towards each other
Diverging Patterns - Trend Lines are diverging from each other
Parallel Patterns - Trend Lines are parallel to each others
🎯 Individual Pattern Types
Now we have broader classifications. Let's go through in detail to find out fine-grained classification of each individual patterns.
🚩 Ascending/Uptrend Channel
This pattern belongs to the broader classifications - Ascending Patterns, Parallel Patterns and Channels. The rules for the Ascending/Uptrend Channel pattern are as below
Both trend lines are rising
Trend lines are parallel to each other
🚩 Descending/Downtrend Channel
This pattern belongs to the broader classifications - Descending Patterns, Parallel Patterns and Channels. The rules for the Descending/Downtrend Channel pattern are as below
Both trend lines are falling
Trend lines are parallel to each other
🚩 Ranging Channel
This pattern belongs to the broader classifications - Flat Patterns, Parallel Patterns and Channels. The rules for the Ranging Channel pattern are as below
Both trend lines are flat
Trend lines are parallel to each other
🚩 Rising Wedge - Expanding
This pattern belongs to the broader classifications - Rising Patterns, Diverging Patterns and Wedges. The rules for the Expanding Rising Wedge pattern are as below
Both trend lines are rising
Trend Lines are diverging.
🚩 Rising Wedge - Contracting
This pattern belongs to the broader classifications - Rising Patterns, Converging Patterns and Wedges. The rules for the Contracting Rising Wedge pattern are as below
Both trend lines are rising
Trend Lines are converging.
🚩 Falling Wedge - Expanding
This pattern belongs to the broader classifications - Falling Patterns, Diverging Patterns and Wedges. The rules for the Expanding Falling Wedge pattern are as below
Both trend lines are falling
Trend Lines are diverging.
🚩 Falling Wedge - Contracting
This pattern belongs to the broader classifications - Falling Patterns, Converging Patterns and Wedges. The rules for the Converging Falling Wedge are as below
Both trend lines are falling
Trend Lines are converging.
🚩 Rising/Ascending Triangle - Expanding
This pattern belongs to the broader classifications - Rising Patterns, Diverging Patterns and Triangles. The rules for the Expanding Ascending Triangle pattern are as below
The upper trend line is rising
The lower trend line is flat
Naturally, the trend lines are diverging from each other
🚩 Rising/Ascending Triangle - Contracting
This pattern belongs to the broader classifications - Rising Patterns, Converging Patterns and Triangles. The rules for the Contracting Ascending Triangle pattern are as below
The upper trend line is flat
The lower trend line is rising
Naturally, the trend lines are converging.
🚩 Falling/Descending Triangle - Expanding
This pattern belongs to the broader classifications - Falling Patterns, Diverging Patterns and Triangles. The rules for the Expanding Descending Triangle pattern are as below
The upper trend line is flat
The lower trend line is falling
Naturally, the trend lines are diverging from each other
🚩 Falling/Descending Triangle - Contracting
This pattern belongs to the broader classifications - Falling Patterns, Converging Patterns and Triangles. The rules for the Contracting Descending Triangle pattern are as below
The upper trend line is falling
The lower trend line is flat
Naturally, the trend lines are converging.
🚩 Converging Triangle
This pattern belongs to the broader classifications - Bi-Directional Patterns, Converging Patterns and Triangles. The rules for the Converging Triangle pattern are as below
The upper trend line is falling
The lower trend line is rising
Naturally, the trend lines are converging.
🚩 Diverging Triangle
This pattern belongs to the broader classifications - Bi-Directional Patterns, Diverging Patterns and Triangles. The rules for the Diverging Triangle pattern are as below
The upper trend line is rising
The lower trend line is falling
Naturally, the trend lines are diverging from each other.
🎲 Indicator Settings - Auto Chart Patterns
🎯 Zigzag Settings
Zigzag settings allow users to select the number of zigzag combinations to be used for pattern scanning, and also allows users to set zigzag length and depth combinations.
🎯 Scanning Settings
Number of Pivots - This can be either 5 or 6. Represents the number of pivots used for identification of patterns.
Error Threshold - Error threshold used for initial trend line validation.
Flat Threshold - Flat angle threshold is used to identify the slope and direction of trend lines.
Last Pivot Direction - Filters patterns based on the last pivot direction. The values can be up, down, both, or custom. When custom is selected, then the individual pattern specific last pivot direction setting is used instead of the generic one.
Verify Bar Ratio - Provides option to ignore extreme patterns where the ratios of zigzag lines are not proportionate to each other.
Avoid Overlap - When selected, the patterns that overlap with existing patterns will be ignored while scanning. Meaning, if the new pattern starting point falls between the start and end of an existing pattern, it will be ignored.
🎯 Group Classification Filters
Allows users to enable disable patterns based on group classifications.
🚩 Geometric Shapes Based Classifications
Wedges - Rising Wedge Expanding, Falling Wedge Expanding, Rising Wedge Contracting, Falling Wedge Contracting.
Channels - Ascending Channel, Descending Channel, Ranging Channel
Triangles - Converging Triangle, Diverging Triangle, Ascending Triangle Expanding, Descending Triangle Expanding, Ascending Triangle Contrcting and Descending Triangle Contracting
🚩 Direction Based Classifications
Rising - Rising Wedge Contracting, Rising Wedge Expanding, Ascending Triangle Contracting, Ascending Triangle Expanding and Ascending Channel
Falling - Falling Wedge Contracting, Falling Wedge Expanding, Descending Triangle Contracting, Descending Triangle Expanding and Descending Channel
Flat/Bi-directional - Ranging Channel, Converging Triangle, Diverging Triangle
🚩 Formation Dynamics Based Classifications
Expanding - Rising Wedge Expanding, Falling Wedge Expanding, Ascending Triangle Expanding, Descending Triangle Expanding, Diverging Triangle
Contracting - Rising Wedge Contracting, Falling Wedge Contracting, Ascending Triangle Contracting, Descending Triangle Contracting, Converging Triangle
Parallel - Ascending Channel, Descending Channgel and Ranging Channel
🎯 Individual Pattern Filters
These settings allow users to enable/disable individual patterns and also set last pivot direction filter individually for each pattern. Individual Last Pivot direction filters are only considered if the main "Last Pivot Direction" filter is set to "custom"
🎯 Display Settings
These are the settings that determine the indicator display. The details are provided in the tooltips and are self explanatory.
🎯 Alerts
A basic alert message is enabled upon detection of new pattern on the chart.

ohlcLibrary "ohlc"
Library having OHLC and Indicator type and method implementations.
getOhlcArray(o, h, l, c, barindex, bartime, indicators)
get array of OHLC values when called on every bar
Parameters:
o (float) : Open price
h (float) : High Price
l (float) : Low Price
c (float) : Close Price
barindex (int) : bar_index of OHLC data
bartime (int) : time of OHLC cata
indicators (Indicator ) : array containing indicator
Returns: Array of OHLC objects
push(this, item, maxItems)
Push items to OHLC array with maxItems limit
Parameters:
this (OHLC )
item (OHLC) : OHLC Item to be pushed to the array
maxItems (int) : max Items the array can hold at a time
Returns: current object
push(this, item, maxItems)
Push items to Indicator array with maxItems limit
Parameters:
this (Indicator )
item (Indicator) : Indicator Item to be pushed to the array
maxItems (int) : max Items the array can hold at a time
Returns: current object
unshift(this, item, maxItems)
Unshift items to OHLC array with maxItems limit
Parameters:
this (OHLC )
item (OHLC) : OHLC Item to be unshifted to the array
maxItems (int) : max Items the array can hold at a time
Returns: current object
unshift(this, item, maxItems)
Unshift items to Indicator array with maxItems limit
Parameters:
this (Indicator )
item (Indicator) : Indicator Item to be unshifted to the array
maxItems (int) : max Items the array can hold at a time
Returns: current object
method getPoints(indicators)
get array of points based on array of indicator values
Namespace types: Indicator
Parameters:
indicators (Indicator ) : Array containing indicator objects
Returns: array of indicator points
method plot(indicator, xloc, line_color, line_style, line_width)
plots an array of Indicator using polyline
Namespace types: Indicator
Parameters:
indicator (Indicator ) : Array containing indicator objects
xloc (string) : can have values xloc.bar_index or xloc.bar_time. Used for drawing the line based on either bars or time.
line_color (color) : color in which the plots need to be printed on chart.
line_style (string) : line style line.style_solid, line.style_dotted, line.style_dashed, line.style_arrow_right, line.style_arrow_left, line.style_arrow_both
line_width (int) : width of the plot line
Returns: array of plot polyline
Indicator
Object containing Indicator name and value
Fields:
name (series string) : Indicator Name
value (chart.point) : Indicator Value as a chart point
OHLC
Object containing OHLC and indicator values
Fields:
o (series float) : Open price
h (series float) : High Price
l (series float) : Low Price
c (series float) : Close Price
barindex (series int) : bar_index of OHLC data
bartime (series int) : time of OHLC cata
indicators (Indicator ) : array containing indicator
chartpatternsLibrary "chartpatterns"
Library having complete chart pattern implementation
method draw(this)
draws pattern on the chart
Namespace types: Pattern
Parameters:
this (Pattern) : Pattern object that needs to be drawn
Returns: Current Pattern object
method erase(this)
erase the given pattern on the chart
Namespace types: Pattern
Parameters:
this (Pattern) : Pattern object that needs to be erased
Returns: Current Pattern object
method findPattern(this, properties, patterns)
Find patterns based on the currect zigzag object and store them in the patterns array
Namespace types: zg.Zigzag
Parameters:
this (Zigzag type from Trendoscope/ZigzagLite/2) : Zigzag object containing pivots
properties (PatternProperties) : PatternProperties object
patterns (Pattern ) : Array of Pattern objects
Returns: Current Pattern object
PatternProperties
Object containing properties for pattern scanning
Fields:
offset (series int) : Zigzag pivot offset. Set it to 1 for non repainting scan.
numberOfPivots (series int) : Number of pivots to be used in pattern search. Can be either 5 or 6
errorRatio (series float) : Error Threshold to be considered for comparing the slope of lines
flatRatio (series float) : Retracement ratio threshold used to determine if the lines are flat
checkBarRatio (series bool) : Also check bar ratio are within the limits while scanning the patterns
barRatioLimit (series float) : Bar ratio limit used for checking the bars. Used only when checkBarRatio is set to true
avoidOverlap (series bool)
patternLineWidth (series int) : Line width of the pattern trend lines
showZigzag (series bool) : show zigzag associated with pattern
zigzagLineWidth (series int) : line width of the zigzag lines. Used only when showZigzag is set to true
zigzagLineColor (series color) : color of the zigzag lines. Used only when showZigzag is set to true
showPatternLabel (series bool) : display pattern label containing the name
patternLabelSize (series string) : size of the pattern label. Used only when showPatternLabel is set to true
showPivotLabels (series bool) : Display pivot labels of the patterns marking 1-6
pivotLabelSize (series string) : size of the pivot label. Used only when showPivotLabels is set to true
pivotLabelColor (series color) : color of the pivot label outline. chart.bg_color or chart.fg_color are the appropriate values.
allowedPatterns (bool ) : array of bool encoding the allowed pattern types.
themeColors (color ) : color array of themes to be used.
Pattern
Object containing Individual Pattern data
Fields:
pivots (Pivot type from Trendoscope/ZigzagLite/2) : array of Zigzag Pivot points
trendLine1 (Line type from Trendoscope/LineWrapper/1) : First trend line joining pivots 1, 3, 5
trendLine2 (Line type from Trendoscope/LineWrapper/1) : Second trend line joining pivots 2, 4 (, 6)
properties (PatternProperties) : PatternProperties Object carrying common properties
patternColor (series color) : Individual pattern color. Lines and labels will be using this color.
ratioDiff (series float) : Difference between trendLine1 and trendLine2 ratios
zigzagLine (series polyline) : Internal zigzag line drawing Object
pivotLabels (label ) : array containning Pivot labels
patternLabel (series label) : pattern label Object
patternType (series int) : integer representing the pattern type
patternName (series string) : Type of pattern in string

LineWrapperLibrary "LineWrapper"
Wrapper Type for Line. Useful when you want to store the line details without drawing them. Can also be used in scnearios where you collect lines to be drawn and draw together towards the end.
method draw(this)
draws line as per the wrapper object contents
Namespace types: Line
Parameters:
this (Line) : (series Line) Line object.
Returns: current Line object
method draw(this)
draws lines as per the wrapper object array
Namespace types: Line
Parameters:
this (Line ) : (series array) Array of Line object.
Returns: current Array of Line objects
method update(this)
updates or redraws line as per the wrapper object contents
Namespace types: Line
Parameters:
this (Line) : (series Line) Line object.
Returns: current Line object
method update(this)
updates or redraws lines as per the wrapper object array
Namespace types: Line
Parameters:
this (Line ) : (series array) Array of Line object.
Returns: current Array of Line objects
method delete(this)
Deletes the underlying line drawing object
Namespace types: Line
Parameters:
this (Line) : (series Line) Line object.
Returns: Current Line object
method get_price(this, bar)
get line price based on bar
Namespace types: Line
Parameters:
this (Line) : (series Line) Line object.
bar (int) : (series/int) bar at which line price need to be calculated
Returns: line price at given bar.
Line
Line Wrapper object
Fields:
p1 (chart.point)
p2 (chart.point)
xloc (series string) : (series string) See description of x1 argument. Possible values: xloc.bar_index and xloc.bar_time. Default is xloc.bar_index.
extend (series string) : (series string) If extend=extend.none, draws segment starting at point (x1, y1) and ending at point (x2, y2). If extend is equal to extend.right or extend.left, draws a ray starting at point (x1, y1) or (x2, y2), respectively. If extend=extend.both, draws a straight line that goes through these points. Default value is extend.none.
color (series color) : (series color) Line color.
style (series string) : (series string) Line style. Possible values: line.style_solid, line.style_dotted, line.style_dashed, line.style_arrow_left, line.style_arrow_right, line.style_arrow_both.
width (series int) : (series int) Line width in pixels.
obj (series line) : line object

ZigzagLiteLibrary "ZigzagLite"
Lighter version of the Zigzag Library. Without indicators and sub-component divisions
method getPrices(pivots)
Gets the array of prices from array of Pivots
Namespace types: Pivot
Parameters:
pivots (Pivot ) : array array of Pivot objects
Returns: array array of pivot prices
method getBars(pivots)
Gets the array of bars from array of Pivots
Namespace types: Pivot
Parameters:
pivots (Pivot ) : array array of Pivot objects
Returns: array array of pivot bar indices
method getPoints(pivots)
Gets the array of chart.point from array of Pivots
Namespace types: Pivot
Parameters:
pivots (Pivot ) : array array of Pivot objects
Returns: array array of pivot points
method getPoints(this)
Namespace types: Zigzag
Parameters:
this (Zigzag)
method calculate(this, ohlc, ltfHighTime, ltfLowTime)
Calculate zigzag based on input values and indicator values
Namespace types: Zigzag
Parameters:
this (Zigzag) : Zigzag object
ohlc (float ) : Array containing OHLC values. Can also have custom values for which zigzag to be calculated
ltfHighTime (int) : Used for multi timeframe zigzags when called within request.security. Default value is current timeframe open time.
ltfLowTime (int) : Used for multi timeframe zigzags when called within request.security. Default value is current timeframe open time.
Returns: current Zigzag object
method calculate(this)
Calculate zigzag based on properties embedded within Zigzag object
Namespace types: Zigzag
Parameters:
this (Zigzag) : Zigzag object
Returns: current Zigzag object
method nextlevel(this)
Namespace types: Zigzag
Parameters:
this (Zigzag)
method clear(this)
Clears zigzag drawings array
Namespace types: ZigzagDrawing
Parameters:
this (ZigzagDrawing ) : array
Returns: void
method clear(this)
Clears zigzag drawings array
Namespace types: ZigzagDrawingPL
Parameters:
this (ZigzagDrawingPL ) : array
Returns: void
method drawplain(this)
draws fresh zigzag based on properties embedded in ZigzagDrawing object without trying to calculate
Namespace types: ZigzagDrawing
Parameters:
this (ZigzagDrawing) : ZigzagDrawing object
Returns: ZigzagDrawing object
method drawplain(this)
draws fresh zigzag based on properties embedded in ZigzagDrawingPL object without trying to calculate
Namespace types: ZigzagDrawingPL
Parameters:
this (ZigzagDrawingPL) : ZigzagDrawingPL object
Returns: ZigzagDrawingPL object
method drawfresh(this, ohlc)
draws fresh zigzag based on properties embedded in ZigzagDrawing object
Namespace types: ZigzagDrawing
Parameters:
this (ZigzagDrawing) : ZigzagDrawing object
ohlc (float ) : values on which the zigzag needs to be calculated and drawn. If not set will use regular OHLC
Returns: ZigzagDrawing object
method drawcontinuous(this, ohlc)
draws zigzag based on the zigzagmatrix input
Namespace types: ZigzagDrawing
Parameters:
this (ZigzagDrawing) : ZigzagDrawing object
ohlc (float ) : values on which the zigzag needs to be calculated and drawn. If not set will use regular OHLC
Returns:
PivotCandle
PivotCandle represents data of the candle which forms either pivot High or pivot low or both
Fields:
_high (series float) : High price of candle forming the pivot
_low (series float) : Low price of candle forming the pivot
length (series int) : Pivot length
pHighBar (series int) : represents number of bar back the pivot High occurred.
pLowBar (series int) : represents number of bar back the pivot Low occurred.
pHigh (series float) : Pivot High Price
pLow (series float) : Pivot Low Price
Pivot
Pivot refers to zigzag pivot. Each pivot can contain various data
Fields:
point (chart.point) : pivot point coordinates
dir (series int) : direction of the pivot. Valid values are 1, -1, 2, -2
level (series int) : is used for multi level zigzags. For single level, it will always be 0
ratio (series float) : Price Ratio based on previous two pivots
sizeRatio (series float)
ZigzagFlags
Flags required for drawing zigzag. Only used internally in zigzag calculation. Should not set the values explicitly
Fields:
newPivot (series bool) : true if the calculation resulted in new pivot
doublePivot (series bool) : true if the calculation resulted in two pivots on same bar
updateLastPivot (series bool) : true if new pivot calculated replaces the old one.
Zigzag
Zigzag object which contains whole zigzag calculation parameters and pivots
Fields:
length (series int) : Zigzag length. Default value is 5
numberOfPivots (series int) : max number of pivots to hold in the calculation. Default value is 20
offset (series int) : Bar offset to be considered for calculation of zigzag. Default is 0 - which means calculation is done based on the latest bar.
level (series int) : Zigzag calculation level - used in multi level recursive zigzags
zigzagPivots (Pivot ) : array which holds the last n pivots calculated.
flags (ZigzagFlags) : ZigzagFlags object which is required for continuous drawing of zigzag lines.
ZigzagObject
Zigzag Drawing Object
Fields:
zigzagLine (series line) : Line joining two pivots
zigzagLabel (series label) : Label which can be used for drawing the values, ratios, directions etc.
ZigzagProperties
Object which holds properties of zigzag drawing. To be used along with ZigzagDrawing
Fields:
lineColor (series color) : Zigzag line color. Default is color.blue
lineWidth (series int) : Zigzag line width. Default is 1
lineStyle (series string) : Zigzag line style. Default is line.style_solid.
showLabel (series bool) : If set, the drawing will show labels on each pivot. Default is false
textColor (series color) : Text color of the labels. Only applicable if showLabel is set to true.
maxObjects (series int) : Max number of zigzag lines to display. Default is 300
xloc (series string) : Time/Bar reference to be used for zigzag drawing. Default is Time - xloc.bar_time.
curved (series bool) : Boolean field to print curved zigzag - used only with polyline implementation
ZigzagDrawing
Object which holds complete zigzag drawing objects and properties.
Fields:
zigzag (Zigzag) : Zigzag object which holds the calculations.
properties (ZigzagProperties) : ZigzagProperties object which is used for setting the display styles of zigzag
drawings (ZigzagObject ) : array which contains lines and labels of zigzag drawing.
ZigzagDrawingPL
Object which holds complete zigzag drawing objects and properties - polyline version
Fields:
zigzag (Zigzag) : Zigzag object which holds the calculations.
properties (ZigzagProperties) : ZigzagProperties object which is used for setting the display styles of zigzag
zigzagLabels (label )
zigzagLine (series polyline) : polyline object of zigzag lines

Multi-Timeframe Recursive Zigzag [Trendoscope®]🎲 Welcome to the Advanced World of Zigzag Analysis
Embark on a journey through the most comprehensive and feature-rich Zigzag implementation you’ll ever encounter. Our Multi-Timeframe Recursive Zigzag Indicator is not just another tool; it's a groundbreaking advancement in technical analysis.
🎯 Key Features
Multi Time-Frame Support - One of the rare open-source Zigzag indicators with robust multi-timeframe capabilities, this feature sets our tool apart, enabling a broader and more dynamic market analysis.
Innovative Recursive Zigzag Algorithm - At its core is our unique Recursive Zigzag Algorithm, a pioneering development that powers multiple Zigzag levels, offering an intricate view of market movements. This proprietary algorithm is the backbone of our advanced pattern recognition indicators.
Sub-Waves and Micro-Waves Analysis - Dive deeper into market trends with our Sub-Waves and Micro-Waves feature. Sub-Waves reveal the interconnectedness of various Zigzag levels, while Micro-Waves offer insight into the fundamental waves at the base level.
Enhanced Indicator Tracking - Integrate and track your custom indicators or oscillators with the zigzag, capturing their values at each Zigzag level, complete with retracement ratios. This offers a comprehensive view of market dynamics.
Curved Zigzag Visualization - Experience a new way of visualizing market movements with our Curved Zigzag Display, employing Pine Script’s polyline feature for a more intuitive and visually appealing representation.
Built-in Customizable Alerts - Stay ahead with built-in alerts that can be customized via user input settings.
🎯 Practical Applications
Our Zigzag Indicator is designed with an understanding of its inherent nature - the last unconfirmed pivot that consistently repaints. This characteristic, while by design, directs its usage more towards pattern recognition rather than direct identification of market tops and bottoms. Here's how you can leverage the Zigzag Indicator:
Harmonic Patterns - Ideal for those familiar with harmonic patterns, this tool simplifies the manual spotting of complex XABCD, ABC, and ABCD patterns on charts.
Chart Patterns - Effortlessly identify patterns like Double/Triple Taps, Head and Shoulders, Inverse Head and Shoulders, and Cup and Handle patterns with enhanced clarity. Navigate through challenging patterns such as Triangles, Wedges, Flags, and Price Channels, where the Zigzag Indicator adds a layer of precision to your breakout strategy.
Elliott Wave Components - The indicator's detailed pivot highlighting aids in identifying key Elliott Wave components, enhancing your wave analysis and decision-making process.
🎲 Deep Dive into Indicator Features
Join us as we explore the intricate features of our indicator in more detail.
🎯 Multi-Timeframe Capability
Our indicator comes equipped with an input option for selecting the desired resolution. This unique feature allows users to view higher timeframe Zigzag patterns directly on their lower timeframe charts.
🎯 Recursive Multi Level Zigzag
Our advanced recursive approach creates multi-level Zigzags from lower-level data. For instance, the level 0 Zigzag forms the base, calculated from specified length and depth parameters, while level 1 Zigzag is derived using level 0 as its foundation, and so forth.
The indicator not only displays multiple Zigzag levels but also offers settings to emphasize specific levels for more detailed analysis.
🎯 Sub-Components and Micro-Components of Zigzag Wave
Sub-components within a Zigzag wave consist of the previous level's Zigzag pivots. Meanwhile, the micro-components are composed of the base level (Level 0) Zigzag pivots encapsulated within the wave.
🎯 Curved Zigzag
Experience a new perspective with our curved Zigzag display. This innovative feature utilizes the polyline curved option to automatically generate sinusoidal waves based on multiple points.
🎯 Indicator Tracking
Default indicators such as RSI, MFI, and OBV are included, alongside the ability to track one external indicator at each Zigzag pivot.
🎯 Customizable Alerts
Our indicator employs the `alert()` function for alert creation. While this means the absence of a customization text box in the alert settings, we've included a custom text area for users to create their own alert templates.
Template placeholders include:
{alertType} - type of alert. Either Confirmed Pivot Update or Last Pivot Update. Depends on the alert type selected in the inputs.
When Last Pivot Update type is selected, the alerts are triggered whenever there is a new Zigzag Pivot. This may also be a repaint of last unconfirmed pivot.
When Confirmed Pivot Update type is selected, the alerts are triggered only when a pivot becomes a confirmed pivot.
{level} - Zigzag level on which the alert is triggered.
{pivot} - Details of the last pivot or confirmed pivot including price, ratio, indicator values and ratios, subcomponent and micro-component pivots.
🎲 User Settings Overview
🎯 Zigzag and Generic Settings
This involves some generic zigzag calculation settings such as length, depth, and timeframe. And few display options such as theme, Highlight Level and Curved Zigzag. By default, zigzag calculation is done based on the latest real time bar. An option is provided to disable this and use only confirmed bars for the calculation.
Indicator Settings
Allows users to track one or more oscillators or volume indicators. Option to add any indicator via external input is provided.
🎯 Alert Settings
Has input fields required to select and customize alerts.

arraysLibrary "arraymethods"
Supplementary array methods.
delete(arr, index)
remove int object from array of integers at specific index
Parameters:
arr : int array
index : index at which int object need to be removed
Returns: void
delete(arr, index)
remove float object from array of float at specific index
Parameters:
arr : float array
index : index at which float object need to be removed
Returns: float
delete(arr, index)
remove bool object from array of bool at specific index
Parameters:
arr : bool array
index : index at which bool object need to be removed
Returns: bool
delete(arr, index)
remove string object from array of string at specific index
Parameters:
arr : string array
index : index at which string object need to be removed
Returns: string
delete(arr, index)
remove color object from array of color at specific index
Parameters:
arr : color array
index : index at which color object need to be removed
Returns: color
delete(arr, index)
remove line object from array of lines at specific index and deletes the line
Parameters:
arr : line array
index : index at which line object need to be removed and deleted
Returns: void
delete(arr, index)
remove label object from array of labels at specific index and deletes the label
Parameters:
arr : label array
index : index at which label object need to be removed and deleted
Returns: void
delete(arr, index)
remove box object from array of boxes at specific index and deletes the box
Parameters:
arr : box array
index : index at which box object need to be removed and deleted
Returns: void
delete(arr, index)
remove table object from array of tables at specific index and deletes the table
Parameters:
arr : table array
index : index at which table object need to be removed and deleted
Returns: void
delete(arr, index)
remove linefill object from array of linefills at specific index and deletes the linefill
Parameters:
arr : linefill array
index : index at which linefill object need to be removed and deleted
Returns: void
popr(arr)
remove last int object from array
Parameters:
arr : int array
Returns: int
popr(arr)
remove last float object from array
Parameters:
arr : float array
Returns: float
popr(arr)
remove last bool object from array
Parameters:
arr : bool array
Returns: bool
popr(arr)
remove last string object from array
Parameters:
arr : string array
Returns: string
popr(arr)
remove last color object from array
Parameters:
arr : color array
Returns: color
popr(arr)
remove and delete last line object from array
Parameters:
arr : line array
Returns: void
popr(arr)
remove and delete last label object from array
Parameters:
arr : label array
Returns: void
popr(arr)
remove and delete last box object from array
Parameters:
arr : box array
Returns: void
popr(arr)
remove and delete last table object from array
Parameters:
arr : table array
Returns: void
popr(arr)
remove and delete last linefill object from array
Parameters:
arr : linefill array
Returns: void
shiftr(arr)
remove first int object from array
Parameters:
arr : int array
Returns: int
shiftr(arr)
remove first float object from array
Parameters:
arr : float array
Returns: float
shiftr(arr)
remove first bool object from array
Parameters:
arr : bool array
Returns: bool
shiftr(arr)
remove first string object from array
Parameters:
arr : string array
Returns: string
shiftr(arr)
remove first color object from array
Parameters:
arr : color array
Returns: color
shiftr(arr)
remove and delete first line object from array
Parameters:
arr : line array
Returns: void
shiftr(arr)
remove and delete first label object from array
Parameters:
arr : label array
Returns: void
shiftr(arr)
remove and delete first box object from array
Parameters:
arr : box array
Returns: void
shiftr(arr)
remove and delete first table object from array
Parameters:
arr : table array
Returns: void
shiftr(arr)
remove and delete first linefill object from array
Parameters:
arr : linefill array
Returns: void
push(arr, val, maxItems)
add int to the end of an array with max items cap. Objects are removed from start to maintain max items cap
Parameters:
arr : int array
val : int object to be pushed
maxItems : max number of items array can hold
Returns: int
push(arr, val, maxItems)
add float to the end of an array with max items cap. Objects are removed from start to maintain max items cap
Parameters:
arr : float array
val : float object to be pushed
maxItems : max number of items array can hold
Returns: float
push(arr, val, maxItems)
add bool to the end of an array with max items cap. Objects are removed from start to maintain max items cap
Parameters:
arr : bool array
val : bool object to be pushed
maxItems : max number of items array can hold
Returns: bool
push(arr, val, maxItems)
add string to the end of an array with max items cap. Objects are removed from start to maintain max items cap
Parameters:
arr : string array
val : string object to be pushed
maxItems : max number of items array can hold
Returns: string
push(arr, val, maxItems)
add color to the end of an array with max items cap. Objects are removed from start to maintain max items cap
Parameters:
arr : color array
val : color object to be pushed
maxItems : max number of items array can hold
Returns: color
push(arr, val, maxItems)
add line to the end of an array with max items cap. Objects are removed and deleted from start to maintain max items cap
Parameters:
arr : line array
val : line object to be pushed
maxItems : max number of items array can hold
Returns: line
push(arr, val, maxItems)
add label to the end of an array with max items cap. Objects are removed and deleted from start to maintain max items cap
Parameters:
arr : label array
val : label object to be pushed
maxItems : max number of items array can hold
Returns: label
push(arr, val, maxItems)
add box to the end of an array with max items cap. Objects are removed and deleted from start to maintain max items cap
Parameters:
arr : box array
val : box object to be pushed
maxItems : max number of items array can hold
Returns: box
push(arr, val, maxItems)
add table to the end of an array with max items cap. Objects are removed and deleted from start to maintain max items cap
Parameters:
arr : table array
val : table object to be pushed
maxItems : max number of items array can hold
Returns: table
push(arr, val, maxItems)
add linefill to the end of an array with max items cap. Objects are removed and deleted from start to maintain max items cap
Parameters:
arr : linefill array
val : linefill object to be pushed
maxItems : max number of items array can hold
Returns: linefill
unshift(arr, val, maxItems)
add int to the beginning of an array with max items cap. Objects are removed from end to maintain max items cap
Parameters:
arr : int array
val : int object to be unshift
maxItems : max number of items array can hold
Returns: int
unshift(arr, val, maxItems)
add float to the beginning of an array with max items cap. Objects are removed from end to maintain max items cap
Parameters:
arr : float array
val : float object to be unshift
maxItems : max number of items array can hold
Returns: float
unshift(arr, val, maxItems)
add bool to the beginning of an array with max items cap. Objects are removed from end to maintain max items cap
Parameters:
arr : bool array
val : bool object to be unshift
maxItems : max number of items array can hold
Returns: bool
unshift(arr, val, maxItems)
add string to the beginning of an array with max items cap. Objects are removed from end to maintain max items cap
Parameters:
arr : string array
val : string object to be unshift
maxItems : max number of items array can hold
Returns: string
unshift(arr, val, maxItems)
add color to the beginning of an array with max items cap. Objects are removed from end to maintain max items cap
Parameters:
arr : color array
val : color object to be unshift
maxItems : max number of items array can hold
Returns: color
unshift(arr, val, maxItems)
add line to the beginning of an array with max items cap. Objects are removed and deleted from end to maintain max items cap
Parameters:
arr : line array
val : line object to be unshift
maxItems : max number of items array can hold
Returns: line
unshift(arr, val, maxItems)
add label to the beginning of an array with max items cap. Objects are removed and deleted from end to maintain max items cap
Parameters:
arr : label array
val : label object to be unshift
maxItems : max number of items array can hold
Returns: label
unshift(arr, val, maxItems)
add box to the beginning of an array with max items cap. Objects are removed and deleted from end to maintain max items cap
Parameters:
arr : box array
val : box object to be unshift
maxItems : max number of items array can hold
Returns: box
unshift(arr, val, maxItems)
add table to the beginning of an array with max items cap. Objects are removed and deleted from end to maintain max items cap
Parameters:
arr : table array
val : table object to be unshift
maxItems : max number of items array can hold
Returns: table
unshift(arr, val, maxItems)
add linefill to the beginning of an array with max items cap. Objects are removed and deleted from end to maintain max items cap
Parameters:
arr : linefill array
val : linefill object to be unshift
maxItems : max number of items array can hold
Returns: linefill
flush(arr)
remove all int objects in an array
Parameters:
arr : int array
Returns: int
flush(arr)
remove all float objects in an array
Parameters:
arr : float array
Returns: float
flush(arr)
remove all bool objects in an array
Parameters:
arr : bool array
Returns: bool
flush(arr)
remove all string objects in an array
Parameters:
arr : string array
Returns: string
flush(arr)
remove all color objects in an array
Parameters:
arr : color array
Returns: color
flush(arr)
remove and delete all line objects in an array
Parameters:
arr : line array
Returns: line
flush(arr)
remove and delete all label objects in an array
Parameters:
arr : label array
Returns: label
flush(arr)
remove and delete all box objects in an array
Parameters:
arr : box array
Returns: box
flush(arr)
remove and delete all table objects in an array
Parameters:
arr : table array
Returns: table
flush(arr)
remove and delete all linefill objects in an array
Parameters:
arr : linefill array
Returns: linefill
ZigzagLibrary "Zigzag"
Zigzag related user defined types. Depends on DrawingTypes library for basic types
method tostring(this, sortKeys, sortOrder, includeKeys)
Converts ZigzagTypes/Pivot object to string representation
Namespace types: Pivot
Parameters:
this (Pivot) : ZigzagTypes/Pivot
sortKeys (bool) : If set to true, string output is sorted by keys.
sortOrder (int) : Applicable only if sortKeys is set to true. Positive number will sort them in ascending order whreas negative numer will sort them in descending order. Passing 0 will not sort the keys
includeKeys (string ) : Array of string containing selective keys. Optional parmaeter. If not provided, all the keys are considered
Returns: string representation of ZigzagTypes/Pivot
method tostring(this, sortKeys, sortOrder, includeKeys)
Converts Array of Pivot objects to string representation
Namespace types: Pivot
Parameters:
this (Pivot ) : Pivot object array
sortKeys (bool) : If set to true, string output is sorted by keys.
sortOrder (int) : Applicable only if sortKeys is set to true. Positive number will sort them in ascending order whreas negative numer will sort them in descending order. Passing 0 will not sort the keys
includeKeys (string ) : Array of string containing selective keys. Optional parmaeter. If not provided, all the keys are considered
Returns: string representation of Pivot object array
method tostring(this)
Converts ZigzagFlags object to string representation
Namespace types: ZigzagFlags
Parameters:
this (ZigzagFlags) : ZigzagFlags object
Returns: string representation of ZigzagFlags
method tostring(this, sortKeys, sortOrder, includeKeys)
Converts ZigzagTypes/Zigzag object to string representation
Namespace types: Zigzag
Parameters:
this (Zigzag) : ZigzagTypes/Zigzagobject
sortKeys (bool) : If set to true, string output is sorted by keys.
sortOrder (int) : Applicable only if sortKeys is set to true. Positive number will sort them in ascending order whreas negative numer will sort them in descending order. Passing 0 will not sort the keys
includeKeys (string ) : Array of string containing selective keys. Optional parmaeter. If not provided, all the keys are considered
Returns: string representation of ZigzagTypes/Zigzag
method calculate(this, ohlc, indicators, indicatorNames)
Calculate zigzag based on input values and indicator values
Namespace types: Zigzag
Parameters:
this (Zigzag) : Zigzag object
ohlc (float ) : Array containing OHLC values. Can also have custom values for which zigzag to be calculated
indicators (matrix) : Array of indicator values
indicatorNames (string ) : Array of indicator names for which values are present. Size of indicators array should be equal to that of indicatorNames
Returns: current Zigzag object
method calculate(this)
Calculate zigzag based on properties embedded within Zigzag object
Namespace types: Zigzag
Parameters:
this (Zigzag) : Zigzag object
Returns: current Zigzag object
method nextlevel(this)
Calculate Next Level Zigzag based on the current calculated zigzag object
Namespace types: Zigzag
Parameters:
this (Zigzag) : Zigzag object
Returns: Next Level Zigzag object
method clear(this)
Clears zigzag drawings array
Namespace types: ZigzagDrawing
Parameters:
this (ZigzagDrawing ) : array
Returns: void
method drawplain(this)
draws fresh zigzag based on properties embedded in ZigzagDrawing object without trying to calculate
Namespace types: ZigzagDrawing
Parameters:
this (ZigzagDrawing) : ZigzagDrawing object
Returns: ZigzagDrawing object
method drawfresh(this, ohlc, indicators, indicatorNames)
draws fresh zigzag based on properties embedded in ZigzagDrawing object
Namespace types: ZigzagDrawing
Parameters:
this (ZigzagDrawing) : ZigzagDrawing object
ohlc (float ) : values on which the zigzag needs to be calculated and drawn. If not set will use regular OHLC
indicators (matrix) : Array of indicator values
indicatorNames (string ) : Array of indicator names for which values are present. Size of indicators array should be equal to that of indicatorNames
Returns: ZigzagDrawing object
method drawcontinuous(this, ohlc, indicators, indicatorNames)
draws zigzag based on the zigzagmatrix input
Namespace types: ZigzagDrawing
Parameters:
this (ZigzagDrawing) : ZigzagDrawing object
ohlc (float ) : values on which the zigzag needs to be calculated and drawn. If not set will use regular OHLC
indicators (matrix) : Array of indicator values
indicatorNames (string ) : Array of indicator names for which values are present. Size of indicators array should be equal to that of indicatorNames
Returns:
method getPrices(pivots)
Namespace types: Pivot
Parameters:
pivots (Pivot )
method getBars(pivots)
Namespace types: Pivot
Parameters:
pivots (Pivot )
Indicator
Indicator is collection of indicator values applied on high, low and close
Fields:
indicatorHigh (series float) : Indicator Value applied on High
indicatorLow (series float) : Indicator Value applied on Low
PivotCandle
PivotCandle represents data of the candle which forms either pivot High or pivot low or both
Fields:
_high (series float) : High price of candle forming the pivot
_low (series float) : Low price of candle forming the pivot
length (series int) : Pivot length
pHighBar (series int) : represents number of bar back the pivot High occurred.
pLowBar (series int) : represents number of bar back the pivot Low occurred.
pHigh (series float) : Pivot High Price
pLow (series float) : Pivot Low Price
indicators (Indicator ) : Array of Indicators - allows to add multiple
Pivot
Pivot refers to zigzag pivot. Each pivot can contain various data
Fields:
point (chart.point) : pivot point coordinates
dir (series int) : direction of the pivot. Valid values are 1, -1, 2, -2
level (series int) : is used for multi level zigzags. For single level, it will always be 0
componentIndex (series int) : is the lower level zigzag array index for given pivot. Used only in multi level Zigzag Pivots
subComponents (series int) : is the number of sub waves per each zigzag wave. Only applicable for multi level zigzags
microComponents (series int) : is the number of base zigzag components in a zigzag wave
ratio (series float) : Price Ratio based on previous two pivots
sizeRatio (series float)
subPivots (Pivot )
indicatorNames (string ) : Names of the indicators applied on zigzag
indicatorValues (float ) : Values of the indicators applied on zigzag
indicatorRatios (float ) : Ratios of the indicators applied on zigzag based on previous 2 pivots
ZigzagFlags
Flags required for drawing zigzag. Only used internally in zigzag calculation. Should not set the values explicitly
Fields:
newPivot (series bool) : true if the calculation resulted in new pivot
doublePivot (series bool) : true if the calculation resulted in two pivots on same bar
updateLastPivot (series bool) : true if new pivot calculated replaces the old one.
Zigzag
Zigzag object which contains whole zigzag calculation parameters and pivots
Fields:
length (series int) : Zigzag length. Default value is 5
numberOfPivots (series int) : max number of pivots to hold in the calculation. Default value is 20
offset (series int) : Bar offset to be considered for calculation of zigzag. Default is 0 - which means calculation is done based on the latest bar.
level (series int) : Zigzag calculation level - used in multi level recursive zigzags
zigzagPivots (Pivot ) : array which holds the last n pivots calculated.
flags (ZigzagFlags) : ZigzagFlags object which is required for continuous drawing of zigzag lines.
ZigzagObject
Zigzag Drawing Object
Fields:
zigzagLine (series line) : Line joining two pivots
zigzagLabel (series label) : Label which can be used for drawing the values, ratios, directions etc.
ZigzagProperties
Object which holds properties of zigzag drawing. To be used along with ZigzagDrawing
Fields:
lineColor (series color) : Zigzag line color. Default is color.blue
lineWidth (series int) : Zigzag line width. Default is 1
lineStyle (series string) : Zigzag line style. Default is line.style_solid.
showLabel (series bool) : If set, the drawing will show labels on each pivot. Default is false
textColor (series color) : Text color of the labels. Only applicable if showLabel is set to true.
maxObjects (series int) : Max number of zigzag lines to display. Default is 300
xloc (series string) : Time/Bar reference to be used for zigzag drawing. Default is Time - xloc.bar_time.
ZigzagDrawing
Object which holds complete zigzag drawing objects and properties.
Fields:
zigzag (Zigzag) : Zigzag object which holds the calculations.
properties (ZigzagProperties) : ZigzagProperties object which is used for setting the display styles of zigzag
drawings (ZigzagObject ) : array which contains lines and labels of zigzag drawing.

Zigzag Tails [Trendoscope®] 🎲 Introducing Zigzag Tails Indicator by Trendoscope.
The Zigzag Tails Indicator, a groundbreaking tool from Trendoscope, redefines technical analysis by seamlessly integrating anchored VWAPs (Volume Weighted Average Prices) and Average Price calculations with Zigzag pivot points. This advanced indicator recalculates Average Price or VWAP from one Zigzag pivot to the next, offering unparalleled insights into market movements.
🎯 Innovative Design
Each Zigzag pivot can feature up to three distinct tails, corresponding to the high, low, and close prices of each candle. Users have the flexibility to select between Average Price and VWAP for display on their charts. By default, the indicator plots all three tails, but individual tail visibility is customizable via the settings panel.
Average Price Mode: When selected, tails depict the average price across a specified number of bars.
VWAP Mode: In this mode, tails represent the VWAP, calculated for a given price over a set number of bars.
🎯 Dynamic Dotted Tail
The Zigzag Tails Indicator features dotted tails that extend from the last Zigzag pivot to the current bar. These dotted tails dynamically adapt to market changes and are subject to repainting with the emergence of new Zigzag pivots.
When repainting is enabled, the dotted tails originate from the last unconfirmed Zigzag pivot, extending to the current bar. This setting offers a more immediate, albeit tentative, visual representation of market trends.
With repainting disabled, the dotted tails will be anchored from the last confirmed Zigzag pivot to the current bar, providing a more stable but slightly delayed market analysis.
Irrespective of the repaint option, the dotted dynamic tails is always expected to repaint.
🎯 Practical Applications
The Zigzag Tails Indicator provides more accurate support and resistance levels than traditional VWAP, rolling VWAP, or moving averages. Its precision makes it an invaluable tool for identifying trends, as well as potential trend continuations or reversals.
🛠 Indicator Settings
Zigzag Configuration:
Zigzag Length determines the loopback length for the foundational Zigzag calculation.
Number of Bars represent the calculation distance. This limitation is added to avoid runtime errors on lower timeframes. The calculations run through lots of loops. Hence, if it is run across too many bars, we may get timeout issues.
Repaint: Activating this will also display the last, unconfirmed Zigzag pivot. Since the last pivot is inherently tentative, it may repaint with the arrival of new bars. A pivot is confirmed only when a subsequent unconfirmed pivot emerges on the chart.
Tail Configuration
Tail Type: Choose between average and VWAP for the tail calculation. The average option plots a simple average, while the VWAP option calculates an anchored VWAP from pivot to pivot.
Display Options: Tailored display options for High, Low, Close prices, with customizable colors for each tail type.
Inspired by the ideas of @KioseffTrading's implementation of Zigzag Anchored VWAP

Divergence Indicator [Trendoscope®]🎲 New Divergence Indicator by Trendoscope
Our latest Divergence Indicator revolutionizes the way traders identify market trends and potential reversals. Built upon the robust foundation of the Zigzag Trend Divergence Detector and inline with our recent implementation of the Divergence Goggles indicator, this tool is designed to be intuitive yet powerful, making it an essential addition to any trader's toolkit.
We received several queries on extending the Divergence Goggles to last N bars instead of using an interactive widget. Though it is possible, we thought the better approach is to enable the indicator to use any oscillator and trend indicator in order to define the divergence.
🎯 Key Features
Flexible Oscillator Integration : Choose from a wide range of built-in oscillators or import your own, including options like the innovative Multiband Oscillator. This versatility extends to using volume indicators like OBV for divergence calculations, broadening the scope of analysis.
Trend Identification Versatility : Utilize built-in methods like Zigzag and MA Difference, or integrate external trend indicators. Our system adapts to various methods, ensuring you have the right tools for precise trend identification.
Customizable Zigzag Sensitivity : Adjust the Zigzag based on your chosen oscillator's sensitivity to ensure divergence lines are accurate and visually coherent.
Repainting vs. Delayed Signals : Tailor the indicator to your strategy by choosing between immediate repainting signals and slightly delayed but more stable signals.
🎯 Understanding Divergence: Key Rules
Bullish Divergence
Happens only in downtrend
Observed on Pivot Lows
Price makes lower low whereas oscillator makes higher low, indicating weakness and possible reversal
Bearish Divergence
Happens only in uptrend
Observed on Pivot Highs
Price makes higher high whereas oscillator makes lower high, indicating weakness and possible reversal
Bullish Hidden Divergence
Happens only in uptrend
Observed on Pivot Lows
Price makes higher low, whereas indicator makes lower low due to price consolidation. In bullish trend, this is considered as bullish as the price gets a breather and get ready to surge further.
Bearish Hidden Divergence
Happens only in downtrend
Observed on Pivot Highs
Price makes lower high whereas oscillator makes higher high due to price consolidation. In bearish trend, this is considered as bearish as the price gets a breather and get ready to fall further.
🎯 Visual Insights: Divergence and Hidden Divergence
For a clearer understanding, refer to our visual guides:
🎲 Using the Divergence Indicator: A Step-by-Step Guide
🎯 Step 1 - Selecting the Oscillator
Customize your analysis by choosing from a variety of oscillators or importing your preferred one. Options are available to select a range of built-in oscillators and the loopback length. However, if the oscillator that user want to use is not in the list, they can simply load the oscillator from the indicator library and use it as an external signal.
In our current example, we are using a custom oscillator called - Multiband Oscillator
This also means, the indicator option is not limited to oscillators. Users can even make use of volume indicators such as OBV for the calculation of divergence.
🎯 Step 2 - Choosing the Trend Identification Method
Select from our built-in methods or integrate an external indicator to accurately identify market trends. Trend is one of the key parameters of divergence type identification. Trend can be identified mathematically by various methods. Some of them are as simple as above or below 200 moving average and some can follow trend based indicators such as supertrend and others can be very complex.
To cater for a wider audience, here too we have provided the option to use an external trend indicator. The simple condition for the external trend indicator is that it should return positive value for uptrend and negative value for downtrend.
Other than that, we also have 2 built in trend identification methods.
Zigzag - The trend is defined by the starting pivot of divergence line. If the starting pivot is Higher High or Higher Low, then it is considered uptrend. And if the starting pivot is either Lower Low or Lower High, then we consider it as downtrend.
MA Difference - In this case, the difference between the moving average of pivots joining the divergence line will determine the trend. It is considered uptrend if the moving average increased from starting pivot to ending pivot of the divergence line, and it is considered downtrend if the moving average decreased from starting pivot to the ending pivot of the divergence line.
🎯 Step 3 - Adjusting Zigzag Sensitivity
Fine-tune the Zigzag to match the oscillator's sensitivity, ensuring divergence lines are accurate and visually coherent.
🎯 Step 4 - Managing Repainting
Understand the implications of repainting in the last pivot of the Zigzag and choose between immediate or delayed signals based on your trading strategy. The last pivot of the zigzag repaint by design. This is not necessarily a bad thing. Users can just choose not to use the last pivot, but instead use the last but one for all the calculations. But, this also means, the signals will be delayed.
Indicator provides option to use repainting signal vs delayed signal. If you select the repaint option, the signals are shown immediately as and when they occur. But, there is a possibility that these signals change when the new price candles change zigzag pivot.
If you chose not to select the repaint option, then the divergence signals may lag by a few bars.