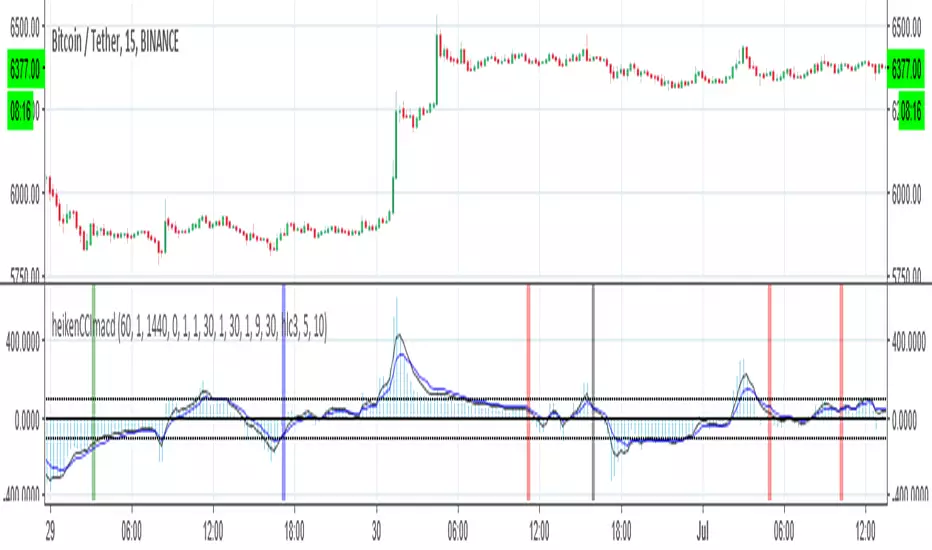
heikenCCImacdI just made new exit point and buy point to older version with some tweek
two buy system 1. based on heiken strategy with filtering by CCI (green red =long short) i little change the old exit point
the other 2. based on cross of CCI in constriction of macd (blue black =long1 shor1)
alerts included
so one can decide on what he like also it possible to combine between them :)
Heikin
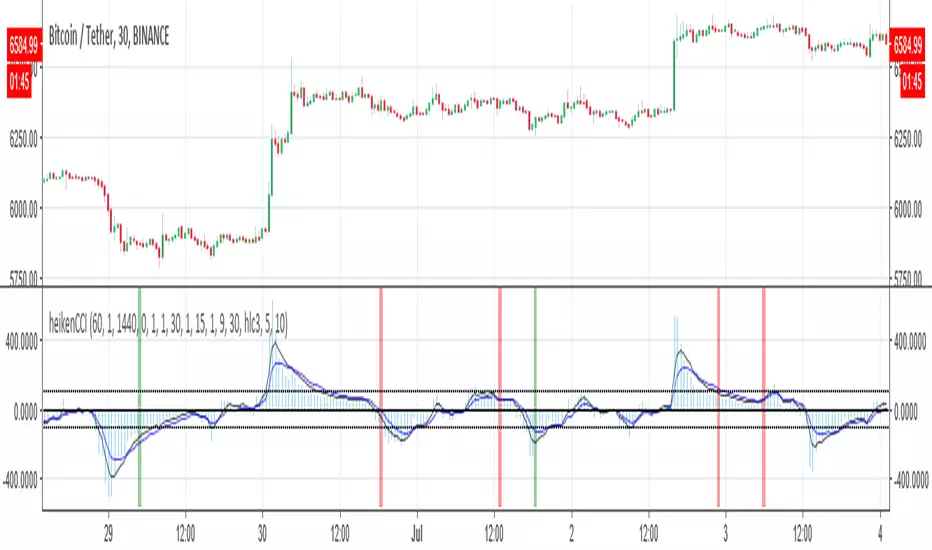
heikenCCIthe aim is to make winning strategy better. the buy point based on heiken strategy with more 80% winning rate and to filter the wrong buy points with CCI buy points
alerts inside
Heikin Ashi Historical TF Developmental BarsAn improvement to the built-in security(heikinashi()...) method, this indicator plots Heikin Ashi (HA) candles for an input timeframe (TF) on an underlying regular candlestick chart of a shorter TF. The improvement is that it plots the value of each in-development HA bar as it would have appeared while still repainting, for each underlying chart bar. The last chart bar of each TF matches the value available from security() calls and from HA charts directly.
For best results, be sure to use a HA TF greater than chart TF (I prefer 1 minute unless longer history is required).
1 hour HA on 1 minute underlying price chart
4 hour HA on 1 minute underlying price chart
V3: Release.

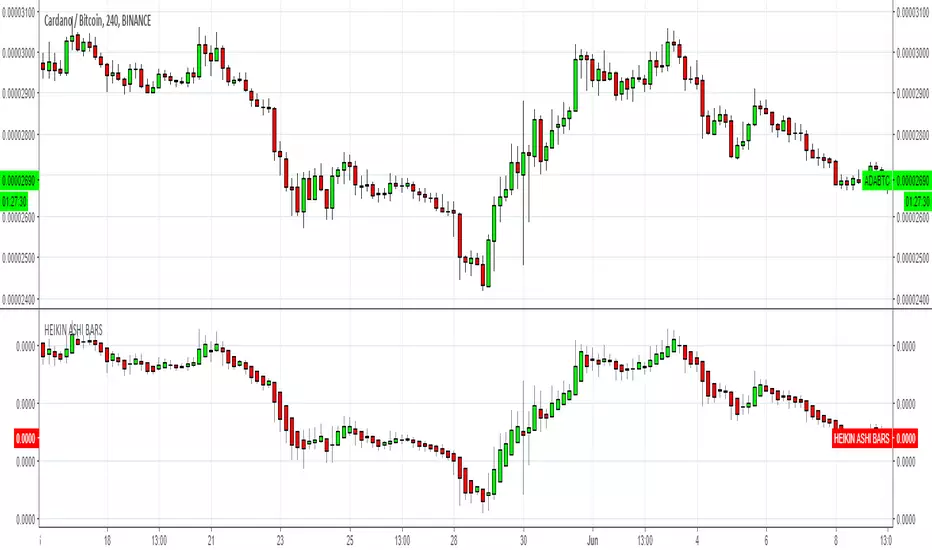
HEIKIN ASHI BARSSimple Heikin Ashi candlebars
Please consider a tip if you find this useful
BTC: 3FiBnveHo3YW6DSiPEmoCFCyCnsrWS3JBR
ETH: 0xac290B4A721f5ef75b0971F1102e01E1942A4578
Heikin-Ashi VWMA Smoothed Trend Ribbon with Custom time framesThis is a Heikin - Ashi Smoothed Trend Ribbon.
I'm using the VWMA for its smoothing calculation.
The Ribbon is based on the open and close of the Heikin - Ashi candles and doesn't show the wicks.
I have also allowed the viewing of different time frames to the current chart layout.
If you have any comments and feedback please comment below.
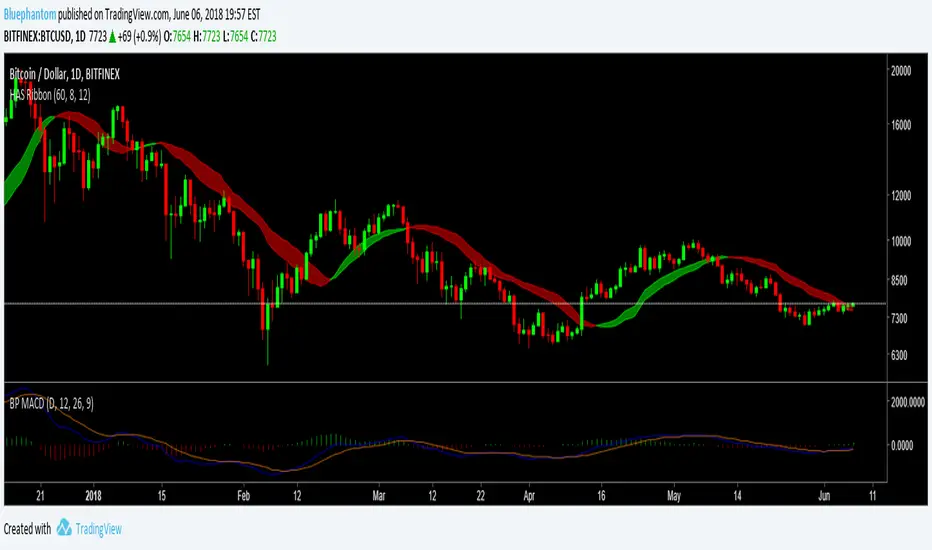
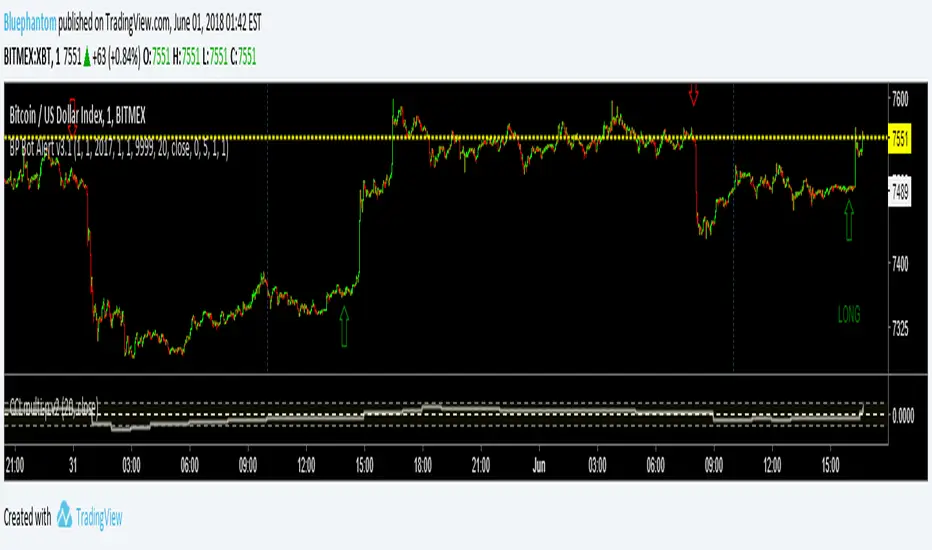
Autoview Bot Alert v3.1 By BluephantomThis Alert Script is invite only. To be considered you must contact me through the Autoview Discord group.
It uses an EMA smoothed Heikin-Ashi and an average CCI based on multi time frames.
mcbw_RSI_candlesAn RSI can have any input, but most commonly used is the closing price. I thought it would be interesting to see if feeding the open high low and close information into the RSI to make RSI candles, if there are candlestick formations that can be recognized or possible patters in wicks.
To make it smoother there also is the option to turn the RSI candles into Heiken Ashi form, just check the box labeled HA. The result is an RSI that is easier on the eyes.
Happy trading!
Remember to not take everything too seriously

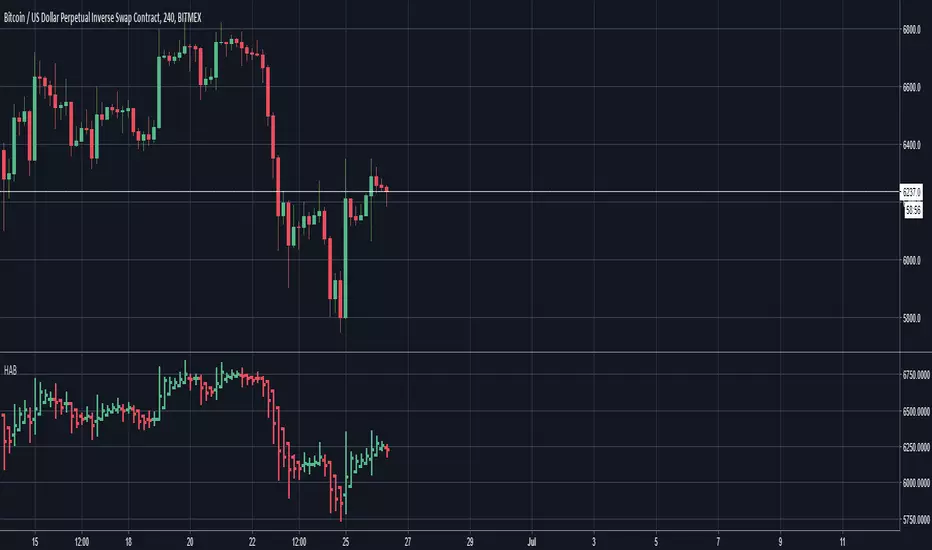
Whales of bitmexThis script use :
ema
macd
heiken ashi candle
4 alert
Enter long
Enter short
Close Long
Close short
Msg me for test !

CB SDB HK VOL IndicatorIndicator version of designed for use with independent automation solution.
Custom development published for customer verification and acceptance.
If you are interested in development services, please visit the backtest-rookies website or message me to find out more.

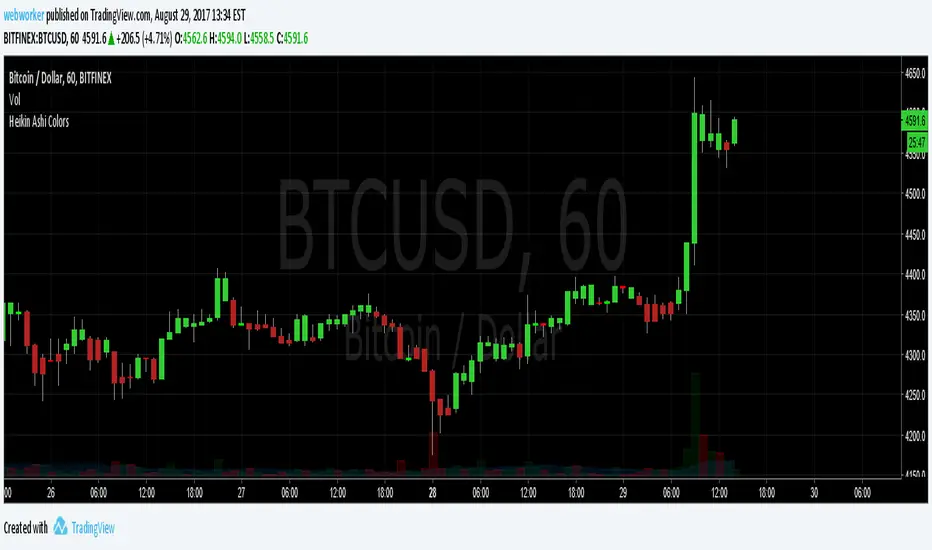
Heikin Ashi ColorsThis script simply changes the colors on your candle and hollow candle charts to Heikin Ashi style colors without changing the values of the bars.
Great for visualizing trends, but getting an accurate picture of prices!
HEIKIN ASHI COLOUR CHANGE ALERTThis can be used to trigger an alert if Heikin Ashi bar changes color :)

I_Heikin Ashi CandleWhen apply a strategy to Heikin Ashi Candle chart (HA candle), the strategy will use the open/close/high/low values of the Heikin Ashi candle to calculate the Profit and Loss, hence also affecting the Percent Profitable, Profit Factor, etc., often resulting a unrealistic high Percent Profitable and Profit Factor, which is misleading. But if you want to use the HA candle's values to calculate your indicator / strategy, but pass the normal candle's open/close/high/low values to the strategy to calculate the Profit / Loss, you can do this:
1) set up the main chart to be a normal candle chart
2) use this indicator script to plot a secondary window with indicator looks exactly like a HA-chart
3) to use the HA-candle's open/close/high/low value to calculate whatever indicator you want (you may need to create a separate script if you want to plot this indicator in a separate indicator window)

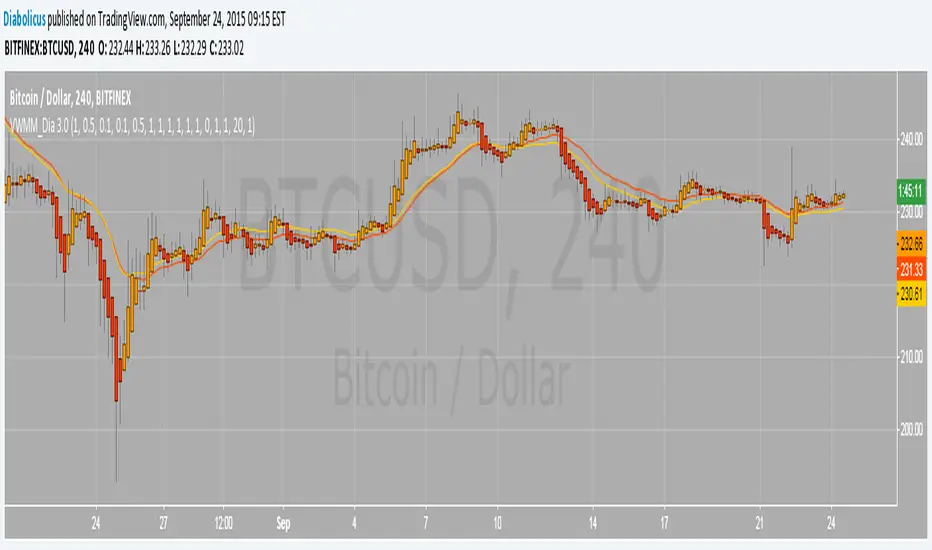
Volume Weighted Market Mean 3.0 [Dia]150924 - v3.0
This script is a complete rewrite of the previous version here .
It gathers market data from up to 8 different Bitcoin exchange pairs (8 is maximum due to script limitations).The influence of each single exchange can be customized individually, default is 50% for 0-fee exchanges, 10% for futures and 100% for all others. For each single exchange a standard deviation from the composite mean price and a average price range are determined. To make data from exchanges with different liquidity comparable, all single exchange price ranges are normalized to the range of the composite mean price. To make data from exchanges with different fee structure (= exchanges that constantly trade at a premium / discount) comparable, all single exchange prices are corrected by their respective standard deviations. To account for trade volume, all price data is weighted by the current candles volume.
- optional Heikin Ashi candle display
- optional EMAs
- lots of switches to play around with ;-)
CM Heikin-Ashi Candlesticks_V1Heikin-Ashi Paint Bars.
Paints Candlesticks or OHLC Bars The Exact Same as Traditional Heikin-Ashi Bars

CM_Modified_Heikin-Ashi_TrendBarsCreated By Request for lucalucious
Allows for EMA Smoothing with different values for Up and Down Trend.
Ability to Plot EMA to see Trend Filter
