Future Ichimoku Cloud - HorizonIchimoku Horizon is an advanced Ichimoku indicator that projects future cloud formations and component lines, giving traders unprecedented visibility into potential support/resistance zones before they form.
1. Future Ichimoku Projections
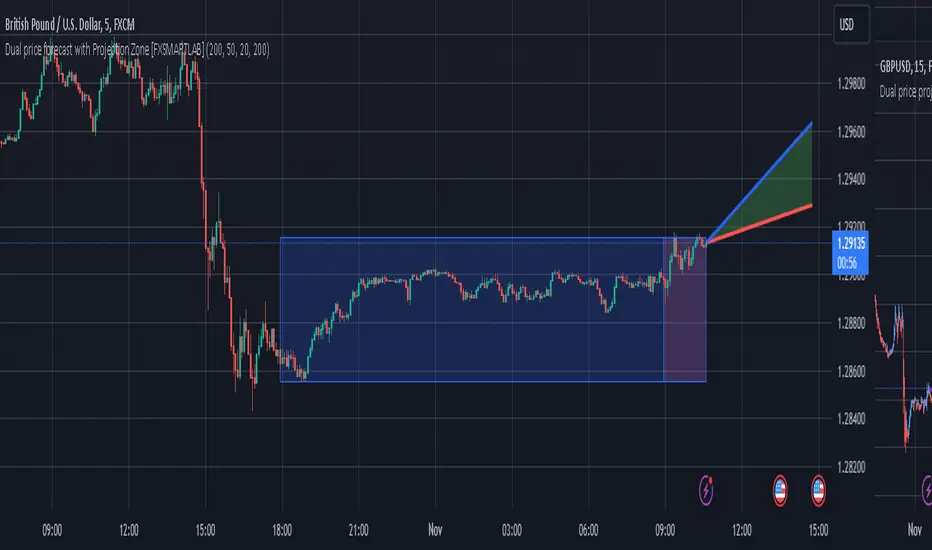
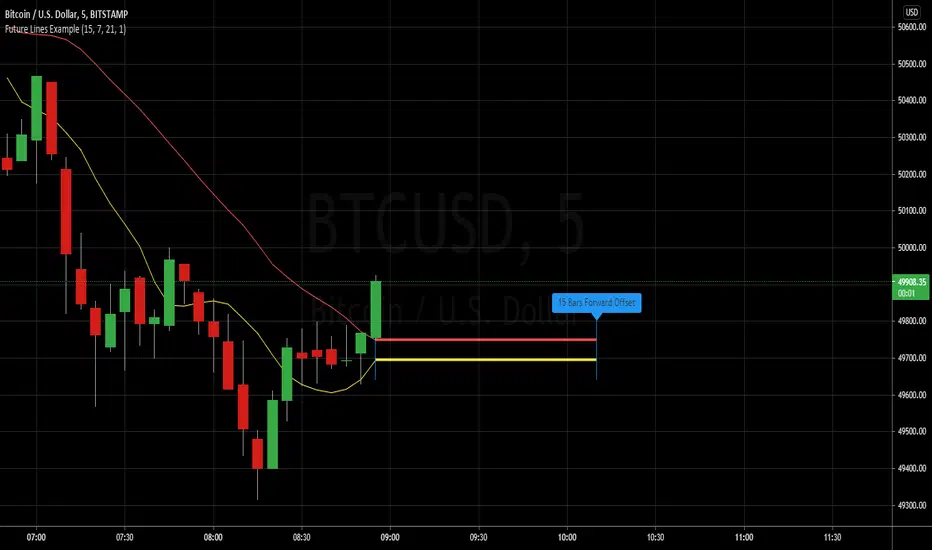
Project Ichimoku components forward in time using simulated price evolution based on rolling Tenkan/Kijun windows
Manual forecast periods up to 125 bars (all 4 components) or 500 bars (cloud only)
Smart limit management automatically adjusts to TradingView's drawing object limits while maximizing visible projections
2. Preset & Custom Ichimoku Configurations
Choose from multiple common Ichimoku presets or fully customize your own
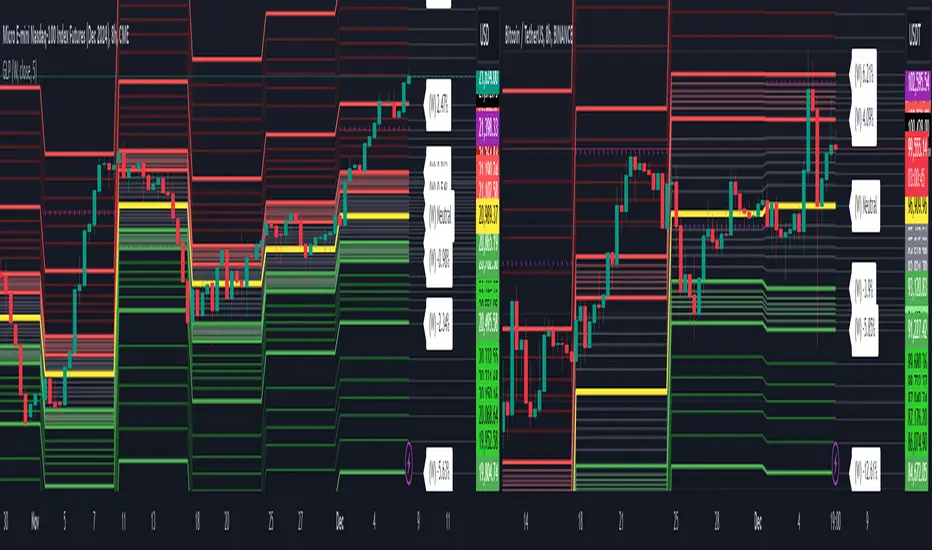
3. Multi-Timeframe Display & Projections
Display Ichimoku from higher/lower timeframes directly on your current timeframe chart
Automatic scaling adjusts Ichimoku periods correctly across timeframes
Intelligent handling of 24/7 markets (crypto/forex) vs traditional session-based markets
Built-in detection of problematic timeframe combinations with optional MTF cloud fetching for accuracy
Automatic notifications when future projections are unavailable due to MTF constraints
4. Tenkan & Kijun Range Windows
Visual range windows that display the exact high/low range used for Tenkan and Kijun calculations
Optional High/Low markers placed at the exact bars they occur
Optional countdown labels show how many bars remain until the current High/Low expires from the rolling window
Range windows scale up and down dynamically to match display timeframe
5. Comprehensive Alert Suite
Built-in alerts for all major Ichimoku events: TK crosses, E2E entires, Kumo breakouts, etc.
All alerts are cloud-aware and displacement-correct.
How It Works
The indicator uses the traditional Donchian channel method to calculate Ichimoku components, then extends this logic forward by simulating future price action within the calculation windows (no new highs or lows). This creates a forward-looking projection of where support and resistance zones will form.
The range display feature helps traders understand why the lines are where they are by showing the exact high/low points and countdown timers for when these points will expire from the calculation.
Who This Indicator Is For:
Ichimoku traders who want future-aware context
Multi-timeframe analysts seeking correctly aligned clouds
Traders who want to understand Tenkan/Kijun mechanics
Users who need precision without manual recalculation
Notes:
Maximum 500 drawing objects limit managed automatically
Due to Pinescript/TradingView limitations, future Tenkan/Kijun line width is only modifiable in the source code.
Indikator Pine Script®