Fractal Composite Ribbon V2.1Added alerts when L1 fast or L2 med-fast pop out of grey hysteresis state into red or green. These new alerts do not require being in shaded overbought/oversold zones so they're better for catching continuation moves. Thanks to fbatistat for the suggestion.
Also exposed the "Cross Hysteresis" parameter for the width of ambiguous grey "slack" before lead lines push into red or green.
Fractaldeviationbands

Fractal Composites Ribbon (V2)Compresses 8 fractal oscillator timescales into a ribbon of up to 5 composite lines.
This is a smoother version of the original Fractal Composite with alerts on reversals in the overbought/oversold zones.
Fractal Composites normalize and 'cartoonize' the price chart to fit and bounce between statistically-defined overbought and oversold zones. Each lines resembles the shape of the price wave on a different time/size scale, with some distortion as the size of price movement fluctuates. Conceptually, reaching the overbought/oversold zone corresponds to price reaching a ribbon of Bollinger bands, though our 'band statistics' are much smoother and more mathematically sophisticated than standard Bollinger.
Because markets have similar fractal behavior across all timescales, this indicator applies to any timescale, from 1 minute to 1 hour or 1 day. You shouldn't really need to futz with the numerical parameters -- the most important choice is your chart timescale for how fast you want to trade. A faster timescale will show you more dotted reversals in the overbought/oversold zones to trade. The 'Show...' checkboxes let you choose how many composite lines, lag lines, and crosses to see. Information overload? Or a reminder that any single indicator embeds many assumptions about time and price scale in its signal...

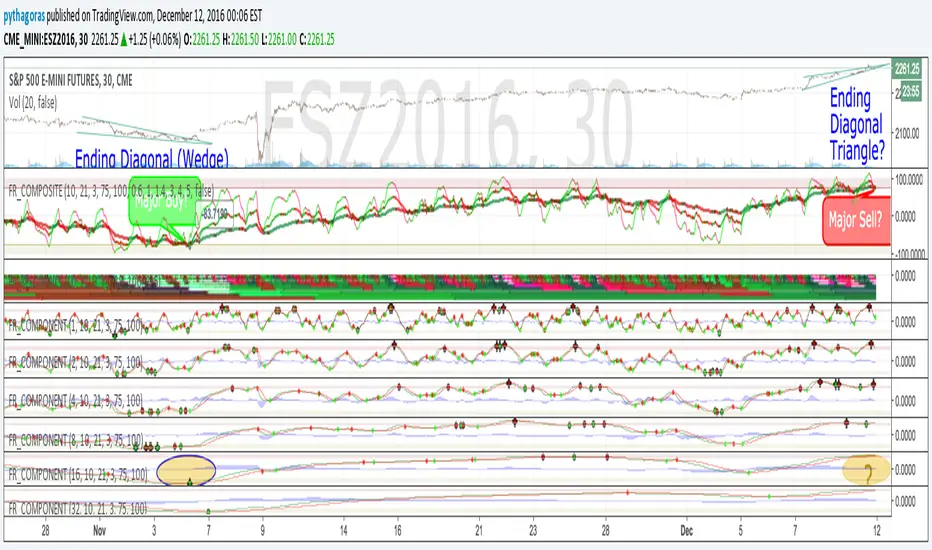
Fractal Resonance CompositeFractal Resonance Composite compresses 8 timescales of stochastic oscillators into just 3 color-coded composite lines: fast, medium and slow. Fast emphasizes the shorter timescale oscillators, medium considers all 8 timescales evenly, and slow emphasizes the longer timeframe oscillators. The composite lines indicate how overbought/sold the market is relative to the size of its recent movements. Major buys occur when all three composites enter the Oversold (green shaded) range and turn up, and major sells when all three reach the Overbought (red shaded) range and turn down. The fast line's quicker reversals and exaggerated alternations on smaller price moves makes it more fit for scalping. Notice the fast and medium lines tend to snap back toward the slow line like stretched rubber bands.
As is particularly apparent in the slow line, the nifty mathematics of the compositing process reconstruct the topology (peaks and valleys) of the underlying price curve in a smoothly distorted "cartoon" form that has a very useful property: the composite lines are confined to +-100% Extreme Overbought/sold oscillatory ranges. (By definition, only extremely rare "parabolic" moves can push all 3 composites beyond +-100%). If we knew that price would always stay confined to a certain range, trading would be much easier, no? Always buy the bottom of the range and sell the top!
How it works
To understand what's behind this nifty property, consider the mathematics of LazyBear's WaveTrend port .
The formula is fairly simple as indicators go yet statistically fundamental in a way that suggests it should have been the grandfather of all market stochastic oscillators. It's just a running average of the ratio:
(price's current deviation from it's mean)
-----------------------------------------------------------
(running average of absolute |price deviation from the mean| )
In formal statistics notation this is written:
E{ (X - E{X}) / E{|X-E{X}|} }
Where X is the price random variable and E{} the averaging or Expectation operator, implemented in this oscillator as exponential moving averages.
Conceptually, the denominator measures and normalizes by the typical size of recent price moves. This normalization process is what stretches or compresses the local price movements such that the whole composite curve can stay within the oscillatory range.
Attributes
The default fast=.6, medium=1, slow=1.4 compositing factors give each line visually distinct behavior, but can be tweaked to emphasize different oscillator "speeds".
Particular lines can be disabled by setting their line width to 0.
Acc/DistAMA with FRACTAL DEVIATION BANDS by @XeL_ArjonaACCUMULATION/DISTRIBUTION ADAPTIVE MOVING AVERAGE with FRACTAL DEVIATION BANDS
Ver. 2.5 @ 16.09.2015
By Ricardo M Arjona @XeL_Arjona
DISCLAIMER:
The Following indicator/code IS NOT intended to be a formal investment advice or recommendation by the
author, nor should be construed as such. Users will be fully responsible by their use regarding their own trading vehicles/assets.
The embedded code and ideas within this work are FREELY AND PUBLICLY available on the Web for NON LUCRATIVE ACTIVITIES and must remain as is.
Pine Script code MOD's and adaptations by @XeL_Arjona with special mention in regard of:
Buy (Bull) and Sell (Bear) "Power Balance Algorithm" by:
Stocks & Commodities V. 21:10 (68-72): "Bull And Bear Balance Indicator by Vadim Gimelfarb"
Fractal Deviation Bands by @XeL_Arjona.
Color Cloud Fill by @ChrisMoody
CHANGE LOG:
Following a "Fractal Approach" now the lookback window is hardcode correlated with a given timeframe. (Default @ 126 days as Half a Year / 252 bars)
Clean and speed up of Adaptive Moving Average Algo.
Fractal Deviation Band Cloud coloring smoothed.
>
ALL NEW IDEAS OR MODIFICATIONS to these indicator(s) are Welcome in favor to deploy a better and more accurate readings. I will be very glad to be notified at Twitter or TradingVew accounts at: @XeL_Arjona
Any important addition to this work MUST REMAIN PUBLIC by means of CreativeCommons CC & TradingView. Copyright 2015
EMA & SMA with FRACTAL DEVIATION BANDS by @XeL_ArjonaEMA & SMA with FRACTAL DEVIATION BANDS
Ver. 1.0.25.08.2015
By Ricardo M Arjona @XeL_Arjona
DISCLAIMER:
DISCLAIMER:
The Following indicator/code IS NOT intended to be a formal investment advice or recommendation by the author, nor should be construed as such. Users will be fully responsible by their use regarding their own trading vehicles/assets. The embedded code and ideas within this work are FREELY AND PUBLICLY available on the Web for NON LUCRATIVE ACTIVITIES and must remain as is.
WHAT IS THIS?
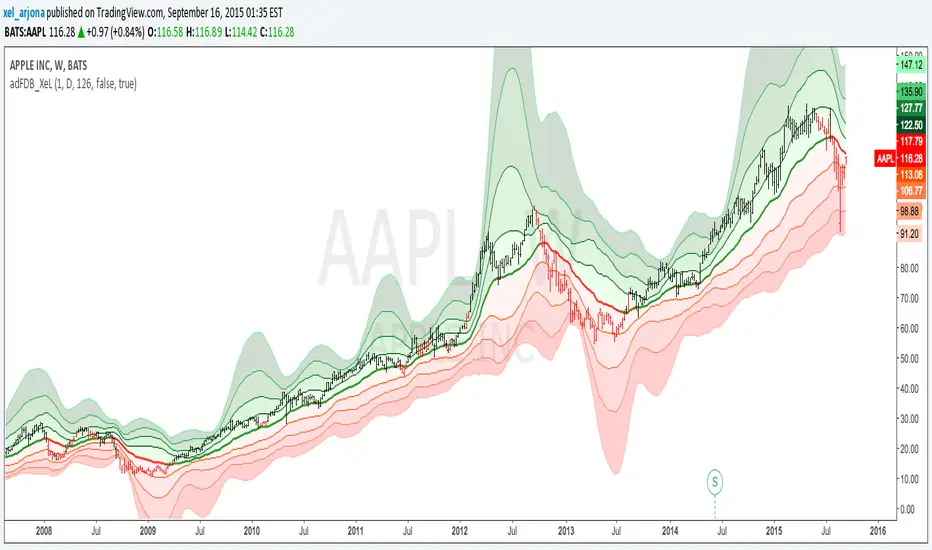
This is the adaptation of the FRACTAL DEVIATION BANDS to be used on Traditional Moving Averages (Simple & Exponential).
ALL NEW IDEAS OR MODIFICATIONS to these indicator(s) are Welcome in favor to deploy a better and more accurate readings. I will be very glad to be notified at Twitter or TradingVew accounts at: @XeL_Arjona
Any important addition to this work MUST REMAIN PUBLIC by means of CreativeCommons CC & TradingView.
2015

McGinley Dynamic with FRACTAL DEVIATION BANDS by @XeL_ArjonaMcGINLEY DYNAMIC with FRACTAL DEVIATION BANDS.
Ver. 1.0.beta.25.08.2015
By Ricardo M Arjona @XeL_Arjona
DISCLAIMER
The Following indicator/code IS NOT intended to be a formal investment advice or recommendation by the author, nor should be construed as such. Users will be fully responsible by their use regarding their own trading vehicles/assets. -- The embedded code and ideas within this work are FREELY AND PUBLICLY available on the Web for NON LUCRATIVE ACTIVITIES and must remain as is.
WHAT IS THIS?
This is my first adaptation of the FRACTAL DEVIATION BANDS to the "McGinley Dynamic Line". Be advised that the nature of this line tend to need some adjustments at the "Smooth Factor" if you see a flat line with tiny values.
Pine Script code MOD's and adaptations by @XeL_Arjona with special mention in regard of:
Morphic Numbers: (PHI & Plastic) Pine Script adaptation from it's algebraic generation formulas by @XeL_Arjona.
FRACTAL DEVIATION BANDS: main idea by @XeL_Arjona
ALL NEW IDEAS OR MODIFICATIONS to these indicator(s) are Welcome in favor to deploy a better and more accurate readings. I will be very glad to be notified at Twitter or TradingVew accounts at: @XeL_Arjona. Any important addition to this work MUST REMAIN PUBLIC by means of CreativeCommons CC & TradingView.
2015
Acc/Dist. Cloud with Fractal Deviation Bands by @XeL_ArjonaACCUMULATION / DISTRIBUTION CLOUD with MORPHIC DEVIATION BANDS
Ver. 2.0.beta.23:08:2015
by Ricardo M. Arjona @XeL_Arjona
DISCLAIMER
The Following indicator/code IS NOT intended to be a formal investment advice or recommendation by the author, nor should be construed as such. Users will be fully responsible by their use regarding their own trading vehicles/assets.
The embedded code and ideas within this work are FREELY AND PUBLICLY available on the Web for NON LUCRATIVE ACTIVITIES and must remain as is.
Pine Script code MOD's and adaptations by @XeL_Arjona with special mention in regard of:
Buy (Bull) and Sell (Bear) "Power Balance Algorithm by Vadim Gimelfarb published at Stocks & Commodities V. 21:10 (68-72).
Custom Weighting Coefficient for Exponential Moving Average (nEMA) adaptation work by @XeL_Arjona with contribution help from @RicardoSantos at TradingView @pinescript chat room.
Morphic Numbers (PHI & Plastic) Pine Script adaptation from it's algebraic generation formulas by @XeL_Arjona
Fractal Deviation Bands idea by @XeL_Arjona
CHANGE LOG:
ACCUMULATION / DISTRIBUTION CLOUD: I decided to change it's name from the Buy to Sell Pressure. The code is essentially the same as older versions and they are the center core (VORTEX?) of all derived New stuff which are:
MORPHIC NUMBERS: The "Golden Ratio" expressed by the result of the constant "PHI" and the newer and same in characteristics "Plastic Number" expressed as "PN". For more information about this regard take a look at: HERE!
CUSTOM(K) EXPONENTIAL MOVING AVERAGE: Some code has cleaned from last version to include as custom function the nEMA , which use an additional input (K) to customise the way the "exponentially" is weighted from the custom array. For the purpose of this indicator, I implement a volatility algorithm using the Average True Range of last 9 periods multiplied by the morphic number used in the fractal study. (Golden Ratio as default) The result is very similar in response to classic EMA but tend to accelerate or decelerate much more responsive with wider bars presented in trending average.
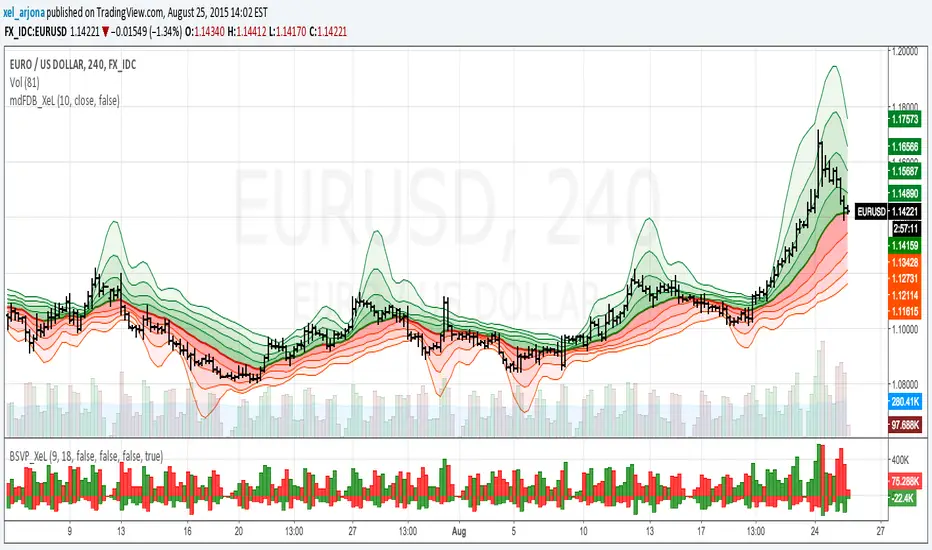
FRACTAL DEVIATION BANDS: The main idea is based on the so useful Standard Deviation process to create Bands in favor of a multiplier (As John Bollinger used in it's own bands) from a custom array, in which for this case is the "Volume Pressure Moving Average" as the main Vortex for the "Fractallitly", so then apply as many "Child bands" using the older one as the new calculation array using the same morphic constant as multiplier (Like Fibonacci but with other approach rather than %ratios). Results are AWSOME! Market tend to accelerate or decelerate their Trend in favor of a Fractal approach. This bands try to catch them, so please experiment and feedback me your own observations.
EXTERNAL TICKER FOR VOLUME DATA: I Added a way to input volume data for this kind of study from external tickers. This is just a quicky-hack given that currently TradingView is not adding Volume to their Indexes so; maybe this is temporary by now. It seems that this part of the code is conflicting with intraday timeframes, so You are advised.
This CODE is versioned as BETA FOR TESTING PROPOSES. By now TradingView Admins are changing lot's of things internally, so maybe this could conflict with correct rendering of this study with special tickers or timeframes. I will try to code by itself just the core parts of this study in order to use them at discretion in other areas. ALL NEW IDEAS OR MODIFICATIONS to these indicator(s) are Welcome in favor to deploy a better and more accurate readings. I will be very glad to be notified at Twitter or TradingView accounts at: @XeL_Arjona
