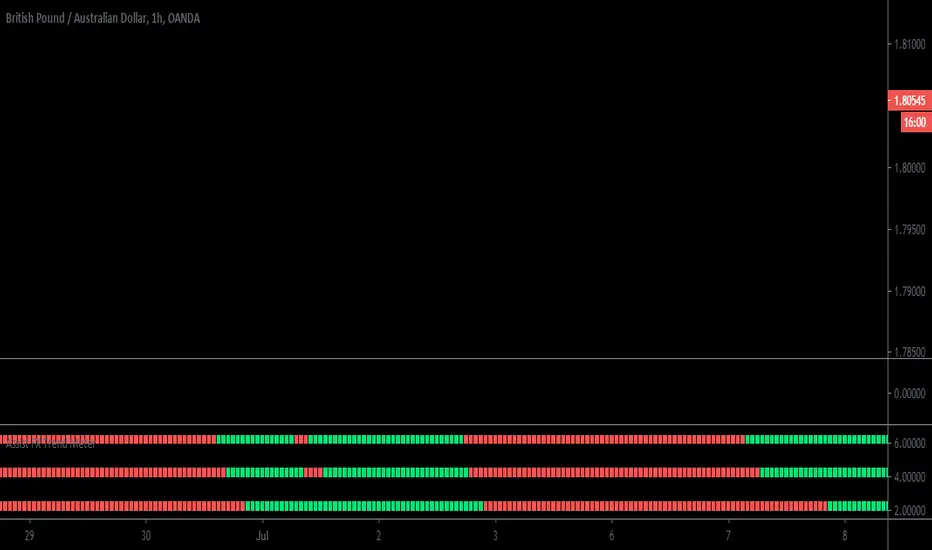
Assist FX Trend MeterWelcome to the Assist FX Trend Meter.
This trend meter is our own script that is based off Multiple Timezone Analysis and a Momentum Squeeze.
The Way the trend meter works is as follows it is based off the 1 Hour, 4 Hour and Daily time zones each line represents them times, If the market is "Bullish" you will get green lines , If the market is "Bearish" you will get red lines.
This you can use with other confluences, But most importantly helps you identify without switching between time zones which way the market is moving at the time you are looking at your chart.
If you have any questions or would like to use this script please send us a private message.
Thank you
Forextrading
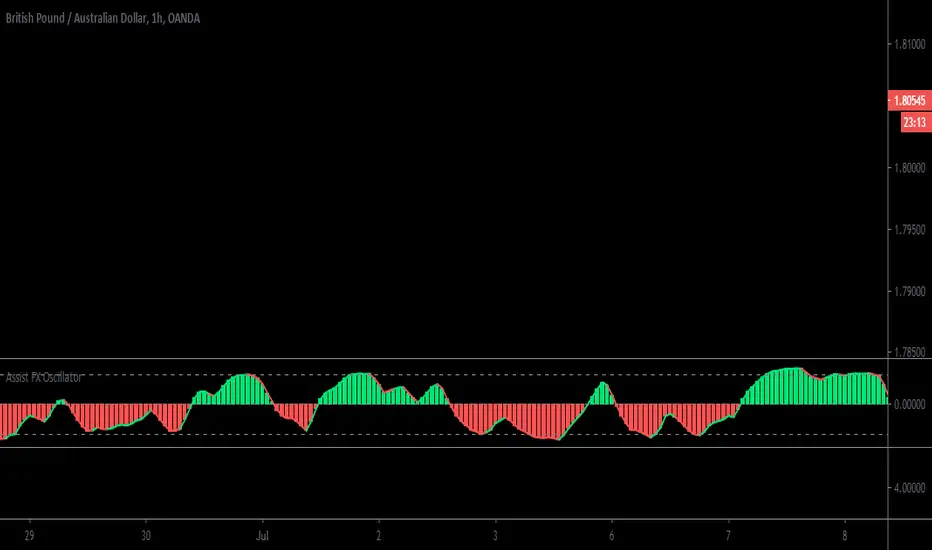
Assist FX OscillatorWelcome to The Assist FX Oscillator
This is our very own Oscillator that has been developed to Incorporate Trend Movement in the market and Volume Combined.
How do we know how to read the Oscillator?
When the Oscillator Turns "Green" this Suggests there is a potential Bullish Trend happening and Volume in the market , If it goes "Red" this would suggest the opposite and look Bearish.
We suggest you use this with other confluences before placing any trade.
If you have any questions or you would like to use this script please send us a private message.
Thank you very much.
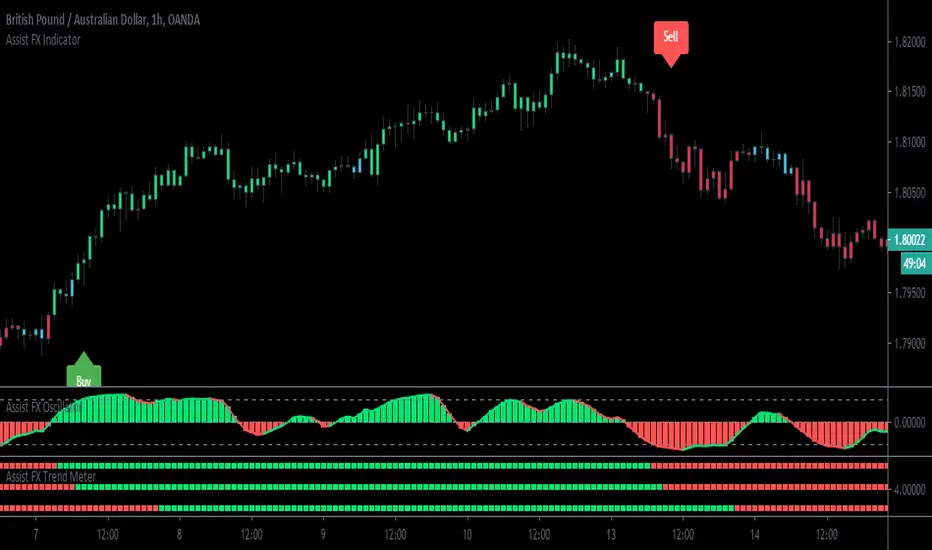
Assist FX IndicatorWelcome to The Assist FX Indicator/Toolkit
This is a Strategy we have been working on for a long time now and were ready for Release.
How Does it work you ask?
Our strategy will help you identify the current trend in the market and based off the market movement and 3 other Confluences will Place "Buy" and "Sell" Signals on your Chart - Just to note for File this signals to Not Repaint.
This takes away most of the Technical Analysis for you , Yes we Suggest you also use your own Knowledge and Influence before placing your trades.
When all criteria is met in the code our signals appear, You will get a Red Sell signal for if the market is looking to go bearish and if you get a green buy signal the market is looking to go Bullish.
If you have any other questions relating to the indicator or you would like access , Please do not hesitate to contact us via private message and we will be able to assist you
Have a great day!
PpSignal Variable Move Average V 3.0A Variable Moving Average is an exponential moving average that automatically adjusts the smoothing weight based on the volatility of the data series. The more volatile the data is, the more weight is given to the more recent values. The Variable Moving Average solves a problem with most moving averages.
Blue: Buy
Red: Sell
Gray: Indecision hold

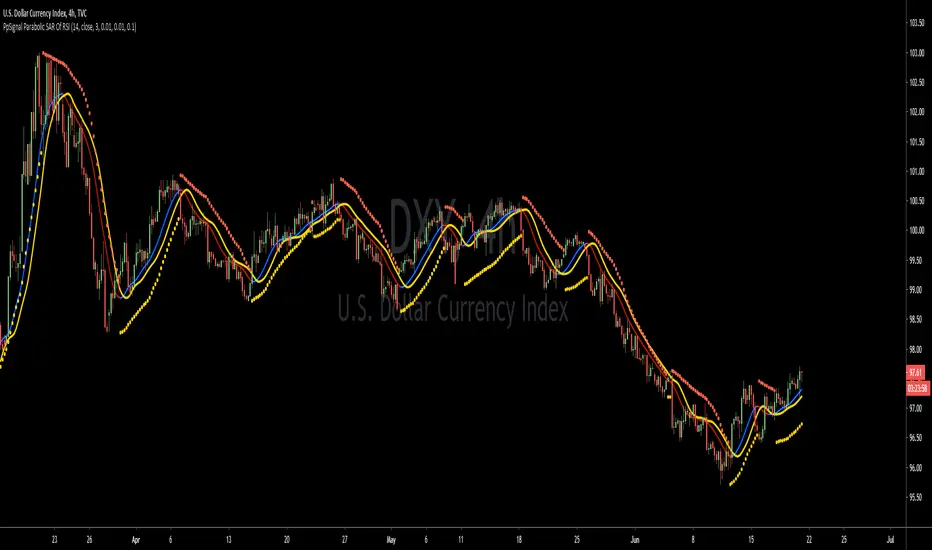
PpSignal Parabolic SAR Of RSI OscillatorThis indicator is parabolic zar of rsi oscillator style .
Buy when the rsi on the char is blue and psar is gold color.
sell when the rsi on the char is red and psar is orange.

PpSignal Parabolic SAR Of RSIThis indicator is parabolic zar of rsi.
Buy when the rsi on the char is blue and psar is gold color.
sell when the rsi on the char is red an psar is orange.
PpSignal Weis Volume & Volume in Bar V2.20This is an Advanced Weis Wave indicator which is based on Richard D. Wyckoff theory. It works in all time periods, range bar and tick bar charts and it can be applied to any market. The new Autowaves feature eliminates changing the parameters when switching time frames.
This indicator is adding the volumes of the corresponding price waves and draws a cumulative histogram. Each price wave is moving in a specific direction up or down until it reverses. In order for the indicator wave to reverse in the opposite direction, the price should exceed the number of points (pips*10) set in the indicator parameters. Therefore, the last wave repaints but the theory behind this trading method is forecasting where the market will go by reading mainly the previous waves.
The volume of the wave together with pip distance that the price has covered and the number of bars are displayed at the end of this wave. Speed Index is a new function noting the speed of the wave and can be displayed on the chart (the smaller this number is the faster the wave is and the larger this number is the slower the wave is)
Furthermore, an Alert (popup, email, push, sound) can be setup if the cumulative volume of the current wave exceeds a certain number specified in the parameters. An Alert can also be setup if Speed Index exceeds a specific value and/or is below a specific value.
Buy when the Weiss is aqua and sell when the Weiss is orange

Musashi-Hidden-Wave Trading SystemThis Indicator is a full trading system that offers setups with Entries and Targets and Trade Management. This indicator is very accurate because it uses advanced setup detection and filtering logic.
The setup is triggered if the price passes the blue dash. Do not enter the trade unless price passes the blue dash. Each setup has 3 possible targets, which are dashes colored green for longs and red for shorts.
You can use the baseline (which is a trend-line that is either green for bullish or red for bearish ) to manage the trade. You should only enter long trades if the trend-line is green, and only enter short trades if the trend-line is red. One strategy would be if you enter a trade long, and reach the first target, you can take some profits, but still let the some of the position run, where a bar closing beyond the baseline or breaks a prior opposite pivot, would stop out your remaining position.
To summarize:
Blue Dash = Entry Trigger
Green Dashes = Long Targets (3 of them, for different price targets: target 1, 2 and 3)
Red Dashes = Short Targets (3 of them, for different price targets: target 1, 2 and 3)
The great thing about this indicator is that its universal, there are no settings necessary -- just put it on the chart and it finds high probability setups and paints it on the chart as they occur. There is NO Repainting with this indicator.
Of course, you can add other indicators if you wish, and even add this indicator to your existing trading system.
Again, this indicator does NOT repaint.
Once a setup is found, the indicator draws the entry trigger price and the targets at the setup bar close.
Setup Alerts are fully supported, via email, sms , and desktop notification.
*If you wish to license this indicator, please contact me via private message for details regarding access. Thank you.
LEGAL STUFF:
Risk Disclosure
Futures , forex, stock, crypto and derivative trading contains substantial risk and is not for every investor. An investor could potentially lose all or more than the initial investment. Risk capital is money that can be lost without jeopardizing ones’ financial security or life style. Only risk capital should be used for trading and only those with sufficient risk capital should consider trading. Past performance is not necessarily indicative of future results
Hypothetical Performance Disclosure
Hypothetical performance results have many inherent limitations, some of which are described below. no representation is being made that any account will or is likely to achieve profits or losses similar to those shown; in fact, there are frequently sharp differences between hypothetical performance results and the actual results subsequently achieved by any particular trading program. One of the limitations of hypothetical performance results is that they are generally prepared with the benefit of hindsight. In addition, hypothetical trading does not involve financial risk, and no hypothetical trading record can completely account for the impact of financial risk of actual trading. for example, the ability to withstand losses or to adhere to a particular trading program in spite of trading losses are material points which can also adversely affect actual trading results. There are numerous other factors related to the markets in general or to the implementation of any specific trading program which cannot be fully accounted for in the preparation of hypothetical performance results and all which can adversely affect trading results

Theft Indicator - Pip GainerWhat is our indicator?
Theft Indicator - Pip Gainer is one of our recent published scripts that shows price action on a certain period of time (We Use a modified version of ATR). We take pride in enabling trading to become easier for the experienced and the non-experienced traders around the globe. Buy & Sell alerts will be fired once a condition in our algo is met.
Does it Repaint?
Our indicator does NOT re-paint. Although while setting an alert it may pop up the repaint alert, please take into consideration that once a signal is fired on a "CLOSED BAR", our signal will never disappear, they do not repaint.
What Markets is it usable with?
This version is dedicated to FOREX markets, we encourage using it for low timeframes starting the 3 minute to the 15 minute timeframe. WE RECOMMEND USING THIS IN THE FOREX MARKET, ESPECIALLY WITH CURRENCY PAIRS.
How to use:
Simple plug and play it to your chart, in addition to a few other indicators we will recommend to you (we still have not published them yet), and this will confirm your trades. You can also connect TV alerts with a bot and let it run. Please be aware that SLIPPAGE time is important, If you run a bot on this indicator you HAVE to know that the buy/sell price will be on the bar AFTER the Candle close (For example: the BUY/SELL alert is on a candle, the buy/sell your bot or you will execute WILL be in the following candle depending on your trading system. We advise you to not leave the bot to trade on its own, you have to monitor and have a specific syntax that we will help you with creating according to your trading style.
How are the Buy/Sell Alerts fired?
We use the simple ATR (Average True Range) indicator. However we have modified the indicator to serve our trading system. Check below for a definition of what ATR is:
What is Average True Range - ATR?
The average true range (ATR) is a technical analysis indicator that measures market volatility by decomposing the entire range of an asset price for that period. Specifically, ATR is a measure of volatility introduced by market technician J. Welles Wilder Jr. The true range indicator is taken as the greatest of the following: current high less the current low; the absolute value of the current high less the previous close; and the absolute value of the current low less the previous close. The average true range is then a moving average, generally using 14 days, of the true ranges.
Why is our indicator special and different from the normal ATR indicators?
We have modified the mathematical equation and changed it slightly to give more accurate signals, we do not promise all trades are profitable, the use of this indicator is up to your own judgement and liability. We believe that we have an indicator like no other ATR.
P.S: This is not financial advice, we are just sharing our indicator that we know has good results, and it will take time for people in -ve profiles to recover losses and for the profiting to be more profitable. We use a specific trading method that only works with it
You can contact me for more information about the indicator, Goodluck :)

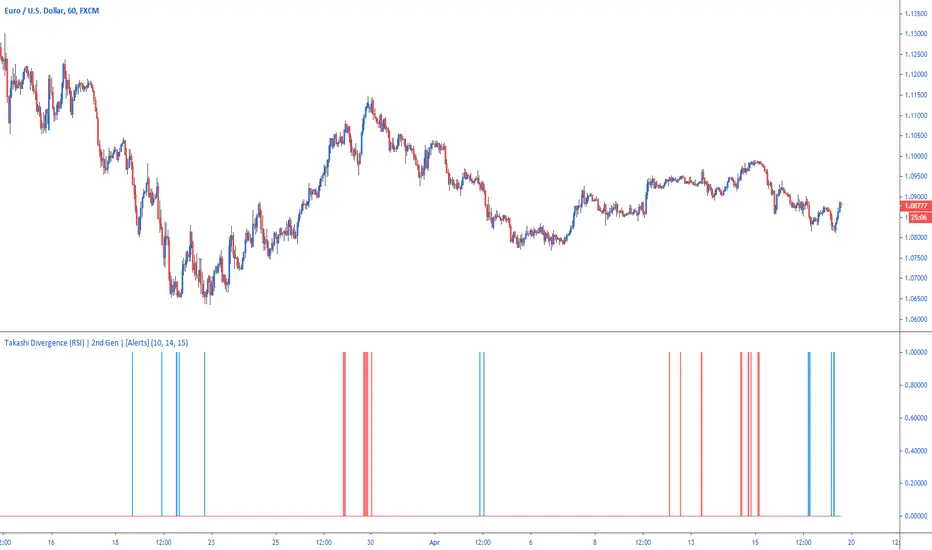
Takashi Divergence (RSI) | 2nd Gen | [Alerts]Easily highlight positive or negative divergence between price movement and RSI with Takashi-powered Divergence analysis.
Divergence strategy signals a potential reversal point because directional momentum does not confirm price. A bullish divergence occurs when the underlying market makes a lower low and RSI forms a higher low: RSI does not confirm the lower low and this shows strengthening momentum. A bearish divergence forms when the market records a higher high and RSI forms a lower high: RSI does not confirm the new high and this shows weakening momentum.
Inputs
Divergence Sensitivity
Float input. Sets a threshold after when the RSI divergence is triggered.
RSI Length
Integer input. The default setting used by most traders for the RSI is 14. That means that the indicator will go back 14 periods or time frames based on the chart being used (14 days on a Daily chart , 14 hours on an hourly chart and so forth) and make its calculation based on that.
Cross Distance
Integer input. Value from RSI that above or below 50 that classifies bullish or bearish levels. By default 15, that means the script will be checking for positive divergence when RSI is below 35 (50-15) and negative divergence when RSI is above 75 (50+15).
Use High & Low
Bool input. If true uses high and low values as RSI source.
To get access to this and other scripts check links below.
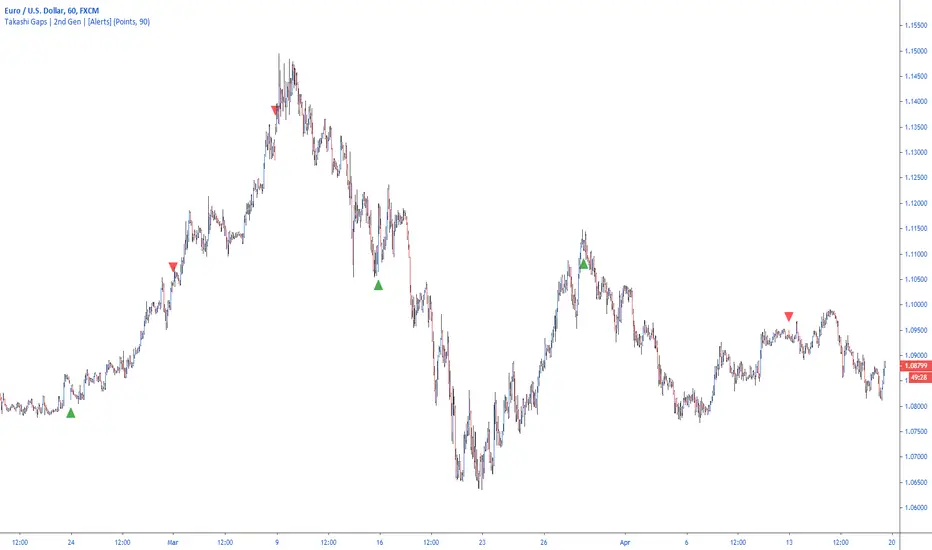
Takashi Gaps | 2nd Gen | [Alerts]Spot gaps between bars and benefit from the correction of the market as the price restores its position.
Inputs
Value In
Options input. Defines if the gap between bars will be checked by Points or Percent.
Gap Size
Float input. Value to trigger a signal if the gap between bars is bigger than.
To get access to this and other scripts check links below.
PpSignal drake delay oscillator GritasIt is a technique, when the drake oscillator moving averages (Drake Daly Statocastico) cross up you must buy and the histogram is painted in a green color .... when the drake oscillator crosses down and the histogram is painted red you must to sell.

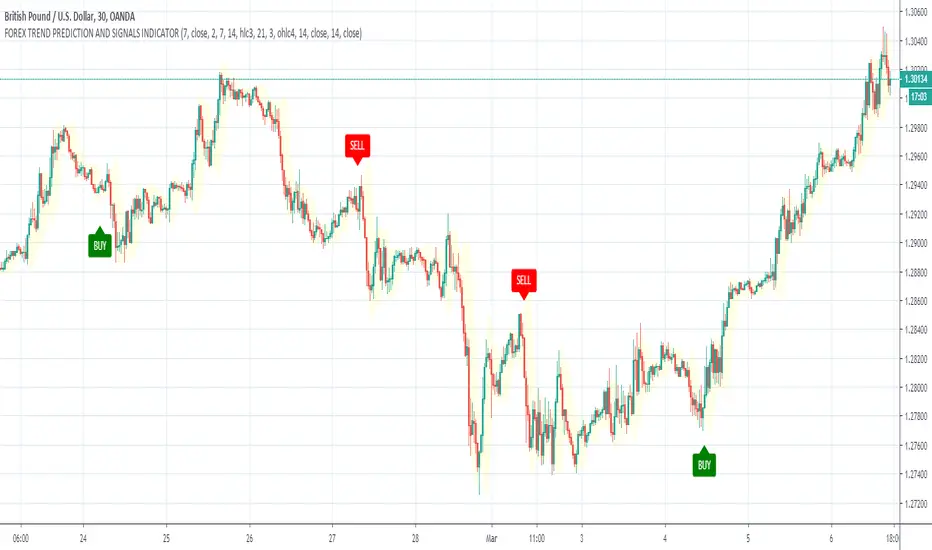
GBPUSD TREND DETECTION AND BUY/SELL ARROW SIGNALS INDICATORGBPUSD TREND DETECTION AND BUY/SELL ARROW SIGNALS INDICATOR
This script developed for active forex traders and based on Trend Analysis Indicators.
It used combination of Moving Averages, Volatility Indicator and Fractals and try to
detect reversal points of trends and generates buy/sell signals.
Works for all Forex currency pairs and time frames: 15MIN, 1H, 1DAY.
Can be used for swing trading and trend trading.
Advantage of this script indicator that all noise is filtered and signals detects long trends.
This make it useful as stand-alone trading strategy indicator or in combination with other indicators,
It is useful for day and intraday forex traders.
Main features of this indicator are:
✅ Forex Trend Reverse Points
✅ Forex breakout indicator
✅ Forex trend Signals
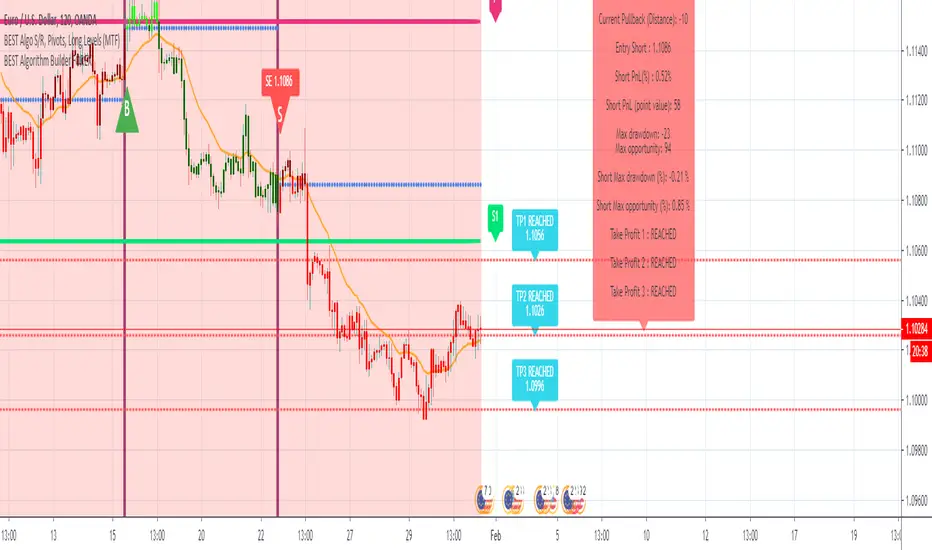
BEST Algorithm Builder FOREXHello traders 👋
I. 💎 SCRIPTS ACCESS AND TRIALS 💎
1. Every trial request access has to be done through my website.
2. My website URL is in this script signature at the very bottom (you'll have to scroll down a bit and going past the long description) and in my profile status available here: Daveatt
3. Many video tutorials explaining clearly how all our indicators work are available on our website > guides section and also on Discord + Youtube
4. You may also contact me directly for more information regarding the trading method included in the indicator or how to access it
II. Forewords
This indicator is for the Intraday FOREX traders looking for fixed entries based on our proprietary trading method.
We've been working on it for months and releasing now for our subscribers.
We designed this framework for FOREX major/minor/exotic pairs.
III. Optimized system for lowering risk/capturing most of the opportunities
We worked hard on reducing the risk as much as we could.
The built-in hard-exit (also called invalidation) system does a huge job in exiting a position way before a Stop Loss will get hit
EUR/USD
USD/CAD
IV. Trade Manager and compatible with dynamic alerts
It includes :
- our proprietary method with fixed entries
- a hard exit system (built-in stop-loss)
- multiple options for user-defined stop-loss/take-profit settings (price value, distance in pips, percentage, trailing, ...)
- 🔔 Compatible with dynamic alerts 🔔
Dynamic alerts are bringing automated trading to a whole new level. The third-party solutions capturing TradingView alerts are able to use them.
- Algorithmic Supports and Resistances used as safeguards and take profit zones
Final words
We made it as simple as we could (to be honest it's a very simple system for the end-user) - even with several hundreds of calculations in the indicator.
Please hit me up for any questions/feedbacks/comments
Become the BEST trader you deserve to be
Dave
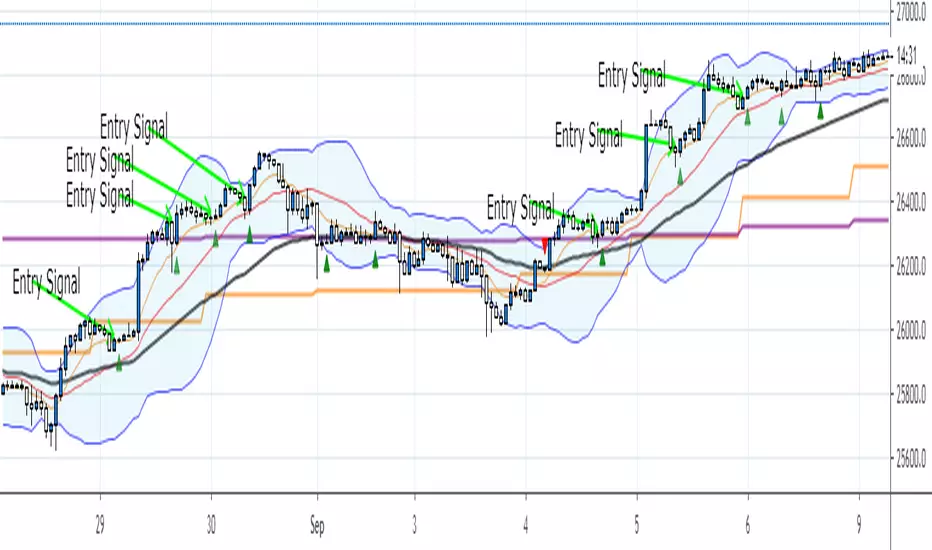
A.M E Trend
Hi Trading View,
This is my Custom Indicator and Strategy that i am currently using. This is a Trend following indicator that plots entries on certain market criteria.
The indicator will Plot Bollinger Bands and also 2 EMA's on the trading time frame and also 2 EMA's on the Daily time frame for quick view on overall market Direction.
This indicator is looking for:
Market Direction
Pullbacks to EMA's
Price Action
Lows and Highs
Trend continuation
Once these conditions are met the indicator will place signals onto the chart in the direction of the trade.
This indicator will look for both Long and Short Signals.
This indicator can be used on Multiple Time Frames and currency pairs.
I use this indicator mainly on the 15M and 1H chart.
You are also able to set alerts for the signals so if you are not near the charts all the time you will get a notification pop up on the trading view app
User discretion should be used while using this indicator, I look for rejection and reversal candles such as a Doji, Long Wick Bar or Engulfing.
Trading Rules:
Stop loss below or above previous low or high of signal bar.
Look for a 1:1 or 1:1.5 risk reward (some trades go way further).
Have Fun and Enjoy.
Ash
NewsTrader from Boris SchlossbergThis forex news trading indicator helps you to pick the highest probability post-news trades with the best possible entries. It is designed to trade major events like Central Bank rate decisions, Non-Farm payrolls, and other economic data.
ZipTraderHeatMapThis is a heat map to identify swing trades. This map forms the cornerstone of BKForex swing trades. When combined with fundamental drivers, it helps to identify the most attractive trading opportunities across the majors and crosses.

WBCC Strategy (1hour)RU
Нами было принято решение о возможности предоставления доступа к нашему индикатору - WBCC Strategy, он подходит для любой биржи и видов монет и акций.
Примеры:
1) Золото - Форекс -
2) Биткоин - Bitmex -
3) MLT - Binance -
Доступен данный индикатор будет с 15 августа 2019 (мы предоставляем возможность его использовать, путем выдачи ограниченного доступа - для вашего персонального аккаунта на платформе - ru.tradingview.com ,
Он будет доступен у Вас в этом разделе: prnt.sc)
Со всеми вопросами писать сюда Telegram: @wbcc_club
ENG
We decided to provide access to our indicator - WBCC Strategy, which is suitable for any exchange and types of coins and shares.
Examples:
1) Gold - Forex -
2) Bitcoin - Bitmex -
3) MLT - Binance -
This indicator will be available from August 15, 2019 (we provide the opportunity to use it, by issuing a limited access - for your personal account on the platform - ru.tradingview.com ,
It will be available from you in this section: prnt.sc)
With all the questions to write here Telegram: @wbcc_club

BOSS Smooth Stochastic-RSI And RSI Oscillators With Alerts THE BEST FOREX, BINARY OPTIONS, STOCK AND CRYPTO INDICATORS FOR TRADINGVIEW.COM
Our Smooth Stochastic RSI indicator and our RSI indicator all combined in one!
BACKGROUND AND BAR COLOR
Green=BULLISH
Yellow= NEUTRAL/TRANSITIONAL
Red= BEARISH
ALERTS
GET ALERTS FOR BULLISH AND BEARISH CROSSOVERS ON STOCHASTIC RSI
GET ALERTS WHEN RSI LINE IS GREEN AND RED

Concurrency Meter ProEvery good forex system has the following basic components:
Ability to recognize the trend direction.
Ability to identify the strength of the trend and answer the basic question
Is the market trending or is it in a range?
Ability to identify safe entry points that will give a perfect risk to reward (RR) ratio on every position.
How Advanced Currency Meter Helps you Achieve These Components
PpSignal Currency Meter Pro is a tool that measures the strength between individual currencies in a pair.

BestFollowTrendBest for beggining traders.. to follow TRENDS... and Remember.. TREND IS YOURE FRIEND !!!

Scalp TraderA nice strategie for the beginners traders..in order to help see better how to folllow the trend.. because trend is youre friend :)
For access ----> private message.

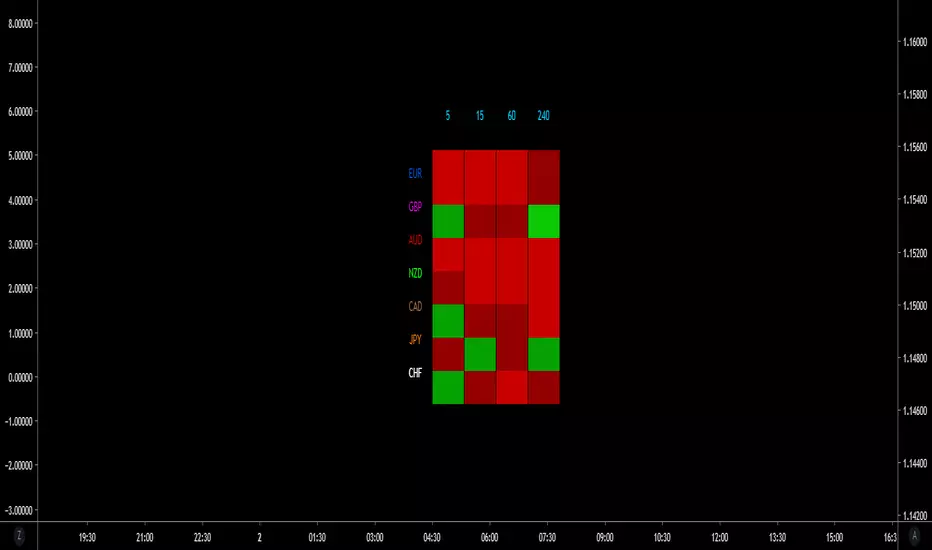
Heat Map Forex - Intraday
4 intraday time frames for a custom strength indication by color.
3 positive and 3 negative colors.
7 symbols, limited by the number of plots on the screen (64). All symbols against USD.
Works well with FX Percentage Change script.
Trading View also has a FOREX heat map widget, found here .
See Also: