COT3 - Flip Strength Index - Invincible3This indicator uses the TradingView COT library to visualize institutional positioning and potential sentiment or trend shifts. It compares the long% vs short% of commercial and non-commercial traders for both Pair A and Pair B, helping traders identify trend strength, market overextension, and early reversal signals.
🔷 COT RSI
The COT RSI normalizes the net positioning difference between non-commercial and commercial traders over (N=13, 26, and 52)-week periods. It ranges from 0 to 100, highlighting when sentiment is at bullish or bearish extremes.
COT RSI (N)= ((NC - C)−min)/(max-min) x100
🟡 COT Index
The COT Index tracks where the current non-commercial net position lies within its 1-year and 3-year historical range. It reflects institutional accumulation or distribution phases.
Strength represents the magnitude of that positioning bias, visualized through normalized RSI-style metrics.
COT Index (N)= (NC net)/(max-min) x100
🔁 Flip Detection
Flip refers to the crossovers between long% and short%, indicating a change in directional bias among trader groups. When long positions exceed shorts (or vice versa), it signals a possible market flip in sentiment or trend.
For example, Pair B commercial flip is calculated as:
Long% = (Long/Open Interest)×100
Short% = (Short/Open Interest)×100
Flip = Long%−Short%
A bullish flip occurs when long% overtakes short%, and vice versa for a bearish flip. These flips often precede price trend changes or confirm sentiment breakouts.
Flip captures how far current positioning deviates from historical norms — highlighting periods of institutional overconfidence or exhaustion, often leading to significant market turns.
This combination offers a multi-layered edge for identifying when smart money is flipping direction, and whether that flip has strong conviction or is likely to fade.
..........................................................................................................................................................
Flip

Candle Flip System - CFSCandle Flip System - CFS
The Candle Flip System checklist table is a tool designed for traders seeking a structured approach to decision-making. This indicator provides a visual checklist to validate critical conditions before entering a trade. It includes:
1. Previous D1 Candle Analysis:
Displays whether the previous daily candle closed bullish or bearish, indicated by intuitive markers.
2. 4-Hour Alignment Check:
Confirms if the bias of the previous 4-hour candle aligns with the previous daily candle's bias.
Outputs "YES" in green for alignment or "NO" in red for misalignment.
This indicator simplifies multi-timeframe analysis and ensures a systematic evaluation of key trading conditions, enabling traders to make more confident and disciplined decisions.
How to Use:
1. Apply the indicator to your chart.
2. Observe the table displayed in the top-right corner.
3. Use the information to validate your trading strategy before entering a trade.

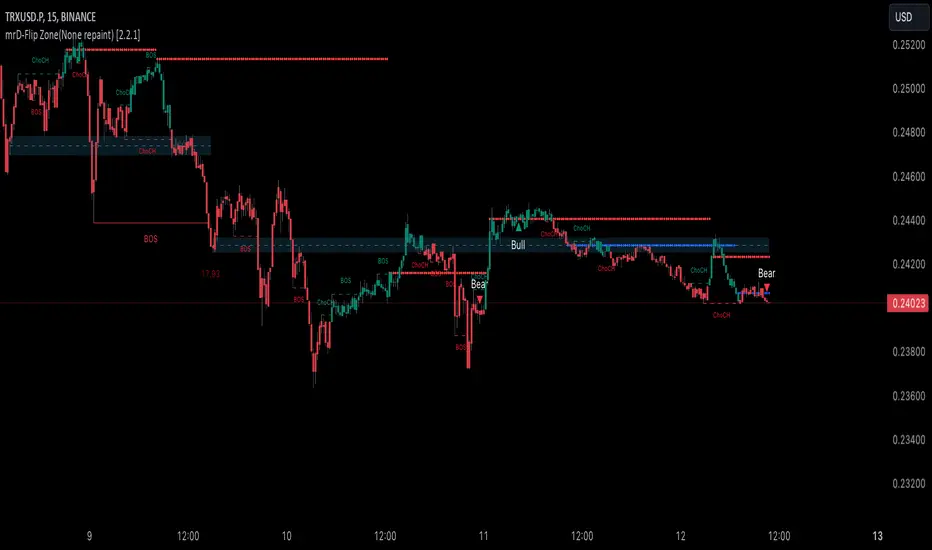
mrD-Flip Zone(None repaint) [1.0]This indicator provides Flips Zones, to easily observe price action and the user can evaluate reversal zones.
This indicator also includes warnings when flip zones appear.
🔶 SETTINGS
- Current-Timeframe: Hide/Show Flips Zones in the current time frame.
- High-Timeframe: Hide/Show Flips Zones in the High time frame.
- Current Timeframe (color): Color Display Flips Zones in the current time frame.
- High Timeframe (color): Color Display Flips Zones in the current time frame.
🔶 The logic is described below:
The main characteristic that this indicator has is that it is possible to identify zones where prices can react.
The second feature that shows the best use of this indicator is that it shows the flips area of the larger timeframe in the current timeframe.
This indicator also acts as support and resistance levels.
This script is based on the function of Pivot High Low.
- New Pivot Low is identify
- New Pivot High is to identify
- New Pivot Low lower previous Pivot Low
- Upper Line of the Flips Zone is the high-price previous Pivot Low
- Lower Line of the Flips Zone is the low-price new Pivot Low
=>Flips box will be marked on the chart in the current time frame and the Flips box in the high time frame
*Special feature: the Flips box order shows different time frames.
🔶 USAGE
The Flips Zones are displayed by the script to provide can price reversal zones.
At Flips Zones, prices can reverse or continue the trend.
The Flips Zones are displayed by the script to provide price can reversal zones.
Once the Flips Zone is formed, the price action could retest. Can expect a price reversal or continue the trend.
The Flip Zones of the higher timeframe are displayed in the current timeframe according to the user's settings.
If the Flip Zones on the current timeframe and the Flip Zones on the higher timeframe overlap, Price can retest and reverse the trend quickly.
The trend can be determined by looking at the price position relative to the flips zone box. Price breaking out of flip zones is a sign of a downtrend, while price breaking above supply is a sign of an uptrend.
Note: This indicator is Non-repaint.
This indicator is great to use in confluence with other indicators or with various candlestick patterns.
Remember, don't make decisions based only on the one-time frame. Check the overall trend of the stock and look at Flip Zone in the high time frame.
🔶General disclaimer:
Trading stocks, futures, forex, options, ETFs, cryptocurrency, or any other financial instrument has huge potential rewards and risks.
You must be aware of the risks and willing to accept them to invest in stocks, futures, forex, options, ETFs, or cryptocurrencies.
Don't trade with money you can't afford to lose.
This is not an offer or an offer to Buy/Sell stocks, futures, Forex, options, ETFs, cryptocurrencies, or any other financial instrument.
Do not represent that any account will or is likely to achieve profit or loss of any kind.
The past performance of any trading system or method is not necessarily indicative of future results.
My Scripts/Indicators/Ideas/Algos/Systems are only for educational purposes!
Ninja Heiken Ashi Flip on PSARThis indicator demonstrates Heiken Ashi Candles (HA) and PSAR settings that have flipped in sequence.
It will show a BUY/SELL signal for the First Flat Bottom/Top HK candle that has flipped on the PSAR.
It will show a BUY 20 Alert for the First Flat BOTTOM HA Candle that has flipped on the PSAR + When the stochastic is AT or BELOW the 20 marker.
It will show a SELL 80 Alert for the First Flat TOP HA Candle that has flipped on the PSAR + When the stochastic is AT or ABOVE the 80 marker.
It is designed to provide a visual demonstration that selected indicators have met certain criteria and is NOT meant to be a trading system or offer trading advice. The indicator offers alert possibilities when the above criteria are met.
Reverse ParityShows the reverse graph of the forex pairs. Includes three exponential moving avarages. Option to show Bollinger bands.
