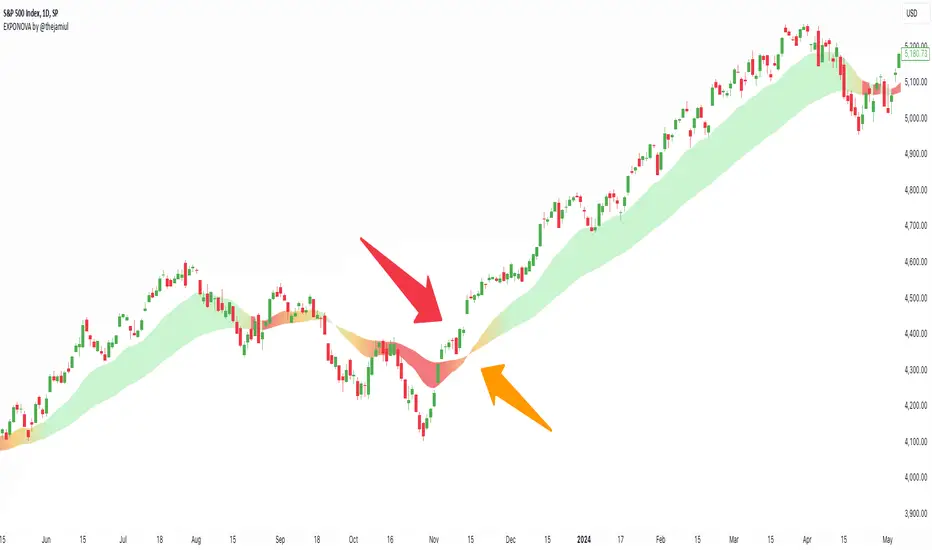
EXPONOVA by @thejamiulEXPONOVA is an advanced EMA-based indicator designed to provide a visually intuitive and actionable representation of market trends. It combines two EMAs (Exponential Moving Averages) with a custom gradient fill to help traders identify trend reversals, strength, and the potential duration of trends.
This indicator uses a gradient color fill between two EMAs—one short-term (20-period) and one longer-term (55-period). The gradient dynamically adjusts based on the proximity and relationship of the closing price to the EMAs, giving traders a unique visual insight into trend momentum and potential exhaustion points.
Key Features:
Dynamic Gradient Fill:
The fill color between the EMAs changes based on the bar's position relative to the longer-term EMA.
A fading gradient visually conveys the strength and duration of the trend. The closer the closing price is to crossing the EMA, the stronger the gradient, making trends easy to spot.
Precision EMA Calculations:
The indicator plots two EMAs (20 and 55) without cluttering the chart, ensuring traders have a clean and informative display.
Ease of Use:
Designed for both novice and advanced traders, this tool is effective in identifying trend reversals and entry/exit points.
Trend Reversal Detection:
Built-in logic identifies bars since the last EMA cross, dynamically adjusting the gradient to signal potential trend changes.
How It Works:
This indicator calculates two EMAs:
EMA 20 (Fast EMA): Tracks short-term price movements, providing early signals of potential trend changes.
EMA 55 (Slow EMA): Captures broader trends and smoothens noise for a clearer directional bias.
The area between the two EMAs is filled with a dynamic color gradient, which evolves based on how far the price has moved above or below EMA 55. The gradient acts as a visual cue to the strength and duration of the current trend:
Bright green shades indicate bullish momentum building over time.
Red tones highlight bearish momentum.
The fading effect in the gradient provides traders with an intuitive representation of trend strength, helping them gauge whether the trend is accelerating, weakening, or reversing.
Gradient-Filled Region: Unique visualization to simplify trend analysis without cluttering the chart.
Dynamic Trend Strength Indication: The gradient dynamically adjusts based on the price's proximity to EMA 55, giving traders insight into momentum changes.
Minimalist Design: The EMAs themselves are not displayed by default to maintain a clean chart while still benefiting from their analysis.
Customizable Lengths: Pre-configured with EMA lengths of 20 and 55, but easily modifiable for different trading styles or instruments.
How to Use This Indicator
Trend Detection: Look at the gradient fill for visual confirmation of trend direction and strength.
Trade Entries:
Enter long positions when the price crosses above EMA 55, with the gradient transitioning to green.
Enter short positions when the price crosses below EMA 55, with the gradient transitioning to red.
Trend Strength Monitoring:
A brighter gradient suggests a sustained and stronger trend.
A fading gradient may indicate weakening momentum and a potential reversal.
Important Notes
This indicator uses a unique method of color visualization to enhance decision-making but does not generate buy or sell signals directly.
Always combine this indicator with other tools or methods for comprehensive analysis.
Past performance is not indicative of future results; please practice risk management while trading.
How to Use:
Trend Following:
Use the gradient fill to identify the trend direction.
A consistently bright gradient indicates a strong trend, while fading colors suggest weakening momentum.
Reversal Signals:
Watch for gradient changes near the EMA crossover points.
These can signal potential trend reversals or consolidation phases.
Confirmation Tool:
Combine EXPONOVA with other indicators or candlestick patterns for enhanced confirmation of trade setups.
Emacrossover
Correlation Confluence Trend IndicatorCorrelation Confluence Trend Indicator
Overview
The Correlation Confluence Trend Indicator combines exponential moving averages (EMAs) and statistical correlation measures to identify high-confidence trend alignments between an asset and a benchmark. By filtering signals through correlation strength, this indicator highlights opportunities when the asset and benchmark move together. In other words, it defines a trend and then uses correlation strength and the trend of a second asset to identify high-confidence trends.
Key Features
Dual EMA Trend Analysis :
Calculates fast and slow EMAs for both the asset and the selected benchmark (e.g., SPY) to identify bullish and bearish trends.
Correlation Strength Filtering :
Evaluates correlation between the asset and benchmark, identifying stronger-than-average relationships based on the mean and standard deviation.
Background Color Coding :
- Green : Strong correlation, both asset and benchmark bullish.
- Aqua : Weak correlation, both asset and benchmark bullish.
- Red : Strong correlation, both asset and benchmark bearish.
- Fuchsia : Weak correlation, both asset and benchmark bearish.
- Orange : Strong correlation, benchmark bullish, asset bearish.
- Yellow : Weak correlation, benchmark bullish, asset bearish.
- Purple : Strong correlation, benchmark bearish, asset bullish.
- Lime : Weak correlation, benchmark bearish, asset bullish.
Visual Trend Indicators :
Plots fast and slow EMAs for the asset, dynamically colored based on aggregate trend signals. The color of this corresponds to the main trend signal.
Inputs
Benchmark Symbol : Symbol of the benchmark asset to compare against.
Fast EMA Length : Period for the fast EMA calculation.
Slow EMA Length : Period for the slow EMA calculation.
Correlation Length : Number of bars for correlation calculation.
Correlation Mean Length : Number of bars for mean and standard deviation calculation.
Std Dev Multiplier : Multiplier for standard deviation to define correlation strength. When the correlation is Std Dev Multiplier standard deviations above the mean, it counts as a strong correlation.
Set Background Color : Toggle background coloring on or off.
Notes
This indicator is primarily designed for trend-following strategies. By combining trend analysis and correlation filtering, it ensures that signals occur during aligned market conditions, reducing false signals.
Before incorporating this indicator into your trading strategy:
Always backtest on historical data to evaluate its performance before committing capital.
Use proper risk management to control position sizes and mitigate potential losses.
Remember that no indicator guarantees success. I'm quite proud of this one, but it's not the holy grail.

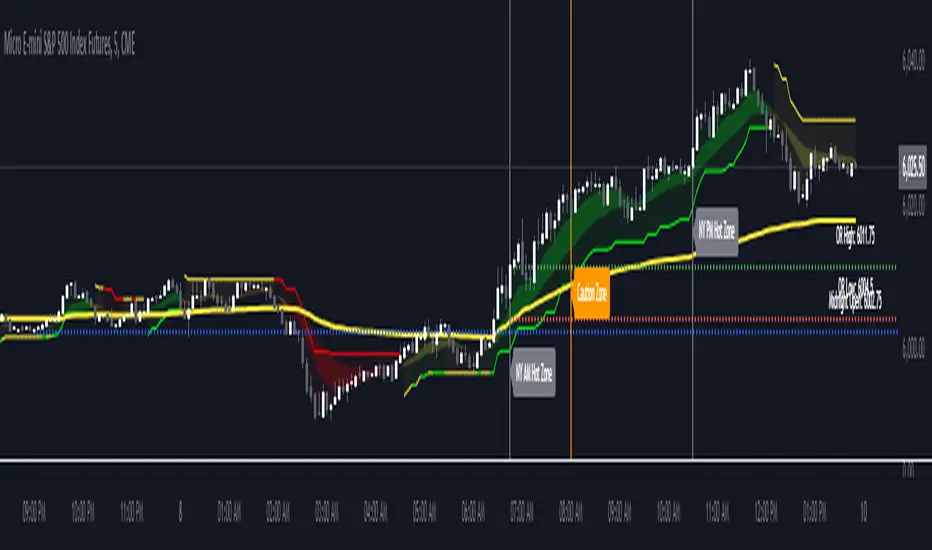
The Forexation: Super Trend SignalsOverview:
The Forexation: Super Trend Signals (STS) indicator was crafted to enhance visualization of market trends by integrating multiple technical analysis tools and adding logic to them so they color bullish, bearish, counter trends, and cautious trends. By combining standard and higher-timeframe Supertrends with dynamic EMAs and VWAP, STS offers a multi-dimensional view of market dynamics. This synergy allows traders to:
Assess Trend Strength and Alignment
Identify Momentum Shifts and Reversals
Gauge Market Sentiment through Volume-Weighted Pricing
Filter Out Market Noise for Clearer Signals
Key Features and Synergy:
1. Dual Supertrend Analysis:
Standard Supertrend:
Utilizes the Average True Range (ATR) and a multiplier factor to detect immediate market trends.
Customizable ATR Length and Factor to adjust sensitivity to market volatility.
Used as a guide to help follow the trend and identify where if price breaks through we can be reversing trend or entering a counter/cautious trend.
Higher Time Frame (HTF) Supertrend:
Integrates Supertrend data from a higher timeframe for a broader market perspective.
Smoothing applied via an EMA to reduce lag and false signals.
**Synergistic Effect:
Trend Alignment: By analyzing both standard and HTF Supertrends, STS identifies when short-term trends align with long-term trends, increasing the reliability of trend signals.
Dynamic Adjustments: Traders can adjust parameters to fine-tune the balance between responsiveness and stability.
2. Customized EMAs with Contextual Color-Coding:
Fast and Slow EMAs:
Customizable periods to match different trading strategies and timeframes.
EMAs are used to identify momentum shifts and potential reversals through crossovers.
Dynamic Color-Coding:
EMA lines change color based on their relationship with each other, the Supertrends, and VWAP.
Visual Interpretation:
Bullish Alignment: Fast EMA above Slow EMA, both above Supertrend and VWAP, signals strong upward momentum.
Bearish Alignment: Fast EMA below Slow EMA, both below Supertrend and VWAP, signals strong downward momentum.
Caution Zones: Misalignment or crossovers indicate potential reversals or consolidation.
**Synergistic Effect:
Momentum Confirmation: EMA crossovers are validated against Supertrend directions, reducing false signals.
Support and Resistance Zones: The area between EMAs acts as dynamic support/resistance, visualized through an optional fill.
3. VWAP Integration for Volume-Weighted Insights:
VWAP Analysis:
Calculates the average price weighted by volume, providing insights into institutional trading levels and market sentiment.
**Synergistic Effect:
Trend Validation: Confirms trend strength by analyzing whether price and EMAs are above or below VWAP.
Counter-Trend Detection: Identifies potential pullbacks or reversals when price interacts with VWAP against the prevailing trend of the standard and higher time frame SuperTrend.
4. Composite Signal Generation:
Color-Coded Market Conditions:
Bullish Signals (Green): Strong upward trends with alignment across standard + HTF Supertrend, EMAs, and price above VWAP.
Bearish Signals (Red): Strong downward trends with inverse alignment.
Caution State (Orange): Potential market reversals or uncertainty when indicators are misaligned. (Example: price above VWAP but under HTF SuperTrend)
Counter-Trend Conditions (Yellow): Signals possible pullbacks or consolidations when price or EMAs cross VWAP. (Example: Price is above VWAP & HTF SuperTrend but the EMAs and Standard SuperTrend are in a down trend)
**Synergistic Effect:
Enhanced Signal Accuracy: By requiring multiple confirmations across different indicators and timeframes, STS filters out noise and increases the probability of trends in the market.
Timely Alerts: Alerts are generated when critical conditions are met, keeping traders informed of significant market movements.
Underlying Concepts and Calculations:
Supertrend Algorithm:
Calculation:
Supertrend is calculated using ATR to set a dynamic trailing stop that follows price movements.
The indicator switches between bullish and bearish modes when price crosses the Supertrend line.
Customization:
ATR Length and Factor can be adjusted to make the Supertrend more or less sensitive to price changes.
In STS: Both standard and HTF Supertrends are used, with the HTF providing longer-term trend context.
Exponential Moving Averages (EMAs):
Calculation:
EMAs apply more weight to recent prices, making them more responsive than Simple Moving Averages (SMAs).
Crossovers between Fast and Slow EMAs signal potential momentum shifts.
Customization:
Periods for Fast and Slow EMAs are user-defined to suit different trading styles.
In STS: EMA behavior is analyzed in conjunction with Supertrend and VWAP to validate signals.
Volume Weighted Average Price (VWAP):
Calculation:
VWAP accumulates total dollars traded (price times volume) divided by total volume over a specific period.
Reflects the average price at which the instrument has traded throughout the day based on both price and volume.
**In STS:
VWAP serves as a dynamic support/resistance level.
Interaction with VWAP can indicate shifts in market sentiment, especially when combined with other indicators.
Justifying the Value of STS:
Holistic Market Analysis:
STS doesn't just merge indicators; it creates a cohesive system where each component validates and enhances the others.
This integrated approach offers a more reliable analysis than using individual indicators in isolation.
Customizable and Adaptive:
Traders have control over key parameters, allowing STS to be tailored to different markets and trading styles.
The ability to adjust sensitivity helps in adapting to varying market conditions.
Enhanced Decision-Making:
By providing clear visual cues and alerts, STS aids in quick interpretation of complex market data.
The indicator helps in identifying high-probability trend opportunities and managing risk effectively with trailing SuperTrend guidance.
Unique Signal Filtering:
The combination of multiple confirmations reduces the likelihood of false trend signals.
The use of higher timeframe data and volume-weighted analysis adds depth to trend assessment.
How to Use STS Effectively:
1. Configuring Settings:
Supertrend Settings:
Adjust ATR Length and Factor to set the desired sensitivity.
Select the Higher Time Frame for the HTF Supertrend to align with your trading horizon.
Set the Smoothing Period for the EMA applied to the HTF Supertrend.
EMA Settings:
Define periods for Fast and Slow EMAs based on your strategy.
Ensure the Fast EMA period is shorter than the Slow EMA for effective crossovers.
Color and Display Settings:
Customize colors for different market conditions to enhance visual clarity.
Choose whether to display the HTF Supertrend, EMA lines, EMA fill, and VWAP.
2. Interpreting Signals:
Bullish Scenario:
Supertrends indicate an uptrend.
Fast EMA crosses above Slow EMA, both trending upwards.
Price and EMAs are above VWAP.
Action: Consider long positions, using the standard Supertrend as a trailing stop.
Bearish Scenario:
Supertrends indicate a downtrend.
Fast EMA crosses below Slow EMA, both trending downwards.
Price and EMAs are below VWAP.
Action: Consider short positions. using the standard Supertrend as a trailing stop
Caution and Counter-Trend Signals:
Misalignment between indicators or color changes to orange/yellow.
Action: Exercise caution, tighten stops, or wait for clearer signals.
4. Setting Up Alerts:
Access the Alerts menu.
Configure alerts for:
Supertrend Direction Changes
EMA Crossovers
Price Crossing VWAP
Set alert actions and ensure they trigger on confirmed data by selecting "Once Per Bar Close."
Example Trading Strategies:
Trend Following:
Use STS to identify strong trends where all indicators are aligned.
Enter positions in the direction of the trend.
Use Supertrend lines as dynamic stop-loss levels.
Pullback Entries:
Wait for price to pull back to the EMA fill area or VWAP in a prevailing trend.
Look for bounce signals off these levels when supported by Supertrend direction.
Counter-Trend Opportunities:
Identify potential reversals when caution or counter-trend signals appear.
Confirm with additional analysis or indicators before taking positions against the main trend.
Disclaimer:
This indicator is intended to aid in technical analysis and should be used as part of a comprehensive trading strategy. It does not guarantee profits and carries the risk of loss. Trading financial instruments involves significant risk; please consult with a qualified financial advisor before making any investment decisions. Past performance is not indicative of future results.
Final Notes:
The Forexation: Super Trend Signals (STS) indicator represents a thoughtfully engineered tool that brings together multiple technical elements to provide a more nuanced understanding of market behavior. By leveraging the strengths of Supertrend, EMAs, and VWAP in unison, STS aims to enhance trading precision and confidence in the trends the market creates but also guide risk management levels for managing a trade and stop loss areas.
We are committed to continuous improvement and value user feedback. Please share your experiences and suggestions to help us refine the indicator further.
Happy Trading!
Custom EMA Multi-Timeframe Indicator [Pineify]
This innovative indicator combines Exponential Moving Averages (EMAs) across multiple timeframes to provide traders with a comprehensive view of market trends and potential trading opportunities. By analyzing short, medium, and long-term EMAs simultaneously, this indicator offers valuable insights into market dynamics and helps identify high-probability entry and exit points.
Key Features
Multi-timeframe analysis using customizable EMAs
Visual representation of trend alignment across different timeframes
Customizable EMA lengths and sources for each timeframe
Buy and sell signals based on EMA crossovers
Alert functionality for real-time trade notifications
How It Works
The Custom EMA Multi-Timeframe Indicator calculates three separate EMAs:
1. Short-term EMA: Represents immediate market sentiment
2. Medium-term EMA: Captures intermediate trend direction
3. Long-term EMA: Reflects the overall market trend
These EMAs are plotted on the chart using different colors for easy identification. The indicator generates buy and sell signals based on the relative positions of these EMAs, providing traders with clear visual cues for potential trade entries and exits.
Trading Ideas and Insights
This indicator offers several powerful trading concepts:
Trend Alignment: When all three EMAs are aligned (short above medium above long), it indicates a strong trend. Traders can look for pullbacks to enter in the direction of the trend.
Trend Reversal: When the short-term EMA crosses above or below both the medium and long-term EMAs, it may signal a potential trend reversal. This can be used to exit existing positions or enter new trades in the opposite direction.
Range-bound Markets: When the EMAs are tightly grouped together, it suggests a consolidation phase. Traders can wait for a breakout or use range-trading strategies.
Momentum Confirmation: The speed at which the short-term EMA diverges from or converges with the longer-term EMAs can indicate the strength of the current move.
Unique Aspects
What sets this indicator apart is its ability to synthesize information from multiple timeframes into a single, easy-to-interpret visual display. Unlike traditional single-timeframe EMAs, this indicator provides a more holistic view of market trends, reducing false signals and improving trade timing.
The customizable nature of the indicator allows traders to adapt it to various trading styles and market conditions. By adjusting the EMA lengths and sources, traders can fine-tune the indicator to their specific needs and preferences.
How to Use
1. Apply the indicator to your chart
2. Customize the timeframes and EMA settings as desired
3. Look for buy signals when the short and medium EMAs cross above the long EMA
4. Look for sell signals when the short and medium EMAs cross below the long EMA
5. Use the relative positions of the EMAs to gauge overall trend strength and direction
6. Combine with other technical analysis tools for confirmation
Customization
The indicator offers extensive customization options:
Short, medium, and long timeframes can be adjusted
EMA lengths for each timeframe are customizable
EMA source (close, open, high, low, etc.) can be selected for each timeframe
Colors and line styles can be modified to suit personal preferences
Alert settings can be configured for automated trade notifications
Conclusion
The Custom EMA Multi-Timeframe Indicator is a powerful tool for traders seeking to gain a comprehensive understanding of market trends across different time horizons. By combining multiple EMAs and timeframes, it provides a unique perspective on market dynamics, helping traders make more informed decisions and potentially improve their trading results.
Whether you're a day trader looking for short-term opportunities or a swing trader focusing on longer-term trends, this indicator offers valuable insights that can enhance your trading strategy. Its flexibility and customization options make it suitable for a wide range of trading styles and market conditions.
Remember: While this indicator can be a valuable tool in your trading arsenal, it should not be used in isolation. Always combine it with other forms

Multiple EMA Indicator [Pineify]TradingView Multiple EMA Indicator: A Comprehensive Trend Analysis Tool
The TradingView Multiple EMA Indicator is a powerful and versatile tool designed to provide traders with a comprehensive view of market trends across multiple timeframes. By incorporating five Exponential Moving Averages (EMAs) with customizable lengths and sources, this indicator offers a nuanced approach to trend analysis, suitable for both novice and experienced traders.
Key Features:
Five customizable EMAs for multi-timeframe analysis
Flexible source inputs for each EMA
Color-coded plots for easy visual interpretation
Overlay functionality for direct price action comparison
How It Works:
This indicator calculates and displays five separate EMAs on your chart, each with its own customizable length and source. The EMAs are color-coded for easy identification:
EMA-1: Red
EMA-2: Light Green
EMA-3: Light Blue
EMA-4: Purple
EMA-5: Yellow
By default, the indicator uses the following settings:
EMA-1: 10-period EMA of close price
EMA-2: 20-period EMA of close price
EMA-3: 50-period EMA of close price
EMA-4: 100-period EMA of close price
EMA-5: 200-period EMA of close price
However, users can easily adjust these settings to suit their specific trading strategies and preferences.
Trading Ideas and Insights:
The Multiple EMA Indicator offers several ways to analyze market trends and generate trading signals:
Trend Identification: The alignment of the EMAs can help identify the overall trend. When shorter-term EMAs are above longer-term EMAs, it suggests an uptrend, and vice versa for a downtrend.
Dynamic Support and Resistance: Each EMA can act as a dynamic support or resistance level. Price bouncing off these levels can indicate potential entry or exit points.
Crossovers: When a shorter-term EMA crosses above a longer-term EMA, it may signal a bullish trend change. Conversely, a bearish signal may occur when a shorter-term EMA crosses below a longer-term EMA.
Trend Strength: The spacing between the EMAs can indicate trend strength. Wide spacing suggests a strong trend, while narrow spacing or intertwining EMAs may indicate consolidation or a weakening trend.
Multi-Timeframe Analysis: By using different EMA lengths, traders can gain insights into short-term, medium-term, and long-term trends simultaneously.
How to Use the Indicator:
Add the indicator to your chart and adjust the input parameters as needed.
Observe the relative positions of the EMAs to identify the overall trend direction.
Look for potential entry signals when price or shorter-term EMAs cross above or below longer-term EMAs.
Use the EMAs as dynamic support and resistance levels for setting stop-loss and take-profit orders.
Combine the Multiple EMA Indicator with other technical analysis tools, such as oscillators or volume indicators, for more comprehensive trading decisions.
Customization Options:
The indicator offers extensive customization options, allowing traders to tailor it to their specific needs:
Adjust the length of each EMA to focus on different timeframes
Change the source of each EMA (e.g., close, open, high, low, HL2, HLC3, OHLC4)
Modify the color and line thickness of each EMA for better visibility
Conclusion:
The TradingView Multiple EMA Indicator is a versatile and powerful tool for trend analysis and trade decision-making. By providing a multi-faceted view of market trends, it enables traders to make more informed decisions based on a comprehensive understanding of price action across various timeframes.
Remember that while this indicator can be a valuable tool in your trading arsenal, it should not be used in isolation. Always combine it with other forms of analysis and proper risk management techniques for the best results.
We hope this indicator enhances your trading experience and contributes to your success in the markets. Happy trading!

Dysmen signalsDysmen Signals Indicator
The "Dysmen Signals" indicator is designed to provide clear buy and sell signals based on the crossover of various Exponential Moving Averages (EMAs). This indicator employs a combination of short-term and long-term EMA crossovers to identify potential trading opportunities, while also highlighting significant market movements through specific signals such as the Golden Cross and Death Cross.
Indicator Components
1. Exponential Moving Averages (EMAs)
- EMA 14: A short-term EMA calculated over 14 periods.
- EMA 20: Another short-term EMA calculated over 20 periods.
- EMA 50: A mid-term EMA used as a trend filter.
- EMA 200: A long-term EMA representing the overall trend.
2. Buy and Sell Signals
- Buy Signal: This is triggered when the EMA 14 crosses above the EMA 20 and the closing price is above the EMA 50. This suggests a bullish trend in the market.
- Sell Signal: This is triggered when the EMA 14 crosses below the EMA 20 and the closing price is below the EMA 50. This indicates a bearish trend in the market.
3. Golden Cross and Death Cross
- Golden Cross (GC): Occurs when the EMA 50 crosses above the EMA 200. This is a strong bullish signal indicating a potential long-term upward trend.
- Death Cross (DC): Occurs when the EMA 50 crosses below the EMA 200. This is a strong bearish signal suggesting a potential long-term downward trend.
4. Signal Visualization
- Buy and Sell signals are marked on the chart with green and red triangles respectively. These signals help traders identify potential entry and exit points.
- Golden Cross and Death Cross signals are indicated with yellow and purple diamonds respectively, providing insight into major market trend shifts.
5. Candle Coloring
- Candles are colored green if a buy signal is active and red if a sell signal is active. This visual aid helps in quickly identifying the prevailing market sentiment.
6. EMA 200 Plotting
- The EMA 200 is plotted as a white, semi-thick line on the chart. This line serves as a reference for the overall long-term trend.
Detailed Code Explanation
- EMA Calculations: The script calculates the EMA for 14, 20, 50, and 200 periods using the ta.ema function.
- Crossover Conditions: It uses the ta.crossover and ta.crossunder functions to detect when the EMAs cross each other, triggering buy and sell signals.
- Plotting Signals: The plotshape function is utilized to display BUY and SELL signals as well as Golden Cross and Death Cross signals on the chart.
- Candle Coloring Logic: A variable direction is used to store the current market direction based on the latest signal, which then determines the candle colors using the barcolor function.
- EMA 200 Display: The plot function is used to draw the EMA 200 line on the chart with the specified color and thickness.
By employing this indicator, traders can gain valuable insights into potential market trends and make more informed trading decisions based on the crossover of key EMAs.

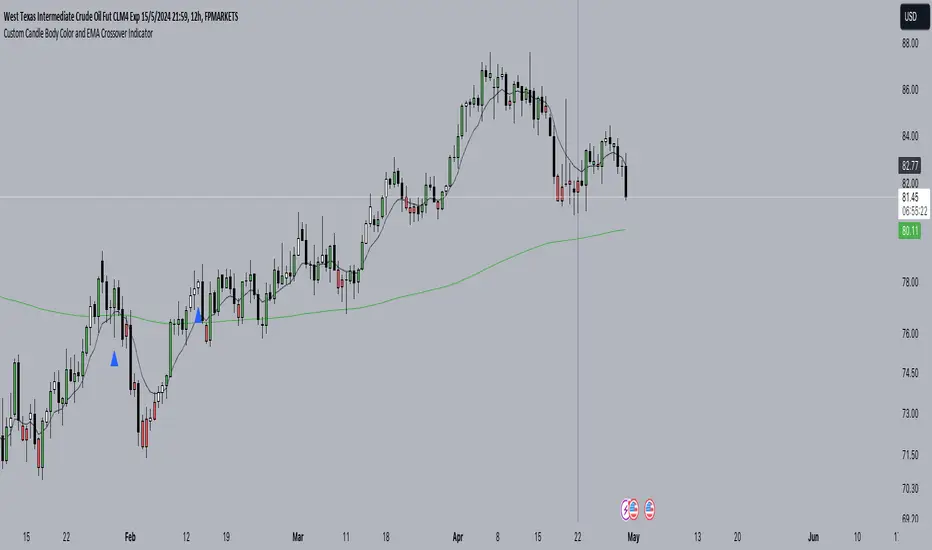
Custom Candle Body Color and EMA Crossover IndicatorWe determine if the price is below EMA 9 by comparing the close price with EMA 9.
We determine if the current candle body is huge compared to the previous candle's body.
We plot EMA 9 in black color and EMA 200 in green color.
We plot blue triangles below the bars for EMA crossover above and red triangles above the bars for EMA crossover below.
We set the color of the candle body to red if the price is below EMA 9 and to green if the price is above EMA 9, only when the current candle body is huge compared to the previous candle's body.
EMA Cross Dashboard | Flux Charts💎 GENERAL OVERVIEW
Introducing our new Exponential Moving Average (EMA) Cross Dashboard! This dashboard let's you select a source for the calculation of the EMA of it, then let's you enter 2 lengths for up to 5 timeframes, plotting their crosses in the chart.
Features of the new EMA Cross Dashboard :
Shows EMA Crosses Across Up To 5 Different Timeframes.
Select Any Source, Including Other Indicators.
Customizable Dashboard.
📌 HOW DOES IT WORK ?
EMA is a widely used indicator within trading community, it is similar to a Simple Moving Average (SMA) but places more weight on recent prices, making it more reactive to current trends. Crosses of EMA lines can be helpful to determine strong bullish & bearish movements of an asset. This indicator shows finds crosses across 5 different timeframes in a dashboard and plots them in your chart for ease of use.
🚩UNIQUENESS
This dashboard cuts through the hassle of manual EMA cross calculations and plotting. It offers flexibility by allowing various data sources (even custom indicators) and customization through enabling / disabling individual timeframes. The clear visualization lets you see EMA crosses efficiently.
⚙️SETTINGS
1. Timeframes
You can set up to 5 timeframes & 2 lenghts to detect crosses for each timeframe here. You can also enable / disable them.
2. General Configuration
EMA Source -> You can select the source for the calculation of the EMA here. You can select sources from other indicators as well as more general sources like close, high and low price.

Triple EMA Distance IndicatorTriple EMA Distance Indicator
The Triple EMA Distance indicator comprises two sets of triple exponential moving averages (EMAs). One set uses the same smoothing length for all EMAs, while the other set doubles the length for the last EMA. This indicator provides visual cues based on the relationship between these EMAs and candlestick patterns.
Blue Condition:
Indicates when the fast EMA is above the slow EMA.
The distance between the two EMAs is increasing.
Candlesticks and EMAs are colored light blue.
Orange Condition:
Activates when the fast EMA is below the slow EMA.
The distance between the two EMAs is increasing.
Candlesticks and EMAs are colored orange.
Beige Condition:
Occurs when the fast EMA is below the slow EMA.
The distance between the two EMAs is decreasing.
Candlesticks and EMAs are colored beige.
Light Blue Condition:
Represents when the fast EMA is above the slow EMA.
The distance between the two EMAs is decreasing.
Candlesticks and EMAs are colored light blue.
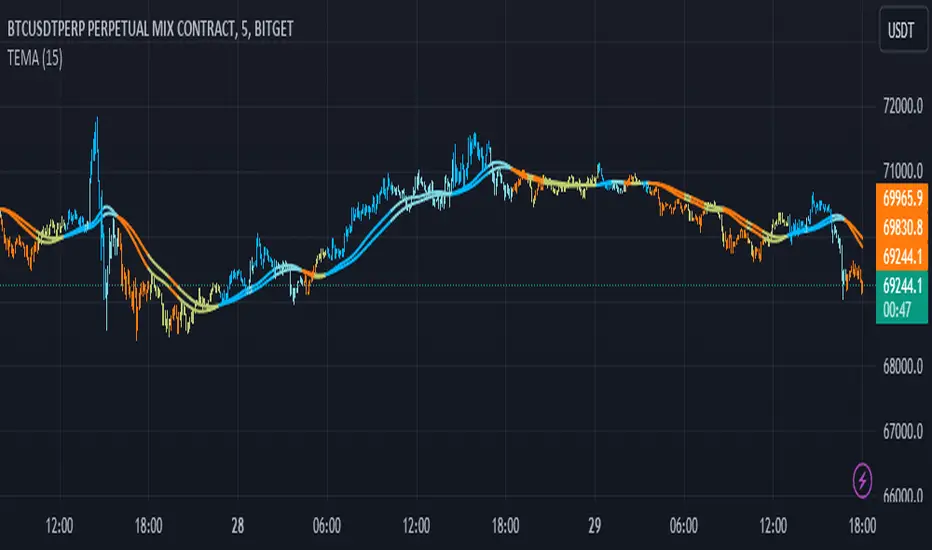
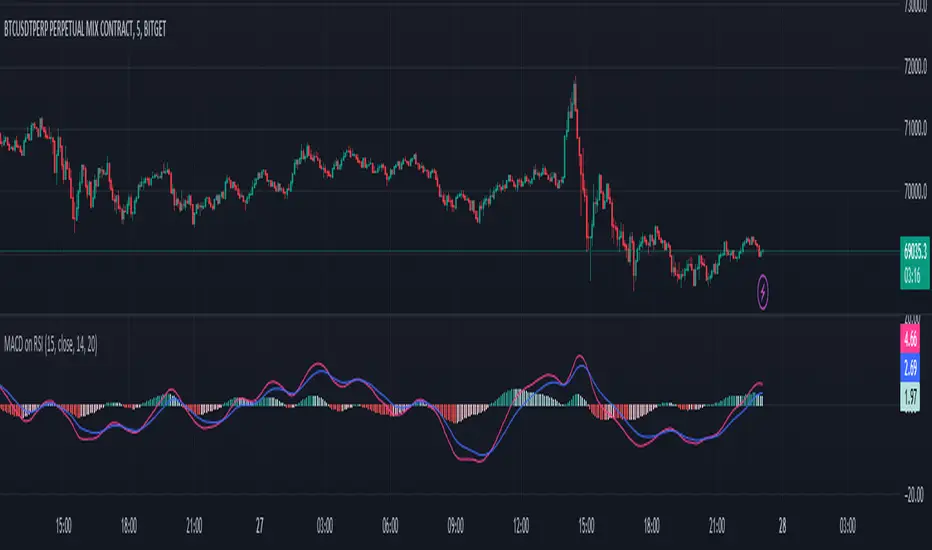
MACD on RSIThe MACD on RSI indicator combines elements of the Moving Average Convergence Divergence (MACD) and the Relative Strength Index (RSI). It calculates the RSI on a specified source with a customizable length, then applies two exponential moving averages (EMAs) to the RSI values. The difference between these EMAs forms the MACD line, visually representing the momentum of the RSI.
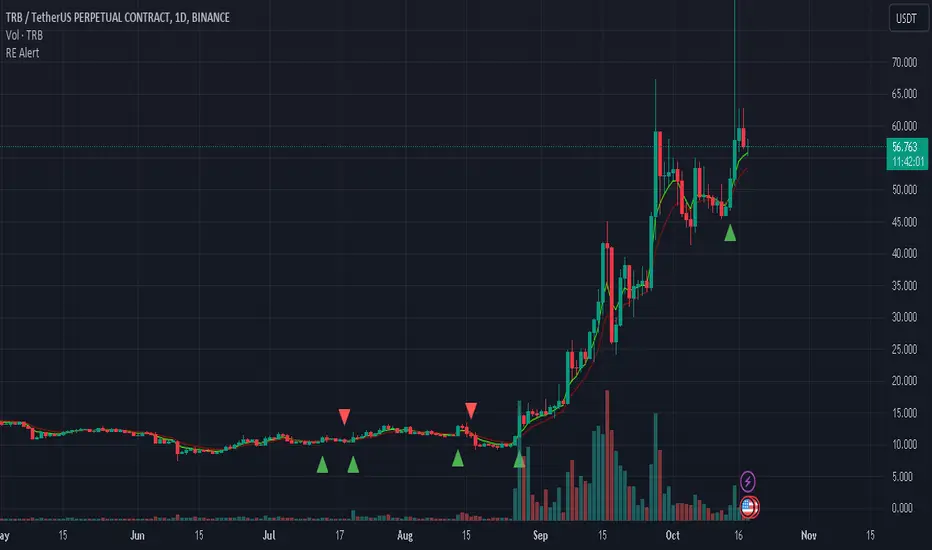
REMA CROSSOVER BY JUGNUThis indicator triggers alerts for long and short positions on DAILY TIME FRAME for SWING trades based on the conditions which described below. This script will generate alerts when the following conditions are met:
LONG POSITION:
RSI(14) above 50.
EMA(5) crosses above EMA(10).
Indicator Triangle Green below price bars
SHORT POSITION:
RSI(14) below 50.
EMA(5) crosses down EMA(10).
Indicator Triangle RED above price bars
This script plots green and red triangles below and above the price bars to indicate long and short alert conditions, respectively. It also triggers alerts when these conditions are met.
SMA/EMA/RSImagic 36.963 by IgorPlahutaTwo Elements in this script:
Alerts: These are notifications that draw your attention to specific market conditions. There are two types:
RSI Higher Lows or Lower Highs: This alert triggers when the Relative Strength Index (RSI) forms higher lows or lower highs.
RSI Exiting 30 (Up) or RSI Exiting 70 (Down): These alerts activate when the RSI crosses the 30 threshold upwards or the 70 threshold downwards.
ALL BUY/SELL: to catch both of them with one setting
To Set Up an Alert: To configure an alert, select the one relevant to your trading strategy, choose the "Greater than" option, and input a value of "0" (this essentially activates the alert). Adjust other settings as per your requirements.
Please note that these alerts should be used in conjunction with a system you trust for confirmation.
Moving Averages: This involves monitoring several moving averages:
SMA12, SMA20, EMA12, EMA20: These moving averages are highlighted with background colors to help you quickly identify changes or crossovers. They are superimposed on each other for easy comparison.
SMA 50, SMA200: These moving averages are also highlighted with background colors to spot crossovers, and their lines change color depending on their direction (falling in red or rising in green).
Enjoy using these tools in your trading endeavors!

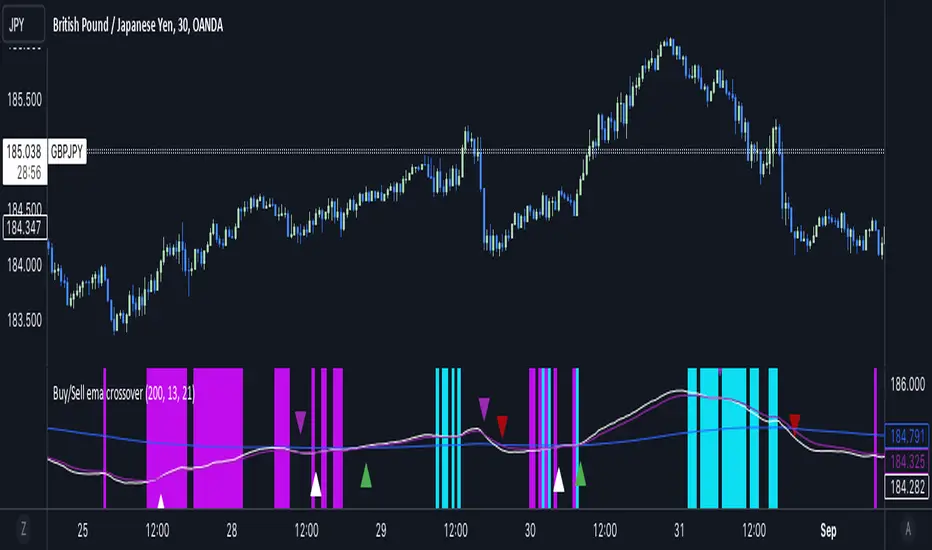
Buy/Sell EMA CrossoverThe indicator identifies potential trading opportunities within the market. It is entirely based on the combination of exponential moving averages by drawing triangles on the chart that identify buy or sell signals combined with vertical bars that create areas of interest.
Specifically, when a buy signal occurs, the indicator draws a vertical bar with an azure background, indicating a possible buy area. Similarly, a sell signal is represented by a vertical bar with a fuchsia background, indicating a possible sell area.
These areas represent the main point of the indicator which uses exponential moving averages which, based on the direction of prices, identify the trend and color the background of the graph in order to visually highlight the predominant trend.
The green triangles above the bars of the chart suggest possible upside opportunities (good bullish entry points) when the 21 ema crosses the 200 ema.
While on the contrary the red triangles, 21 ema lower than the 200 ema, can indicate possible bearish trends (good bearish entry points).
While the white and purple triangles reveal moments of potential indecision or market change.
We can think of them as situations of uncertain trend in which it is possible to place a long or short order near some conditions that we are going to see.
The white triangles below, which are created when the 13 ema is higher than the 21 ema, indicate a possible bullish zone while the purple triangles above (13 ema lower than the 21) could suggest a bearish reflex
Colored lines represent moving averages blue = 200, 21= fuchsia and 13 = white. If the price is above the 200 period line then it could be a bullish opportunity, otherwise it could be a bearish one.
An interesting strategy to adopt is to evaluate, for example, the inputs near the vertical bars (azure - long) (fuchsia - short) when a white or purple triangle appears.
The more prominent green triangle indicates that the trend is going in a long direction.
On the contrary, the red (short) triangles are the opposite of the green ones and have the same importance as input logic.
The white triangle instead present more often inside the indicator identifies interesting buying areas of short duration, it is important to consider that the closer the triangles are to the vertical blue bars the stronger the entry signal.
Finally, the purple triangles are the short-term bearish trends whose entry near the fuchsia vertical bars defines a short.
Advanced Optimized VSA - 15 MinThis script is written in Pine Script and is designed to be run on the TradingView trading platform. It is an advanced technical analysis indicator that utilizes various methods and indicators to generate trading signals based on a Volume Spread Analysis (VSA) approach.
Here's a detailed breakdown of its functionalities:
### Customizable Parameters:
1. `scoreLabel` and `TDLabel`: Customizable labels for score and trend direction.
2. `labelColorScore` and `labelColorTD`: Colors for the score and trend direction labels.
### Base Indicators and Variables:
1. `spread`: Calculates the difference between the high and low of a candle.
2. `emaVolume`: Exponential moving average of volume over a 21-period range.
3. `rsi14`: Relative Strength Index (RSI) over a 14-period range.
4. `sma200` and `ema50`: Simple moving average over a 200-period range and exponential moving average over a 50-period range, respectively.
5. `volatility`: Calculates the 14-period Average True Range (ATR) to determine volatility.
6. `trendDirection`: Establishes the trend direction based on the SMA200.
### Risk Management:
1. `atrValue`: Calculates the value of the ATR.
2. `stopLoss` and `takeProfit`: Calculates the stop-loss and take-profit levels based on the ATR.
### MACD:
Computes the MACD line, signal line, and histogram.
### Volume Analysis:
1. `weightedVol`: Weighted volume.
2. `forceFactor`: Measures the strength of price movement in relation to volume.
### Support and Resistance:
1. `support` and `resistance`: Calculates support and resistance levels based on the most recent 50 periods.
### Liquidity Check:
1. `isLiquid`: Checks if an asset is sufficiently liquid.
### Score Calculation:
Evaluates various factors such as price position relative to support/resistance levels, RSI, MACD, strength of movement, and volatility to generate a score.
### Criteria for Final Signals:
1. `isBullSpread` and `isBearSpread`: Generates a bullish or bearish signal based on various factors, including the score, trend direction, and liquidity.
### Notifications:
Generates alert conditions for bullish and bearish signals.
### Graphical Elements:
Displays various indicators and signals on the chart, including stop-loss, take-profit, SMA200, EMA50, and support and resistance lines.
### Debugging Labels:
Shows labels on the chart for score and trend direction.
The goal is to provide a comprehensive picture of the current asset, taking into consideration various factors and generating potentially profitable trading signals.
################################################################### ITALIANO ########################################################################################
##############################################################################################################################################################################################
Questo script è scritto in Pine Script e progettato per essere eseguito sulla piattaforma di trading TradingView. È un indicatore di analisi tecnica avanzata che utilizza diversi metodi e indicatori per generare segnali di trading basati su un approccio Volume Spread Analysis (VSA).
Ecco un riepilogo dettagliato delle funzionalità:
### Parametri personalizzabili:
1. `scoreLabel` e `TDLabel`: Etichette personalizzabili per i punteggi e la direzione del trend.
2. `labelColorScore` e `labelColorTD`: Colori delle etichette per punteggio e direzione del trend.
### Indicatori e variabili base:
1. `spread`: Calcola la differenza tra il massimo e il minimo di una candela.
2. `emaVolume`: Media mobile esponenziale del volume con un periodo di 21.
3. `rsi14`: RSI (Relative Strength Index) con un periodo di 14.
4. `sma200` e `ema50`: Media mobile semplice con un periodo di 200 e media mobile esponenziale con un periodo di 50, rispettivamente.
5. `volatility`: Calcola l'Average True Range (ATR) con un periodo di 14 per determinare la volatilità.
6. `trendDirection`: Stabilisce la direzione del trend basata sulla SMA200.
### Gestione del rischio:
1. `atrValue`: Calcola il valore dell'ATR.
2. `stopLoss` e `takeProfit`: Calcola i livelli di stop-loss e take-profit basati sull'ATR.
### MACD:
Calcola le linee MACD, segnale e l'istogramma.
### Analisi del volume:
1. `weightedVol`: Volume ponderato.
2. `forceFactor`: Misura la forza del movimento del prezzo in relazione al volume.
### Supporto e resistenza:
1. `support` e `resistance`: Calcola i livelli di supporto e resistenza basati sui 50 periodi più recenti.
### Verifica della liquidità:
1. `isLiquid`: Verifica se un asset è sufficientemente liquido.
### Calcolo del punteggio:
Valuta diversi fattori come la posizione del prezzo rispetto ai livelli di supporto/resistenza, RSI, MACD, forza del movimento e volatilità per generare un punteggio.
### Criteri per i segnali finali:
1. `isBullSpread` e `isBearSpread`: Genera un segnale rialzista o ribassista basato su vari fattori, incluso il punteggio, la direzione del trend e la liquidità.
### Notifiche:
Genera condizioni di allarme per segnali rialzisti e ribassisti.
### Elementi grafici:
Visualizza diversi indicatori e segnali sul grafico, inclusi stop-loss, take-profit, SMA200, EMA50, e linee di supporto e resistenza.
### Etichette di debug:
Mostra etichette sul grafico per il punteggio e la direzione del trend.
L'obiettivo è fornire un quadro completo dell'asset corrente, prendendo in considerazione diversi fattori e generando segnali di trading potenzialmente profittevoli.

Hybrid EMA AlgoLearner⭕️Innovative trading indicator that utilizes a k-NN-inspired algorithmic approach alongside traditional Exponential Moving Averages (EMAs) for more nuanced analysis. While the algorithm doesn't actually employ machine learning techniques, it mimics the logic of the k-Nearest Neighbors (k-NN) methodology. The script takes into account the closest 'k' distances between a short-term and long-term EMA to create a weighted short-term EMA. This combination of rule-based logic and EMA technicals offers traders a more sophisticated tool for market analysis.
⭕️Foundational EMAs: The script kicks off by generating a 50-period short-term EMA and a 200-period long-term EMA. These EMAs serve a dual purpose: they provide the basic trend-following capability familiar to most traders, akin to the classic EMA 50 and EMA 200, and set the stage for more intricate calculations to follow.
⭕️k-NN Integration: The indicator distinguishes itself by introducing k-NN (k-Nearest Neighbors) logic into the mix. This machine learning technique scans prior market data to find the closest 'neighbors' or distances between the two EMAs. The 'k' closest distances are then picked for further analysis, thus imbuing the indicator with an added layer of data-driven context.
⭕️Algorithmic Weighting: After the k closest distances are identified, they are utilized to compute a weighted EMA. Each of the k closest short-term EMA values is weighted by its associated distance. These weighted values are summed up and normalized by the sum of all chosen distances. The result is a weighted short-term EMA that packs more nuanced information than a simple EMA would.

EMA Screener with Day BreakoutsThe present script is aimed at screening number of stocks as per user input with respect to Daily Exponential Moving Average. Default is set at 200 DEMA, it can be changed by the user from settings menu as per user's preference.
The EMA cell illuminates to Green if Day's Open < EMA
The EMA cell illuminates to Purple if Day's Open > EMA
EMU cell shows the price as, EMA * EMA Price Multiplier (i.e. range below EMA, customizable from settings by user)
EMU cell illuminates to light Green when Price > EMU (i.e. the price is in range of EMA, For example suppose EMA value is 1000 and EMA Price Multiplier is 0.95 then the EMU cell value will be 950 as soon as the price crosses above 950 the EMU cell will get illuminated)
EMD cell shows the price as, EMA * EMA Price Multiplier (i.e. range above EMA, customizable from settings by user)
EMD cell illuminates to red when Price < EMD (i.e. the price is in range of EMA, For example suppose EMA value is 1000 and EMA Price Multiplier is 1.05 then the EMD cell value will be 1050 as soon as the price crosses below 1050 the EMD cell will get illuminated)
The DBO (Day Break Out) cell illuminates to Blue when the current price is near Day's high.
--Dr. Vats
Disclaimer: Only for studying price movement ideas, trading is not advised.

Buy/Sell EMA CandleThis indicator is designed to display various technical indicators, candle patterns, and trend directions on a price chart. Let's break down the code and explain its different sections:
Exponential Moving Averages (EMA):
The code calculates and plots five EMAs of different lengths (13, 21, 55, 90, and 200) on the price chart. These EMAs are used to identify trends and potential crossovers.
Engulfing Candle Patterns:
The code identifies and highlights potential bullish and bearish engulfing candle patterns. It checks if the current candle's body size is larger than the combined body sizes of the previous and subsequent four candles. If this condition is met, it marks the pattern on the chart.
s3.tradingview.com
EMA Crossovers:
The code identifies and highlights points where the shorter EMA (ema1) crosses above or below the longer EMA (ema2). It plots circles to indicate these crossover points.
Candle Direction and RSI Trend:
The code determines the trend direction of the last candle based on whether it closed higher or lower than its open price. It also calculates the RSI (Relative Strength Index) and determines its trend direction (overbought, oversold, or neutral) based on predefined thresholds.
s3.tradingview.com
Table Display:
The code creates a table displaying trend directions for different timeframes (monthly, weekly, daily, 4-hour, and 1-hour) for candle direction and RSI trends. The trends are labeled with "L" for long, "S" for short, and "N/A" for not applicable.
High Volume Bars (HVB):
The code identifies and colors bars with above-average volume as either bullish or bearish based on whether the price closed higher or lower than it opened. The color and conditions for high volume bars can be customized.
s3.tradingview.com
Doji Candle Pattern:
The code identifies and marks doji candle patterns, where the open and close prices are very close to each other within a certain percentage of the candle's high-low range.
RSI-Based Candle Coloring:
The code adjusts the color of the candles based on the RSI value. If the RSI value is above the overbought threshold or below the oversold threshold, the candles are colored yellow.
Usage and Interpretation:
Traders can use this indicator to identify potential trend changes based on EMA crossovers and candle patterns like engulfing and doji.
The RSI trend direction can provide additional insight into potential overbought or oversold conditions.
High volume bars can indicate potential price reversals or continuation patterns.
The table provides an overview of trend directions on different timeframes for both candle direction and RSI trends.
Keep in mind that this is a complex indicator with multiple features. Users should carefully evaluate its performance and consider combining it with other indicators and analysis methods for more accurate trading decisions.
The table is designed to provide a consolidated view of trend directions and other indicators across multiple timeframes. It is displayed on the chart and organized into rows and columns. Each row corresponds to a specific aspect of analysis, and each column corresponds to a different timeframe.
Here's a breakdown of the components of the table:
Row 1: Separation.
Row 2 (Header Row): This row contains the headers for the columns. The headers represent the different timeframes being analyzed, such as Monthly (M), Weekly (W), Daily (D), 4-hour (4h), and 1-hour (1h).
Row 3 (Content Row): This row contains labels indicating the types of information being displayed in the columns. The labels include "T" for Trend, "C" for Current Candle, and "R" for RSI Trend.
Row 4 and Onwards: These rows display the actual data for each aspect of analysis across different timeframes.
For each aspect of analysis (Trend, Current Candle, RSI Trend), the corresponding rows display the following information:
Monthly (M): The trend direction for the given aspect on the monthly timeframe.
Weekly (W): The trend direction for the given aspect on the weekly timeframe.
Daily (D): The trend direction for the given aspect on the daily timeframe.
4-hour (4h): The trend direction for the given aspect on the 4-hour timeframe.
1-hour (1h): The trend direction for the given aspect on the 1-hour timeframe.
The trend directions are represented by labels such as "L" for Long, "S" for Short, or "N/A" for Not Applicable.
The table's purpose is to provide a quick overview of trend directions and related information across multiple timeframes, aiding traders in making informed decisions based on the analysis of trend changes and other indicators.

Dee EMA 5.0
1. Indicator Features:
- The indicator can plot four different sets of EMA on a chart.
- The EMA values can be displayed on the chart with their respective names (e.g., ema9, ema20, etc.).
- The indicator allows customization of the EMA values.
2. Purpose of Dee_EMA 5.0:
- Dee_EMA 5.0 is a unique EMA indicator specially designed for traders to provide better insights and aid in trading decisions.
- The primary reason for building this indicator is to address the challenge of managing multiple time frames while using normal EMA tables.
- Traditional EMA tables might not show all EMA values across different time frames simultaneously, leading to time-consuming processes like shifting time frames and refreshing charts.
- Dee_EMA 5.0 solves this issue by displaying EMA values for different time frames in one table, allowing traders to make quick judgments without repeatedly changing time frames and refreshing charts.
3. Importance of Different Time Frame EMA Values:
- Different time frames EMA values are crucial in trading because they provide valuable insights into the market dynamics at various levels.
- When using shorter time frames (e.g., 1-minute), EMA values can help identify short-term trends, support, and resistance levels.
- On the other hand, using larger time frames (e.g., 5-minute or 15-minute) provides more data and increases the accuracy of EMA-based analysis, enabling traders to identify longer-term trends and potential price movements.
4. EMA Crossover Table:
- Traders often prefer a clutter-free chart without too many lines, but they still need access to EMA values for analysis.
- The EMA table and EMA crossover table serve this purpose by providing EMA values and EMA crossover information in a structured table format.
- With the EMA crossover table, traders can quickly check EMA values and crossovers across different time frames without having to switch time frames repeatedly, saving time and facilitating faster decision-making during trading.
In summary, Dee_EMA 5.0 is an EMA indicator designed to help traders efficiently analyze EMA values across different time frames, allowing for faster and more informed trading decisions. The EMA crossover table provides additional convenience by presenting EMA crossovers without cluttering the chart.

Sessioned EMA - Frozen EMA in post market hoursWhy I develop this indicator?
In future indices, post market data with little volume distort the moving average seriously. This indicator is to eliminate the distortion of data during low volume post market hours.
How to use?
There is a time session setting in the indicator, you can set the cash hour time, moving average outside the session will be frozen.
What this indicator gives you
This indicator give you a more make sense ema pattern, the ema lines are more respected by the prices when you set the session properly.
Setup
1. Session setting
In US indices, such as NQ, ES etc, when there was data release at 0830 hr, huge volume transaction order appears, that makes the 0830 price data important that should be included in your ema trend line calculating. If that is the case, I will set the session begin from 0830, otherwise, I start the session at 0930. Golden rule : Price with huge volume counts.
2. Time zone
The coding is decided for GMT+8 time zone, you may amend the code to fit your timezone.

All in One EMA indicator with Average EMA Calculations The Indicator displays multiple exponential moving averages (EMAs) on the chart. The six available options will let you adjust and set ]exponential moving averages ( EMAS) as per your choice. Additionally I have added an Average ema which will calculate the average of all the emas that you have selected. This average ema works very strong and greatly to find potential zone of dynamic supports and resistance as well as to gauge the overall trend .. The average ema will also allow you to keep your chart clean and you wont have to add too many emas together.
The average of the selected EMAs are displayed as a single line. This helps identify trends and potential reversals in the market. i hope this indicator will help you with trading...
Plz use the chart BINANCE:LINKBTC as reference, for back testing and educational purposes only.
Thumbs up if you liked the script.
Happy trading..

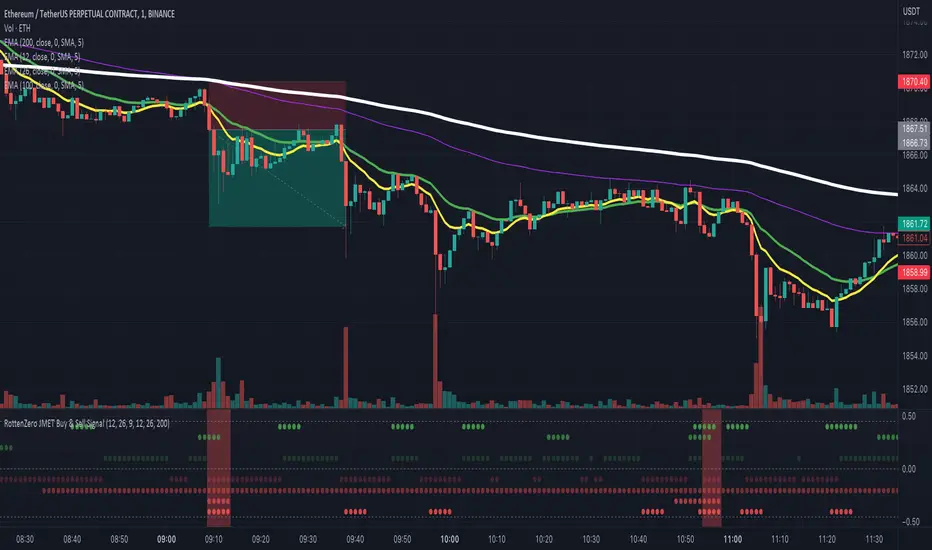
RottenZero JMET Buy & Sell Signal”RottenZero JMET Buy & Sell Signal" is a custom indicator designed to help traders identify potential buy and sell signals in the market by unifying multiple indicators into a single tool.
(J(JMA)+M(MACD)+E(EMA)+T(Trend))
This was inspired by YouTube videos that showcased trading strategies using separate indicators.
The indicator combines the Jurik Moving Average (JMA), Moving Average Convergence Divergence (MACD), and Exponential Moving Averages (EMA) into a concise visual representation using circles and background colors.
The indicator plots various events as circles with varying opacity levels, which helps visualize the strength of the signals.
It also changes the background color to green for a long signal and red for a short signal, indicating potential buy and sell signals, respectively.
Here's some examples:
(Please note that signals are not always accurate and should be used as a reference in your trading decisions, rather than relying solely on them.
It's essential to use proper risk management and incorporate other aspects of technical and fundamental analysis to make well-informed trading decisions.)
I hope this unified indicator proves to be a valuable tool in your trading.
-----
(KO)
"RottenZero JMET Buy & Sell Signal"은 여러 지표를 하나의 도구로 합쳐 잠재적인 매수 및 매도 신호를 파악하는 데 도움이 되도록 설계된 인디케이터입니다.
(J(JMA)+M(MACD)+E(EMA)+T(Trend))
이 인디케이터는 별도의 여러 지표를 사용한 거래 전략을 보여주는 YouTube 동영상에서 영감을 얻어 더 편하게 사용하기 위해 만들게 되었습니다.
지표는 Jurik 이동 평균 (JMA), 이동 평균 수렴 발산 (MACD), 지수 이동 평균 (EMA)을 원형 및 배경색을 사용하여 심플하게 보이도록 했습니다.
지표는 다양한 투명도 수준의 원으로 이벤트를 표시하여 신호의 강도를 시각화하는 데 도움이 됩니다.
또한 배경색을 Long 신호의 경우 초록색으로, Short 신호의 경우 빨간색으로 변경하여 잠재적인 매수 및 매도 신호를 나타냅니다.
(신호가 항상 정확하지는 않으므로, 이를 거래 결정에 대한 참조로 사용하고 전적으로 의존하지 마시길 바라며,
적절한 리스크 관리와 기술적이고 기본적인 여러 근거들을 포함하여 신중한 거래 결정을 내리시기를 바랍니다.)
이 인디케이터가 거래하실 때 도움이 되시기를 바라겠습니다.
AutoLevels3.0AutoLevels is a script based on the ATR ( Average True Range ) of price action over the past 14 days. It calculates those and includes Fibonacci Extensions to create Levels that are Automatically created each morning. These are not based on past price action but are well respected and easily show patterns throughout the day.
Levels are made up of a BULL BAR , a BEAR BAR ( Go long above Bull, short below Bear Bar ) and the various extensions beyond them. Common Liquidity areas are also highlighted as tan/yellow bars. These are common reversal and contention levels should price action approach them.
Also included are 4 EMAs that have been transformed into 2 separate EMA clouds. These clouds will change color when bearish / bullish and crossing and signal up and downtrends and compress during chop. They are 100% customizable with your own EMA preference. Colors as well.
The Candles are Volume Based Candles. They default to Hollow candles when Volume is below the 24 moving average ( customizable ) and are filled solid when the volume for that time period has HIGH RELATIVE VOLUME. These are GREAT SIGNALS as price action approaches the levels that the AUTOLEVEL indicator generate. When a candle is filled and approaching a level it is likely to break through or attempting to. Low volume candles, hollow, show low conviction in price movement.
Aside from the Fibonacci Levels generated, the EMA Clouds and the Volume Candles you can also select how full or minimal your chart is. ( more levels to only a few ) Also you can extend all levels to the right for future charting or leave that selection off to only generate the static daily levels a few bars ahead.
You can also adjust the timeframe the Autolevels are generating levels for. 1 day is the current day. 1 month plots out a month of levels and is best used with the 1D timeframe.
You can look up my Twitter account for hundreds of examples of daily use.

Conceptive Price Moving Average [CSM]The Conceptive Price Moving Average (CPMA) is a technical indicator designed to provide a more accurate moving average of the price by using the average of various price types, such as open, close, high, low, etc. The CPMA can help to smooth out the noise and provide a clearer picture of the overall trend by taking the average of the last 3 candles for each price type and then calculating the average of those averages.
To use the CPMA for generating buy/sell signals, you can look for crossovers of the CPMA and other commonly used moving averages, such as the 9-period EMA, 20-period EMA, 50-period EMA, 100-period EMA, and 200-period EMA, which are also plotted on the chart. When the CPMA crosses above a shorter-term moving average, such as the 9-period EMA or 20-period EMA, it can indicate a potential buy opportunity, while when the CPMA crosses below a shorter-term moving average, it can indicate a potential sell opportunity.
Based on my analysis of BankNifty and Nifty, I have found that the CPMA works best at a length of 21, showing good resistance and support for stocks. Therefore, I recommend using a length of 21 when using the CPMA for generating buy/sell signals.
