EMA Pullback Pro V8.5Introduction to High-Probability Trend Trading
The EMA PBN Pro 8.5 is a specialized trading suite designed to assist scalpers and day traders in identifying high-probability trend continuation setups.
In professional trading, one of the most difficult challenges is distinguishing between a genuine "dip" in an uptrend and the beginning of a reversal. Many traders lose capital by entering pullbacks too early (catching a falling knife) or too late (chasing the move). This script addresses that issue by combining multiple layers of trend analysis into a single, objective visual interface.
The Philosophy Behind the Script
This tool is built on the core principle that price action in strong trends tends to respect dynamic support and resistance zones derived from institutional moving averages and relative strength flows.
Trend Alignment: Markets are fractal. A 5-minute pullback is often a 1-minute downtrend. This system uses multi-factor analysis to ensure you are trading in the direction of the dominant momentum, filtering out low-quality "chop" environments where moving averages lose their efficacy.
Relative Strength (RS/RW): Asset selection is key. Trading an asset that is showing relative strength compared to the broader market index (like SPY or QQQ) significantly increases the probability of a successful bounce. This script incorporates logic to highlight assets that are outperforming their peers.
Objective Entries: By visually plotting "Value Zones," the script removes the guesswork. It waits for specific confluence criteria—momentum exhaustion, trend alignment, and relative strength—before suggesting an area of interest.
Features Overview
Dynamic Trend Filtering: Color-coded zones indicate when the market is in a "safe" buy/sell zone versus a neutral zone where cash is the best position.
Pullback Detection: Automatically identifies optimal zones for re-entry into established trends, helping traders enter on weakness in strong stocks.
Noise Reduction: The algorithm smoothes out insignificant price fluctuations, allowing the trader to focus on the structural moves of the session.
Access and Permissions
This is a proprietary, Invite-Only script. It is protected to prevent unauthorized distribution and to maintain the integrity of the strategy for current users.
The source code is hidden.
Access is granted on a per-user basis.
Please refer to the Author's Instructions section below for details on how to request access or trial the system.
(Note: This tool is for educational purposes only. Past performance is not indicative of future results. Always manage your risk.)
Rata-Rata Pergerakan Eksponensial / Exponential Moving Average (EMA)

Multi EMA (10)Allows you to add and configure up to 10 EMAs to your chart with a single indicator. Enjoy.

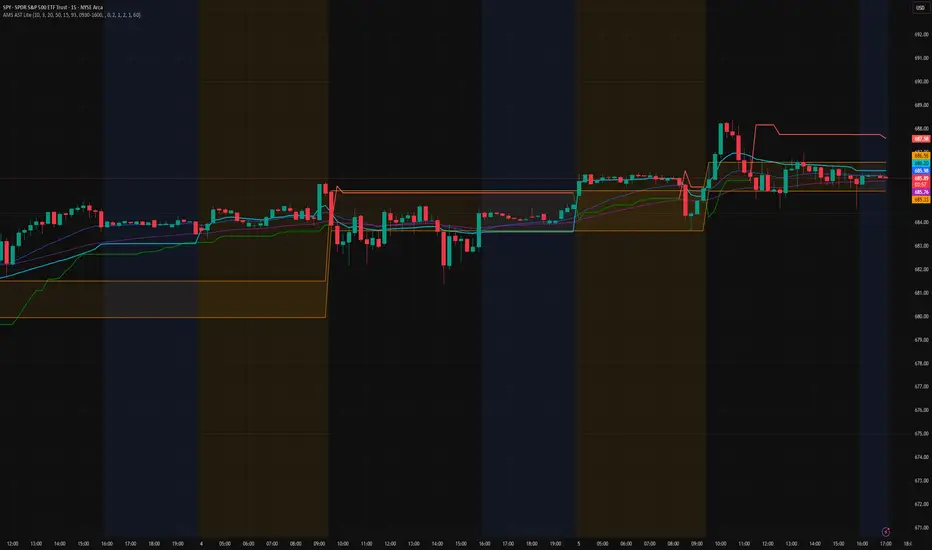
AMS Adaptive Supertrend Lite – ORB + VWAP 1.0AMS Adaptive Supertrend Lite – ORB + VWAP
This indicator focuses on providing a clean read of trend, structure, and opening range context without unnecessary complexity. It’s designed for traders who prefer straightforward visual tools that support their own decision-making process.
Consider this a small multi-tool for your basic ORB needs.
Included:
-Supertrend
A simple ATR-based Supertrend for directional context.
You can edit colors, line width, ATR settings, etc.
No signals or automation, just a clear trend reference.
-EMAs
Optional fast and slow EMAs for structural context.
Useful for gauging short-term momentum and slope.
-VWAP
A standard session VWAP.
You can style it however you like (solid, dashed, colored) in the Style tab.
-Opening Range (ORB)
Configurable ORB band including:
ORB duration (in minutes)
Optional RTH-only logic
Adjustable session window
Choice of timeframe used to build the ORB
Automatic hiding on higher timeframes (optional)
The ORB high/low are built on the selected lower timeframe and then displayed on the active chart.
-HTF Bias Shading (Optional)
A simple background tint based on EMA structure on a higher timeframe.
Meant to give gentle context, not trading signals.
Alerts
Two alerts are included:
Supertrend flipping bullish
Supertrend flipping bearish
These are notifications, not calls to action.
Intended Use
This is a visual tool for traders who want clear structure and context on their chart.
It does not provide entries, exits, strategies, or automated logic.
Disclaimer
This script is for educational and informational purposes only.
It is not financial advice, and no performance is guaranteed.
Always test tools for yourself and use proper risk management.
Trend with ADX, multiple EMAs - Buy & Sell✔ Trend Direction
Via DI+ > DI–
✔ Trend Strength
Via ADX
✔ Fast Entry Signals
5/8 EMA crossovers
✔ Larger Trend Confirmation
13/48 EMA crossovers
✔ Macro Trend
EMA 200
✔ Intraday Bias
VWAP
✔ Visual Trend (background)
✔ Alerts for signals + trend shifts

Aydan ScalperBy when EMA 8 cross EMA 21 from Below to Abouve and SELL when EMA 21 cross EMA 8 from Abouve to Belove

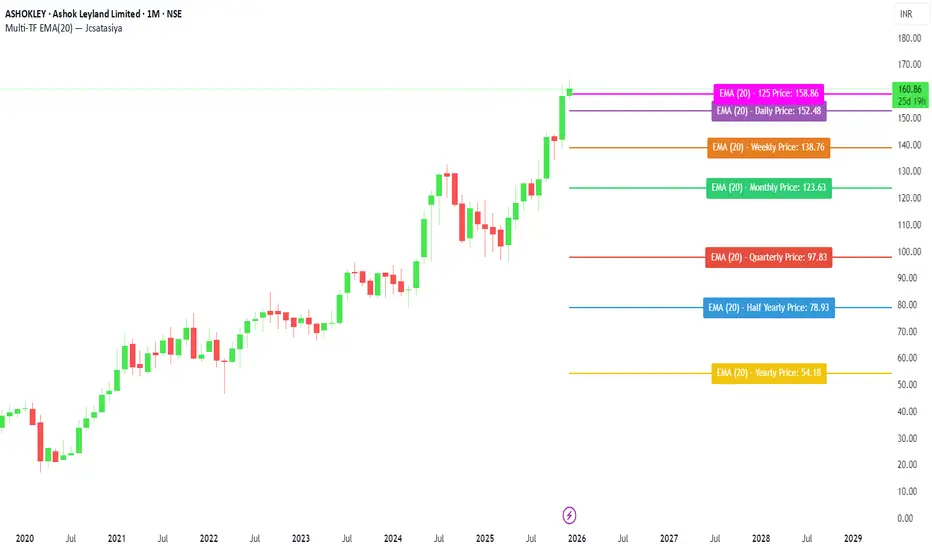
Multi-TF EMA(20) — JcsatasiyaOverview
This indicator plots 7 multi-timeframe EMA(20) lines on any chart and displays a clean dynamic label for each EMA showing:
Full timeframe name (Yearly, Half-Yearly, Quarterly, Monthly, Weekly, etc.)
EMA(20) value formatted with exactly 2 decimals
A label that is positioned automatically to the right of the latest candle
White text for maximum readability
Color-coded lines for each timeframe
All EMA lines extend horizontally and update in real-time when new candles form on the selected timeframes.
✅ Key Features
• 7 Custom Timeframes
Choose any timeframe for each EMA (Yearly, 6-Month, 3-Month, Monthly, Weekly, Daily, 4H, etc.)
• Horizontal EMA Levels
Each EMA is drawn as a fixed horizontal level, making structure and bias easier to analyze.
• Dynamic Label Placement
Labels automatically position:
Horizontally: Left, Middle, or Right of the right-side future area
Vertically: Above, Middle, or Below the EMA line
• Clean Readable Labels
Always white text
Shows: EMA (20) – Timeframe Price: 123.45
Price always displays with 2 decimals
Label style auto-adjusts based on position
• Color Customization
Each timeframe EMA has its own color picker.
• All EMA Thickness Unified
Set one line thickness for all EMA lines.
• Reliable Multi-TF Accuracy
Uses request.security() with proper lookahead handling.
⭐ Why This Indicator Is Useful
This tool makes it extremely easy to visualize where your chart sits relative to major multi-timeframe EMA levels.
You immediately see:
Higher-timeframe trend direction
Bias zones
Key support/resistance EMA levels
Long-term vs short-term trend alignment
Price interaction with institutional EMAs
Perfect for day traders, swing traders, and position traders.
📘 HOW TO USE
1️⃣ Add to Chart
After adding the indicator, open the Settings → Inputs panel.
2️⃣ Choose the 7 Timeframes
For each slot, select your desired timeframe (example setup):
Yearly
Half Yearly
Quarterly
Monthly
Weekly
Daily
4H
3️⃣ Customize Colors
Pick a different color for each EMA for clarity.
4️⃣ Choose Label Placement
Use the label position controls:
Vertical: Upper / Middle / Below
Horizontal: Left / Middle / Right (relative to right-side future space)
5️⃣ Adjust Line Thickness (Optional)
A single slider controls the thickness of all 7 EMAs.
📝 NOTES
The indicator places labels 2–50 bars into the future depending on chosen position.
Labels are always visible and readable due to white text.
EMA values always show exactly two decimals, even for crypto, indices, and forex.
Works on any market and any chart timeframe.
QuantumFlowTrader V1QuantumFlowTrader V1 — Adaptive Institutional Flow Framework
Overview
QuantumFlowTrader V1 is a precision-built visual tool that fuses institutional structure, dynamic volatility, and balance zones into one unified system.
It is designed to help traders align with the market’s internal flow without relying on lagging indicators or fixed settings.
Core Components
1. Adaptive EMA Clouds — Structural Flow
Layered exponential moving averages adapt to current conditions, clearly showing when market structure is aligned or in transition. Cloud color and intensity adjust automatically to reflect real-time directional bias.
2. Dynamic VWAP + Deviation Zones
Includes a self-adjusting VWAP with optional deviation bands (VWAP Deviation Zones) that reflect institutional fair-value areas — places where price often reacts, pauses, or mean-reverts.
The VWAP line shifts color based on price positioning.
3. Quantum ATR Engine — Multi-Layer Volatility Sync
A proprietary multi-ATR engine detects when volatility signals align in one direction across multiple sensitivities.
Arrows appear only on full directional agreement, signaling high-conviction flow moments.
4. Session Visualization + Arrow Filtering
Background shading highlights key trading sessions (Asia, London, USA).
You can optionally disable arrow signals during specific sessions for a cleaner view.
Features & Alerts
- Toggle EMA Clouds, VWAP, Deviation Zones, and ATR Arrows independently.
- Customize all colors, transparencies, and visual styles.
- Built-in alerts for bullish and bearish arrow signals.
Compatibility
Works on all assets: Forex, Crypto, Stocks, Indices, Futures.
Fully adaptive across all timeframes — intraday to swing.
No optimization needed — smart parameters adjust automatically.
Strategy Alignment Tip
QuantumFlowTrader V1 adapts to any trading strategy and acts as a directional compass for market flow.
It becomes especially powerful when combining multiple timeframes — for example, using the 1H and 15M charts to define trend alignment, and then executing entries on lower timeframes in the direction of that flow.
Note: Entry setups are defined by each trader’s individual system.
This indicator does not provide entry points — it highlights multi-timeframe alignment and directional bias.
To request access, contact via TradingView profile.

Price Action Strategy v2.0 [Ista]💎 Overview
Price Action Strategy v2.0 is a comprehensive, all-in-one institutional trading toolkit designed for visual traders who demand precision. Unlike standard indicators, this tool focuses on the narrative of price by combining advanced Market Structure, Institutional Order Flow, and Predictive Analytics into a single, non-cluttered interface.
The core philosophy of this script is "Clean Precision". It filters out noise and presents only the most critical decision-making data via smart chart overlays and a state-of-the-art Analytic Dashboard.
🚀 Key Features
1. 🏛️ Institutional Order Blocks (Origin Scan Engine)
This is not a standard pivot-based OB indicator. We utilize a proprietary "Origin Scan" algorithm that:
Detects the exact origin candle responsible for a structural break (BOS).
Filters out weak blocks, keeping only the most significant institutional footprints.
Smart Management: Limits active blocks to the 3 most recent per side (Support/Resistance) to keep charts clean.
Ghost Mode: When an Order Block is broken, it doesn't just disappear; it turns into a faint "Ghost" level, allowing you to see historical reactions without visual clutter.
2. 🔮 Echo Forecast (Predictive Path)
A powerful forecasting engine based on Pattern Similarity:
Scans historical price action (Evaluation Window) to find patterns mathematically similar to the current market state.
Projects the most likely future path (Forecast Window) directly onto the chart.
Uses a cumulative calculation method to smooth out noise and provide a realistic trajectory.
Visual Coding: The forecast line thickens and changes color based on the Confidence Score (Correlation %). High confidence patterns (>80%) are highlighted in deep green.
3. 📊 ISTA Command Center (Analytic Dashboard)
A professional, compact, and right-aligned dashboard that acts as your trading HUD. It monitors 8 vital market vitals in real-time:
Market Structure: Real-time Swing trend direction.
HTF Trend: Higher Timeframe bias (Price Action based).
Momentum: Current & HTF RSI status (Overbought/Oversold).
MACD: Signal crossover status.
Smart Money Flow (MFI): Detects institutional accumulation/distribution.
Volatility (ATR%): Current market volatility percentage.
Forecast Confidence: The statistical reliability of the current Echo Forecast.
4. 📉 Dynamic EMAs
Includes three key moving averages (20, 200, 1440) with dynamic transparency logic. They fade into the background when not interacting with price, ensuring they are there when you need them but invisible when you don't.
🛠️ How to Use
Identify Trend: Look at the Dashboard. If Structure and HTF Trend align (e.g., both Bullish), look for longs.
Wait for Pullback: Wait for price to return to a Bullish Order Block.
Confirm: Check the Forecast line. Does it suggest a bounce? Check MFI and RSI on the dashboard for oversold conditions.
Execute: Use the Order Block edges for precise entry and invalidation points.
⚙️ Settings
Swing Length: Adjust sensitivity of the structure (Default: 10).
Evaluation Window: How far back the Echo Forecast looks for patterns (Default: 300).
Dashboard: Fully customizable position and size.
Developed by Soheil_kheiri | Ista Web Analytics

that1618guy EMA 9/21 Crossover ETA + ProjectionCrossover ETA + Projection to estimate when the 9 crosses the 21 and vice versa
Uses the cross up and cross down on HTF to validate trending moves

50 EMA HLC Tejas50 EMA with All important sources. Made it with 50 EMA and Based on my understanding and observations.

Multi-Filter & RSI Overheat Analyzer (Invite Only)🚀 Multi-Filter & RSI Overheat Analyzer (Invite Only)
The Trend-RSI Pro is an advanced, multi-layered analysis tool designed for invite-only subscribers. Its primary function is to provide an instant, high-conviction visual filter of current market conditions by combining three essential technical analyses: EMA trend direction, ADX trend strength, and RSI overbought/oversold momentum.
💡 Key Features and Analysis Logic
This indicator simplifies complex market structure analysis by using a dynamic Background Color filter. The color instantly tells the user the dominant market state, eliminating the need to manually check multiple windows.
The background turns Teal when the Exponential Moving Averages (EMA) are in a strong Bullish Alignment (Short > Medium > Long) and the ADX value exceeds the user-defined Strength Threshold (default 25.0), confirming a Strong Uptrend. Conversely, the background turns Red when the EMAs are in a strong Bearish Alignment (Short < Medium < Long) and the ADX confirms a Strong Downtrend. Any other combination of EMA alignment or a weak ADX reading results in a Gray background, which alerts the user to a Ranging, Weak, or Transitional Market where caution is advised.
To complement the trend analysis, the indicator features RSI Overheat Alert Icons to preemptively analyze potential trend exhaustion. When the Relative Strength Index (RSI) enters the Overbought zone (default >= 70.0), a Red Triangle Down appears above the price bar, warning of potential selling pressure. Conversely, when the RSI enters the Oversold zone (default <= 30.0), a Green Triangle Up appears below the price bar, suggesting potential buying interest.
For users who wish to confirm the underlying components, the indicator also plots the three EMA Lines (Short, Medium, Long) directly on the chart, and the raw ADX Value is plotted in a separate pane, allowing for detailed tracking of strength changes over time. All key parameters, including EMA periods, ADX thresholds, and RSI limits, are fully customizable in the settings.
⚠️ Disclaimer and Usage Guideline
This tool is strictly an analytical aid and not a trading signal or financial advice. Users should utilize the Background Color as their primary context filter, only seeking trades aligned with the indicated strong trend color. The RSI alerts serve as timely warnings for potential short-term reversals within a larger trend. Trading carries substantial risk, and this indicator must always be combined with the user's independent analysis and robust risk management strategies.

MACD Above Signal & Price Above VWAP IndicatorThis strategy provides a buy signal with a green arrow pointing up when three conditions are met. The MACD has to be above the signal line. The settings for MACD can be adjusted, but the default is the standard settings for MACD. The second condition is the price has to be above the VWAP line. The third condition is that the price of the current candle needs to be higher than the HIGH price of the previous candle.

Price Action Signals Filtered +EMA🚀 Price Action Signals Filtered + EMA (Dual Confirmation)
💡 Indicator Overview
This indicator is a powerful tool designed to identify potential trend reversals or continuations using Price Action Pivot signals, but it filters them with an Exponential Moving Average (EMA) to ensure dual confirmation.
The indicator's purpose is to generate signals only when a Price Action confirmation aligns with a confirmed market trend (above or below the EMA), thereby reducing noise and increasing signal reliability.
✨ Key Features and Logic
1. Price Action (Pivot) Detection
The indicator automatically detects local low (Pivot Low) and local high (Pivot High) points.
Pivot Low: A potential market bottom.
Pivot High: A potential market top.
2. Price Action Confirmation
After a Pivot is detected, the indicator waits for subsequent confirmation from the closing prices of the candles:
Bullish Confirmation: After a Pivot Low, the indicator requires N consecutive candles (where N is defined in the settings) to close above the previous candle's close. This indicates buying pressure.
**Bearish Confirmation: After a Pivot High, the indicator requires N consecutive candles to close below the previous candle's close. This indicates selling pressure.
3. Trend Filter (EMA) - Dual Confirmation! 🎯
This is the critical component. A confirmed Price Action signal must align with the trend defined by the Exponential Moving Average (EMA):
Bullish Signal (Buy): Generated ONLY if the Bullish Price Action Confirmation occurs while the price (Close) is ABOVE the EMA (default 20 periods).
Bearish Signal (Sell): Generated ONLY if the Bearish Price Action Confirmation occurs while the price (Close) is BELOW the EMA.
This serves as a dual confirmation, ensuring the signal is captured in the direction of the broader market trend.
📈 How to Use
Look for the Signal: Wait for the shape (triangle, circle, or arrow) to appear on the chart.
Verify Confirmation: Know that the signal has already passed through the dual filter: Price Action and EMA.
Bullish signals appear below the bar when the price is ABOVE the EMA.
Bearish signals appear above the bar when the price is BELOW the EMA.
Risk Management: Always use this indicator in combination with your risk management strategy and technical analysis.
📝 Additional Notes
The indicator uses barstate.isconfirmed to accurately plot signals on the candle close.
The EMA line is also plotted on the chart for visual trend verification.
This indicator is a tool only and does not constitute financial advice. Always perform your own analysis and research.

Trendline365 Delta V2025 (Fixa)The Trendline365 Delta is an advanced structural-reading indicator that combines multiple layers of fixed moving averages, organized by color, to reveal the real dynamics of the trend across different time horizons. It does not attempt to predict the market — instead, it accurately describes how the trend is behaving right now, allowing traders to identify acceleration, weakness, transitions, and decision points that usually go unnoticed.
The indicator is divided into color-coded bands:
Red Series → Represents ultra-short-term momentum. It serves as an immediate thermometer of strength or weakness, ideal for validating early moves and shallow pullbacks.
Yellow Series → Captures the intermediate trend. This zone acts as a powerful filter to avoid rushed entries and highlights deeper corrections within a larger trend.
Green Series → Shows the macro structure of the trend. When price consistently stays above or below this band, a clear primary direction is established.
Blue Series → The classic institutional axis, the most widely used global reference to evaluate bull markets and bear markets.
Long Blue Series → Represents the extreme long-term trend. A “gravitational floor” that only shifts when entire market cycles reverse.
In addition to the moving averages, the indicator includes a 20-period Volume Moving Average, allowing the trader to evaluate the strength behind price movements. The combination of structure (moving averages) and energy (volume) provides a clear reading of continuation, exhaustion, true breakouts, and fake breakouts.
How to use it in practice
Strong trend: price above the red/yellow bands, upward alignment, and sustained volume.
Transition: when price begins crossing from one colored band to another, especially if volume divergence is present.
Healthy corrections: low-volume pullbacks into the red/yellow zones.
Cycle change: breakouts of the green band or the 200-period level with increasing volume.
The Trendline365 Delta simplifies trend analysis and transforms the chart into an intuitive visual map, ideal for swing traders, position traders, and content creators who want to explain the market with clarity and authority.

Pivot Hourly x EMA RibbonHourly Fibonacci Pivot + EMA is an intraday analysis tool that combines hourly Fibonacci-based pivot levels with exponential moving averages (EMAs). It is designed to help traders visualize potential intraday support/resistance zones and short-term trend direction on any timeframe.
The indicator calculates pivot levels from hourly price data and then projects Fibonacci extensions and retracements around a central pivot. These levels can be used to see where price has previously reacted and where future reactions may occur. The EMAs provide an additional layer of context by highlighting the prevailing short-term trend and momentum.
Key features:
Hourly Fibonacci pivot levels (support and resistance zones derived from hourly ranges)
Multiple Fibonacci bands to show potential reaction areas above and below the central pivot
One or more configurable EMAs to show short-term trend direction and dynamic support/resistance
Works on all symbols and intraday timeframes supported by TradingView
Typical use:
Monitor how price behaves when approaching or rejecting Fibonacci pivot levels
Look for confluence between pivot zones and EMA direction or EMA bounces
Use the levels as potential areas of interest for trade planning, stop placement, or partial profit zones within your own trading system
Also have "C" Label it's mean Candle for example C1 is First Candle of the source timeframe, if the source timeframe set to 4 Hour it will be the first 4h candle, the C2 is the second 4h candle of the day.
This script is intended purely as a technical analysis tool and does not generate buy/sell signals or guarantee any particular outcome. It is not financial advice. Always combine it with your own analysis, risk management, and trading plan before making any trading decisions.

Research-Backed Intraday MTF MAsResearch-Backed Intraday Multi-Timeframe Moving Averages
A precision-tuned intraday trading indicator that displays four key moving averages across two critical timeframes:
📊 What It Shows:
- 1-Hour MAs: 75-period SMA & EMA (institutional flow patterns)
- 10-Minute MAs: 200-period SMA & EMA (intraday trend structure)
🎯 Designed For:
- Day traders seeking multi-timeframe confluence
- Identifying strong trending vs. choppy market conditions
- Support/resistance level identification
- Momentum and trend alignment signals
✨ Key Features:
- Optimized periods based on market structure analysis
- Fully customizable colors, transparency, and line widths
- Toggle each MA on/off independently
- Clean, non-cluttered chart display
- Efficient tuple-based data requests
💡 Trading Signals:
- Price above all 4 MAs = Strong bullish alignment
- Price below all 4 MAs = Strong bearish alignment
- Mixed signals = Range-bound conditions, reduce risk
Perfect for scalpers, day traders, and swing traders who want institutional-grade moving averages without the noise.

FMT Double EMA Symbol&AlertFMT_2xEMA – Trend Made Simple!
This indicator combines 2 EMA lines to clearly show trend direction, with handy features like automatic alerts, colored candle confirmation, and fully customizable colors. Perfect for spotting momentum at a glance!
It can be used on any instrument such as stocks, futures, crypto, and more, with double EMAs adjustable to fit your own trading strategy.
Pro tip: Use 2 timeframes — a higher timeframe to spot EMA rejections, and a lower timeframe to enter trades when the cross occurs. Happy trading!

FAIRPRICE_VWAP_RDFAIRPRICE_VWAP_RD
This script plots an **anchored VWAP (Volume Weighted Average Price)** that resets
based on the user-selected anchor period. It acts as a dynamic “fair value” line
that reflects where the market has actually transacted during the chosen period.
FEATURES
- Multiple anchor options: Session, Week, Month, Quarter, Year, Decade, Century,
Earnings, Dividends, or Splits.
- Intelligent handling of the “Session” anchor so it works correctly on both 1m
(resets each new day) and 1D (continuous, non-resetting VWAP).
- Manual VWAP calculation using cumulative(price * volume) and cumulative(volume),
ensuring the line is stable and works on all timeframes.
- Optional hiding of VWAP on daily or higher charts.
- Offset input for horizontal shifting if desired.
- VWAP provides a true “fair price” reference for trend, mean-reversion,
and institutional-level analysis.
PURPOSE
This indicator solves the common problem of VWAP behaving incorrectly on higher
timeframes, on synthetic data, or with unusual anchors. By implementing VWAP
manually and allowing flexible reset conditions, it functions reliably as
an institutional-style fair value benchmark across any timeframe.

TREND_34EMA_RDTREND_34EMA_RD - Enhanced 34 EMA Trend Suite (Ryan DeBraal)
This indicator overlays a trend-adaptive 34 EMA along with optional ATR-based
volatility bands, trend-strength scoring, and crossover alerts. It is built
to give a clean, fast visual read on the current trend direction, volatility,
and momentum quality.
FEATURES
-----------------------------------------------------------------------------
• Core 34 EMA Trend Line
- Standard EMA calculation (default length 34)
- Aqua coloring for clean visibility
- Adjustable line thickness
• ATR-Based Volatility Bands
- Upper and lower bands derived from ATR
- Adjustable ATR length and multiplier
- Optional shaded channel for volatility visualization
- Helps identify trend stability and over-extension
• Trend Strength Score
- Measures slope of the EMA over a lookback window
- Normalizes slope using ATR for consistency across markets
- Outputs a 0–100 score
- Auto-updating label placed at the latest bar
• Gray for weak trend
• Orange for moderate trend
• Green for strong trend
• Optional Crossover Signals
- Detects when price crosses above or below the EMA
- Can display arrows on the chart
- Built-in alert conditions
PURPOSE
-----------------------------------------------------------------------------
This suite provides a clean, minimalistic way to monitor directional bias,
volatility, and trend quality. Ideal for:
• Identifying early trend shifts
• Confirming trend continuation
• Filtering trades based on trend strength
• Detecting over-extension using volatility bands

BADSHAHI TRADINGTradingView indicator that posts buy and sell signals along with support and resistance levels, you need to develop a Pine Script that identifies key support and resistance levels and then displays buy and sell signals based on certain conditions. Here's a breakdown of how to approach this:
1. Support and Resistance Basics
Support and resistance are critical concepts in technical analysis:
Support: This is a price level where an asset tends to find buying interest, preventing the price from dropping further.
Resistance: This is a price level where selling pressure tends to increase, preventing the price from rising further.
To detect support and resistance, we typically use methods like pivot points, recent swing highs/lows, or price levels that have repeatedly reversed direction in the past.
2. Buy and Sell Signals
Buy and sell signals are often generated based on certain criteria like:
Price crossing above or below a moving average
Candlestick patterns (like Doji, engulfing)
Breakouts from support/resistance levels
In this example, we’ll consider a simple strategy where:
Buy signal is generated when the price breaks above resistance.
Sell signal is generated when the price breaks below support.
________________________________________
Warning:
• While this indicator aids in decision-making and risk management, no indicator is 100% accurate.
• Always consider broader market conditions and apply sound risk management techniques.

Nova Trades | Opening Range IndicatorNova Trades | Opening Range With Confluences
Overview
The Nova Trades ORB Simple indicator is a clean, educational implementation of Opening Range Breakout (ORB) methodology combined with Exponential Moving Average (EMA) trend filtering. This script is designed to help traders visualize market structure during the critical opening session and identify high-probability breakout opportunities.
What Makes This Implementation Unique
1. Real-Time Dynamic ORB Tracking
Unlike static ORB indicators that plot fixed levels, this script:
Updates ORB high/low levels in real-time during the opening range period
Dynamically adjusts line positions as new highs/lows form within the ORB window
Uses line.set_y1() and line.set_y2() to provide smooth, live updates without cluttering the chart
Automatically extends ORB levels into the future for easy visual reference
2. Integrated Status Dashboard
The script includes a comprehensive real-time status table that shows:
Current ORB period status (ACTIVE vs COMPLETE)
Calculated ORB range size (useful for volatility assessment)
Current price position relative to ORB levels (ABOVE/BELOW/INSIDE)
Price position relative to EMA (trend context)
First breakout direction detection (BULLISH/BEARISH/PENDING)
This dashboard eliminates the need to manually assess market conditions and provides instant decision-making information.
3. Breakout Detection Logic
The script employs a first-breakout-only tracking system that:
Waits for the ORB period to complete before flagging breakouts
Records only the first directional break after ORB completion
Prevents false signals from intraday price whipsaws
Maintains breakout status throughout the trading session for consistency
4. EMA Confluence Filter
While many ORB scripts exist and EMA is a standard indicator, this script's value lies in how they work together:
Trading Edge: The combination provides a two-factor confirmation system:
ORB Breakout = Short-term momentum shift (microstructure)
EMA Position = Intermediate trend alignment (macrostructure)
Why This Matters:
ORB breakouts above ORB high + price above EMA = Aligned bullish momentum (highest probability long setups)
ORB breakouts below ORB low + price below EMA = Aligned bearish momentum (highest probability short setups)
Conflicting signals (e.g., ORB breakout up but price below EMA) = Lower probability, potential reversal zones
5. Customizable Time Periods
Supports multiple ORB timeframes (5m, 15m, 30m, 45m, 60m) because:
Different securities have different volatility profiles
Intraday traders may prefer shorter ORB periods (5-15m)
Position traders may prefer longer ORB periods (45-60m)
Allows optimization for specific trading styles and instruments
6. Clean Visual Design
Market open line clearly marks session start
Color-coded ORB levels (customizable) for instant visual recognition
Minimal chart clutter with toggle options for each component
Data window plots for programmatic strategy access
How It Works
Opening Range Breakout (ORB) Calculation
Initialization: At 9:30 AM NY time (market open), the script begins tracking
Range Formation: During the selected timeframe (default 30 minutes):
Continuously updates the highest high → ORB High
Continuously updates the lowest low → ORB Low
Range Completion: After the ORB period ends, levels are locked
Breakout Detection: Price breaking above ORB High (bullish) or below ORB Low (bearish) triggers the breakout flag
EMA Trend Filter
Calculates exponential moving average (default 50-period, customizable 1-500)
Provides trend context: Price > EMA = uptrend, Price < EMA = downtrend
Acts as dynamic support/resistance level
Combined Strategy Logic
Why Open Source?
This script is published as open source to:
Provide educational value to the trading community
Demonstrate clean coding practices for ORB implementations
Allow traders to customize and adapt to their specific needs
Serve as a foundation for more complex strategy development
The code uses standard Pine Script functions (ta.ema(), line.new(), table.new()) intentionally to maintain transparency and educational value.
Disclaimer
This indicator is for educational and informational purposes. It does not constitute financial advice. Past performance does not guarantee future results. Always practice proper risk management.

Aarika MultiTimeFrame (AMTF)Hello Traders,
In this indicator, we're using MTF concept. I have kept the same MA type (you have option to choose type like EMA, SMA, HMA, etc from dropdown list) for both the MA length (choose your both lengths wisely to get the maximum output).
You must backtest different lengths, timeframe and MA type that suits your trading style. Given here is the default settings which i think works excellent on BTC. But again i'm not a financial advisor so please check-back and look for this indicator as a trend finder. Trade only if you have sufficiently backtested, watched their live moves and if suits your trading style!
✅ Pros of MTF (Why Traders Use It)
1. Trend clarity: The higher timeframe filters out noise and shows the real direction of the market.
2. Reduced false signals: Lower timeframe indicators often give too many signals.
MTF keeps you trading only in the higher timeframe direction.
3. Better entries: You can align HTF trend, LTF trigger, This results in higher-quality trades.
4. Helps avoid chop: Markets are usually messy on lower charts. HTF trends cut through the noise.
5. Works across all markets: Crypto, forex, stocks — MTF improves signal reliability everywhere.
❌ Cons of MTF (What You Must Be Aware of)
1. Signals come late: Since HTF candles take longer to form, signals may lag.
2. Fewer trade opportunities: Filtering signals reduces frequency. High accuracy but lower quantity.
3. Beginners may find multi-timeframe correlation harder to learn.
4. Wrong TF combinations may give bad results: Not all timeframe pairs work well.
Example: 1D + 5m is too far apart; the trend becomes irrelevant.
Happy trading!
#ShareMarketSaga

Brahmastra PremiumBrahmastra Trade System is a complete institutional trading engine designed for traders who want precision entries, clean trends, and automated risk management.
It combines multi-timeframe confirmation, ATR-based volatility logic, trend structure, and angle analytics—giving you a highly reliable and visually clean trading framework.
🔥 Key Features
✅ 1. Institutional Trend Engine (Triple Confirmation):
The trend is detected using:
Fast MA (5)
Slow SMA/EMA (51)
Custom ATR Trend (SuperTrend-like algorithm)
This three-layer confirmation ensures you only trade when the trend is solid, real, and clean.
✅ 2. Multi-Timeframe Breakout Confirmation (1-Minute)
Most retail breakouts are fake.
This indicator validates entries using lower timeframe 5-minute candle closes.
✔ Helps avoid traps
✔ Ensures genuine breakout momentum
✔ Great for intraday & swing traders
✅ 3. Smart Entry & Exit Signals
Clear on-chart signals:
Bullish Entry (Triangle Up)
Bearish Entry (Triangle Down)
Buy Exit
Sell Exit
Exit logic uses:
Fast MA breakdown
ATR trend reversal
This catches trend reversals early and protects profits.
✅ 4. Automatic SL + TP1/TP2/TP3 Projection (ATR-Based)
On every entry, Brahmastra automatically plots:
Stop Loss (SL),Target 1,Target 2,Target 3
Targets are based on volatility (ATR), not random lines. This gives:
✔ Stable stops
✔ Dynamic targets
✔ Accurate risk–reward mapping
✅ 5. Smart Trailing Stop Loss (TSL)
TSL activates only after TP1 hits.
Buy trades → TSL moves upward
Sell trades → TSL moves downward
The trailing SL never moves backward → flawless institutional money management.
✅ 6. Volume-Powered Candle Coloring
Candles change color based on:
Trend direction
Volume intensity
Makes momentum extremely easy to read:
High volume bull → Neon green
High volume bear → Neon red
✅ 7. Multi-Angle Trendline System (3 Layers)
Brahmastra auto-draws support/resistance trendlines for:
L1 (Scalp) – Short trend
L2 (Swing) – Medium trend
L3 (Macro) – Larger trend
Each trendline is analyzed for angle strength:
🚀 Parabolic (Dangerous / Vertical)
💪 Strong Trend (Ideal)
😴 Weak / Accumulation (Sideways)
This helps you see whether the market is:
About to explode
Losing strength
Moving sideways
⚠️ Disclaimer
This indicator is an advanced trading tool, NOT financial advice.
Always backtest, understand the logic, and trade responsibly.
