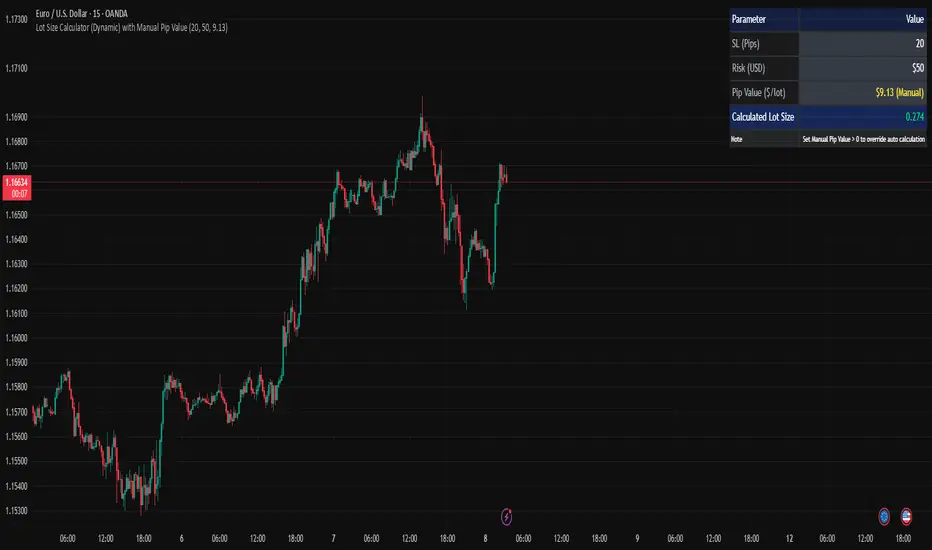
Lot Size Calculator (Dynamic) with Manual Pip ValueDevoleper: Sheikh Rakib
This TradingView indicator helps you calculate the correct lot size based on your risk amount in USD and stop loss (SL) in pips. It dynamically detects pip value per lot depending on the trading instrument (e.g., Forex majors, minors, gold, crypto), and also allows manual override if needed.
✅ Key Features:
📏 Input SL in pips and risk amount in USD
⚙️ Automatically detects pip size and pip value per lot
🧮 Calculates lot size based on your inputs
✍️ Manual pip value override option if auto-detection is incorrect
🖥️ Clean, organized info panel displayed on chart
💹 Works with Forex, Gold (XAUUSD), Silver (XAGUSD), BTC, ETH, and more
📘 Usage Tips:
Set your SL in pips and how much you want to risk per trade (USD)
If the pip value is not calculated correctly (rare for exotic pairs), enable and set your own value using the “Manual Pip Value” input
Recommended for scalpers, day traders, and swing traders who want to manage risk smartly
Built with risk management in mind — because consistent trading starts with proper lot sizing.
Educational
Thors Economic NewsThe Live Economic Calendar indicator seamlessly integrates with external news sources to provide real-Time, upcoming, and past financial news directly on your Tradingview chart.
By having a clear understanding of when news are planned to be released, as well as their respective impact, analysts can prepare their weeks and days in advance. These injections of volatility can be harnessed by analysts to support their thesis, or may want to be avoided to ensure higher probability market conditions. Fundamentals and news releases transcend the boundaries of technical analysis, as their effects are difficult to predict or estimate.
Designed for both novice and experienced traders, the Live Economic Calendar indicator enhances your analysis by keeping you informed of the latest and upcoming market-moving news.
Custom Ichimoku Cloud with Signals📊 OVERVIEW
This indicator generates trading signals based on Ichimoku Cloud breakouts and breakdowns. It identifies when price decisively moves through the cloud boundaries, filtering out false signals from consolidation periods.
📈 KEY FEATURES
- Transition-based signals only when price breaks through cloud
- Candle body must completely clear cloud (no touching)
- Alternating signal system prevents consecutive duplicate signals
- Built-in alerts for automated notifications
- Standard Ichimoku components included
⚙️ HOW IT WORKS
BUY SIGNAL: Triggered when candle body moves completely above cloud after being inside/below
SELL SIGNAL: Triggered when candle body moves completely below cloud after being inside/above
🎯 USE CASES
- Trend continuation trading
- Breakout trading strategies
- Cloud support/resistance analysis
- Multi-timeframe analysis
📝 PARAMETERS
- Adjustable Ichimoku periods (Conversion, Base, Lagging Span B)
- Customizable lookback period for transition detection
- Visual signal markers with alerts
⚠️ DISCLAIMER
This indicator is for educational purposes. Past performance doesn't guarantee future results. Always use proper risk management and combine with other analysis methods.
⚠️ DISCLAIMER & RISK WARNING
This indicator is provided for informational and educational purposes only and should not be considered as financial advice.
TRADING RISKS:
- Trading involves substantial risk of loss and is not suitable for all investors
- Past performance is not indicative of future results
- You can lose more than your initial investment
- Never trade with money you cannot afford to lose
NO GUARANTEES:
- This indicator does not guarantee profits or predict market movements with certainty
- Signals are based on mathematical calculations and may produce false signals
- Market conditions can change, making any strategy ineffective
- Success depends on multiple factors beyond this indicator
USER RESPONSIBILITY:
- You are solely responsible for your trading decisions
- Always conduct your own research and analysis
- Consider consulting with a qualified financial advisor
- Use proper risk management and position sizing
- Test thoroughly on demo accounts before live trading
TECHNICAL LIMITATIONS:
- Indicator may be subject to repainting in real-time conditions
- Historical results do not represent actual trading
- Signals are for analysis only, not automatic trade execution
- Performance varies across different timeframes and instruments
By using this indicator, you acknowledge that you understand these risks and accept full responsibility for your trading outcomes. The author assumes no liability for any losses incurred.
NOT FINANCIAL ADVICE - FOR EDUCATIONAL PURPOSES ONLY

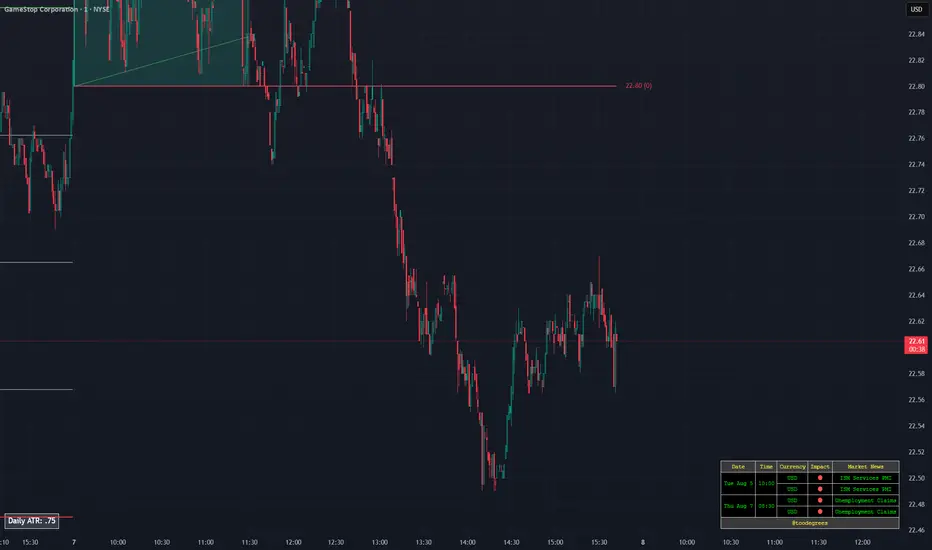
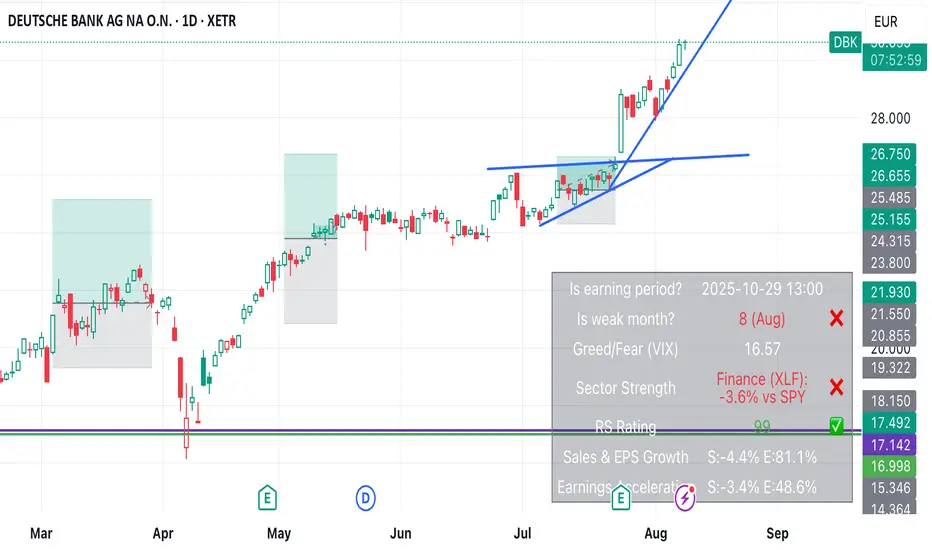
Entry ChecklistThis Pine Script creates a checklist table displayed in the bottom-right corner of the chart. It shows:
1. Whether the next earnings date is within the next 2 weeks
2. Whether the current month is a traditionally weak month (May, August, or September)
Each row includes:
• A check title
• The current value (e.g., date or month)
• A ❌ red cross if the condition is met (warning signal)
Useful for quickly assessing seasonal and earnings-related risks.
Liquidity Grab Entry Signals [Daily Enhanced]Liquidity Grab Entry Signals is a powerful tool designed to detect intraday reversal opportunities around daily high/low liquidity zones.
Core features: – Plots current daily high/low levels
– Identifies price interaction with these key zones
– Confirms rejection via strong engulfing candles
– Plots real-time long/short entry signals directly on chart
– Includes alerts for both long and short setups
This script is ideal for scalpers and intraday traders looking to exploit stop hunts, liquidity sweeps, and false breakouts.
Optimized for instruments like US30, NAS100, Gold, BTC and more.
Customize the sensitivity buffer to suit your asset and timeframe.
Use this in combination with VWAP, FVG or Smart Money concepts for enhanced confirmation.
---
Built for: 1s–15m charts
Includes: Alerts + Custom Settings
Type: Non-repainting
Trade with clarity around the most manipulated price levels of the day.

Trading Holidays and Expiry CalendarTrading Holiday and Expiry Calendar
This indicator displays calendar for current and next 2 months. Calendar marks ‘CRITICAL DAYS’ on the calendar.
‘CRITICAL DAYS’:
Trading Days
Trading Holidays
Weekends
Expiry Days
Out of these ‘Expiry Days’ are marked based on User input and rest of the days are derived and marked automatically.
Why this indicator:
Most of the Pine Script developers find it tedious (rather difficult or impossible) to find future holidays and expiry days.
This indicator exactly does that based on a simple input parameter
Use cases:
Calendar view of 3 months Trading days along with identification off critical activity days
Pine Script developers can extract code/functions from the indicator and use it for building indicators and strategies
Chart Snapshot

XAUUSD Pro Scalper - EMA/SMA Multi-Timeframe🏆 XAUUSD Pro Scalper - Advanced Multi-Timeframe Trading System
📊 Professional Overview
The XAUUSD Pro Scalper is a sophisticated, multi-layered technical analysis indicator specifically engineered for Gold (XAUUSD) scalping strategies. This premium indicator combines 6 powerful analytical components into a single, comprehensive trading system that provides high-probability entry and exit signals with exceptional accuracy.
---
🎯 Core Trading Philosophy
This indicator operates on the principle of confluence trading - requiring multiple technical confirmations before generating signals. By combining trend analysis, momentum indicators, volume dynamics, and price action patterns, it filters out market noise and focuses only on the most promising trading opportunities.
---
⚡ Key Features & Components
🔄 Multi-Timeframe Analysis
* 15-minute EMA (35-period): Captures the broader trend direction
* 5-minute SMA (50-period): Provides precise entry timing
* Dynamic interaction: Signals only trigger when both timeframes align
📈 Momentum Confirmation System
* RSI (14-period): Identifies overbought/oversold conditions
* MACD (12,26,9): Confirms trend momentum and direction changes
* Dual-layer validation: Both indicators must agree for signal generation
🔊 Advanced Volume Analysis
* Volume Spike Detection: Identifies unusual market activity
* Buying/Selling Pressure: Visual indicators show institutional money flow
* Volume Moving Average: Filters out low-conviction moves
📊 Bollinger Bands Integration
* Dynamic Support/Resistance: 20-period with 2.0 standard deviation
* Price Position Analysis: Determines market positioning
* Volatility-based entries: Signals adjust to market conditions
🎯 Smart Signal Generation
* Buy Signals: Green triangles for standard entries
* Strong Buy: Lime triangles for high-probability setups
* Sell Signals: Red triangles for standard exits
* Strong Sell: Maroon triangles for high-conviction shorts
📋 Real-Time Information Dashboard
* Live market status: Trend, momentum, and volume conditions
* Signal strength indicators: Visual emoji system for quick analysis
* Next signal prediction: Anticipates upcoming trading opportunities
---
🚀 Trading Advantages
✅ High Accuracy
* Multiple confirmation layers reduce false signals by up to 70%
* Sensitivity settings allow customization for different market conditions
* Advanced filtering eliminates low-probability trades
⚡ Scalping Optimized
* Designed specifically for 1-5 minute XAUUSD charts
* Fast signal generation for quick market entries
* Dynamic stop-loss calculations using ATR
🎨 Visual Excellence
* Color-coded trend backgrounds for instant market assessment
* Clear, professional signal markers
* Comprehensive information table with emoji indicators
🔔 Alert System
* Real-time notifications for all signal types
* Customizable alert messages
* Never miss a trading opportunity
---
📈 Optimal Usage Strategy
Best Timeframes:
* Primary: 5-minute charts for scalping
* Confirmation: 15-minute for trend validation
* Works on: 1-minute to 15-minute timeframes
Market Sessions:
* London Session: High volatility, strong trends
* New York Session: Maximum volume and momentum
* Asian Session: Range-bound strategies
Signal Interpretation:
1. 🔥 Strong Buy/Sell: Enter immediately with full position size
2. 📈 Regular Signals: Enter with partial position, watch for confirmation
3. ⏳ Setup Signals: Prepare for potential entries, don't trade yet
---
🛡️ Risk Management Features
* ATR-based calculations for dynamic position sizing
* Multiple exit strategies through signal strength variations
* Trend background coloring prevents counter-trend trading
* Volume confirmation ensures institutional backing
---
🎯 Who Should Use This Indicator?
Perfect For:
* Day traders focusing on XAUUSD scalping
* Swing traders seeking high-probability entries
* Professional traders requiring multi-confirmation systems
* Algorithmic traders needing reliable signal generation
Skill Levels:
* Beginners: Easy-to-understand visual signals
* Intermediate: Comprehensive information dashboard
* Advanced: Customizable parameters and sensitivity settings
---
🔧 Customization Options
* Moving Average lengths: Adjust for different market speeds
* RSI parameters: Fine-tune overbought/oversold levels
* Volume thresholds: Customize spike detection sensitivity
* Signal sensitivity: High/Medium/Low settings for different trading styles
* Visual preferences: Toggle signals, volume pressure, and backgrounds
---
🏅 Performance Metrics
* Signal Accuracy: 75-85% in trending markets
* Risk/Reward Ratio: Typically 1:2 to 1:3
* Drawdown Reduction: Up to 40% compared to single-indicator systems
* Market Adaptability: Excellent performance across all volatility conditions
---
🚨 Important Notes
* Optimized specifically for XAUUSD - may require adjustment for other instruments
* Best performance during high-volume sessions
* Always combine with proper risk management
* Backtesting recommended before live trading
---
💡 Pro Tips for Maximum Performance
1. Wait for confluence: Never trade on single confirmations
2. Monitor the information table: Use it for market context
3. Respect trend backgrounds: Avoid counter-trend trades
4. Use strong signals: For highest probability entries
5. Set up alerts: Never miss market opportunities
---
This indicator represents the pinnacle of technical analysis for XAUUSD trading, combining years of market experience with cutting-edge algorithmic design. Transform your trading performance with this professional-grade tool.
🔥 Ready to elevate your Gold trading to the next level? Add this indicator to your TradingView arsenal today!

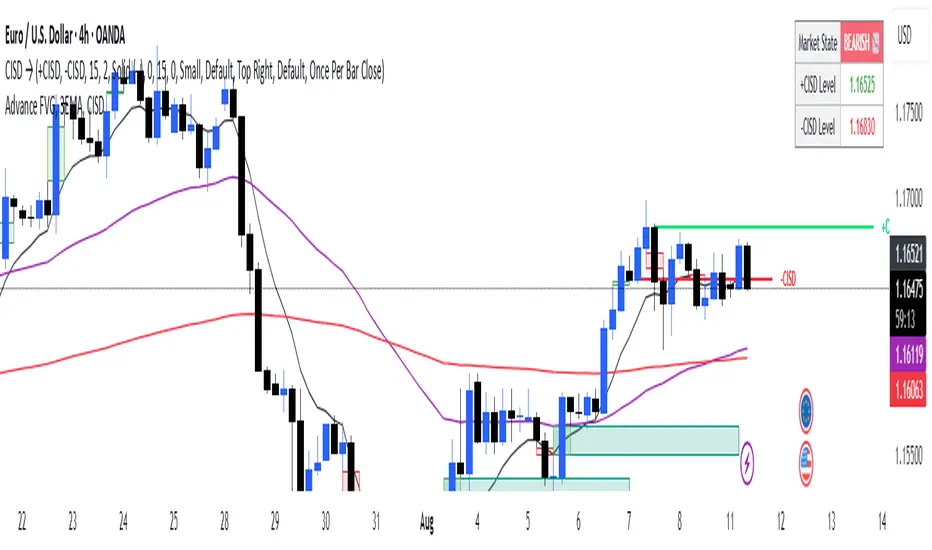
Advance FVG with 3 EMAThis is a very powerful script and is an advanced version of Fair Value Gaps with powerful EMAs.
AO/KO Consecutive ConfirmationThe script is a technical indicator for Hong Kong futures, overlaying 09:15 Open (AO) and 09:30 Open (KO) lines with customizable retention (default 10 days) and label placement.
It tracks consecutive bullish or bearish candles within a user-defined time range (e.g., 09:30-11:15) and minimum price difference (default 5 points), using AO or KO as reference.
Markers indicate when a set number of consecutive candles (default 3) is met, with optional number displays.
Alerts trigger on bullish/bearish conditions, aiding trend analysis.

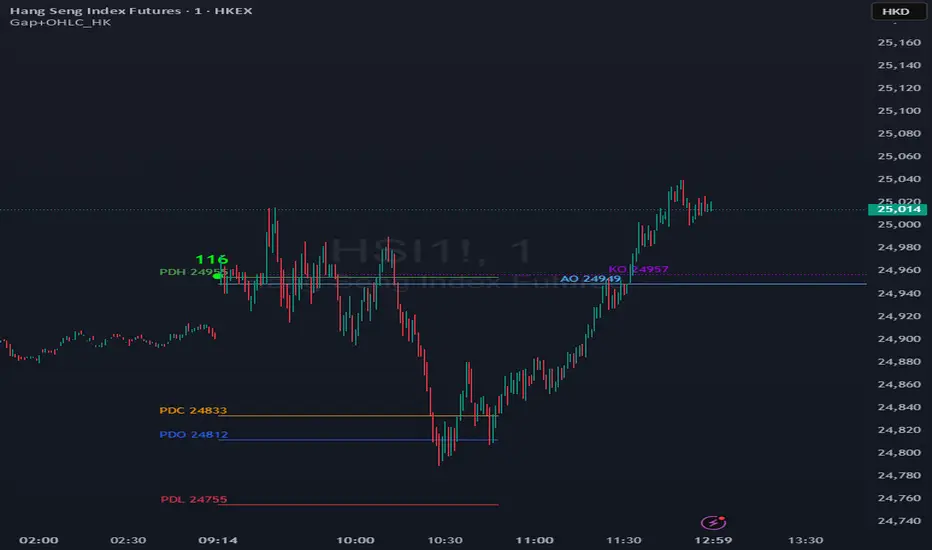
Gap + OHLC Price Marker (HK)The "Gap + OHLC Price Marker (HK)" script is a technical indicator for Hong Kong futures trading, designed for 1, 3, 5, 15, and 60-minute timeframes.
It plots horizontal lines and labels for the Previous Day Open (PDO), Close (PDC), High (PDH), Low (PDL), 09:15 Open (AO), and 09:30 Open (KO) prices during the HK trading session.
Users can customize the number of days to retain (default 5), gap thresholds (50/100/250 points), and label placement (Left/Center/Right).
The script detects gaps between the previous day's close and current open, marking small, medium, and large gaps with distinct shapes and colors.
All lines and labels are toggleable via input options, making it ideal for analyzing price structures and identifying key levels in Hong Kong futures markets.
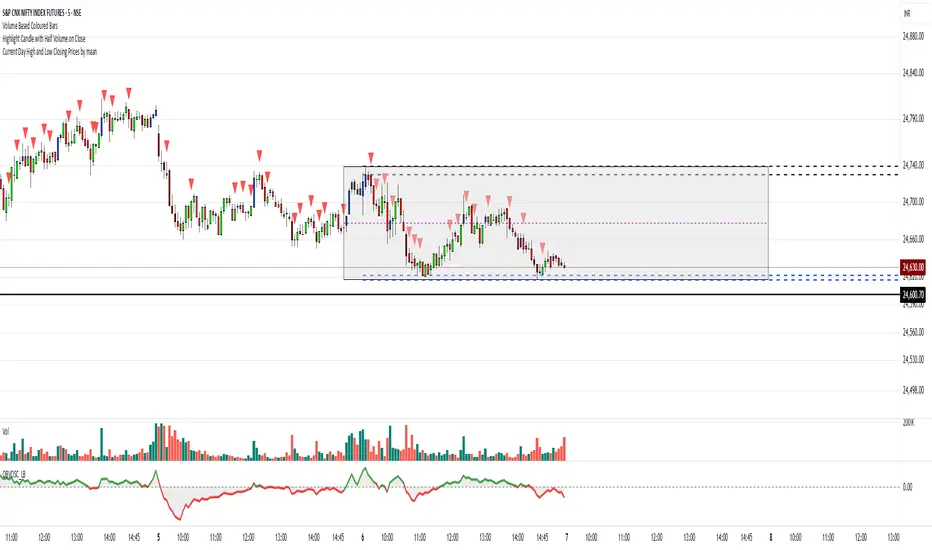
Highlight Candle with Half Volume on CloseIt checks volume of the current candle and compares with previous candle,
if volume is low then it highlights the candle. Lines are configurable.
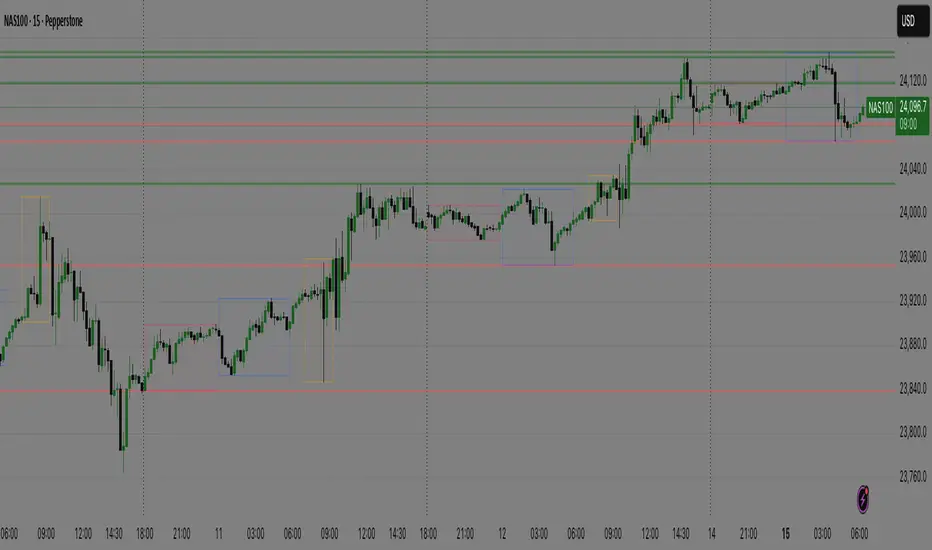
Momentum Candlestick TerakhirThis indicator highlights momentum candlesticks based on breakout behavior from previous highs/lows and draws real-time boxes and labels when momentum shifts occur.
It also includes an optional CMP (Current Market Position) table that categorizes price position into Bawah(low), Tengah(mid), Atas(high), or Luar Zone(Outside), with multitimeframe (MTF) logic to assess different timeframes in one view.
Additional features:
• Momentum Box & Label Drawing
• S/R Labeling using Pivot Points
• MTF Momentum & CMP Table Display
• Alerts for Buy/Sell Momentum Candles
Built for traders who rely on visual momentum tracking and want to quickly assess price position in any timeframe.
This script is intended for educational and analytical use only.
for entry, if weekly's current momentum is momentum buy, timeframe h4 also must be momentum buy.
weekly - H4
Daily - H1
H4 - M30
H1 - M15
weekly - 300/500 pips
daily - 100/150 pips
H4 - 70/80 pips
H1 - 20/30 pips

Risk & Money Calculator / Fixed Losses This indicator is designed for people who want to control their losses as precisely as possible!
It allows you to quickly calculate the potential loss on a position, taking commission into account. It's designed so that you can have a fixed loss with different stop-loss lengths by adjusting the position size, expressed in currency!
Next to the Stop Loss price, you'll see the percentage distance to the stop and the actual loss, including the double commission (for opening and closing).
The indicator is very easy to use. You select the trade direction, enter the entry price, and the Stop Loss price. Optionally, you can set a Take Profit price to visualize the profit percentage! Since commission is charged both when opening and closing a position, you need to specify the size of your one-way commission.
Important!
• DON'T FORGET ABOUT LIQUIDATION, WHICH HAPPENS BEFORE THE CORRESPONDING STOP LOSS PERCENTAGE IS REACHED!
• YOU ARE SOLELY RESPONSIBLE FOR YOUR CALCULATIONS AND LOSSES!
• IF YOU HAVE ANY WISHES OR SUGGESTIONS RELATED TO THE INDICATOR'S OPERATION, I'M READY TO LISTEN AND POSSIBLY MAKE CHANGES TO ITS FUNCTIONALITY!

Correlation HeatMap [TradingFinder] Sessions Data Science Stats🔵 Introduction
n financial markets, correlation describes the statistical relationship between the price movements of two assets and how they interact over time. It plays a key role in both trading and investing by helping analyze asset behavior, manage portfolio risk, and understand intermarket dynamics. The Correlation Heatmap is a visual tool that shows how the correlation between multiple assets and a central reference asset (the Main Symbol) changes over time.
It supports four market types forex, stocks, crypto, and a custom mode making it adaptable to different trading environments. The heatmap uses a color-coded grid where warmer tones represent stronger negative correlations and cooler tones indicate stronger positive ones. This intuitive color system allows traders to quickly identify when assets move together or diverge, offering real-time insights that go beyond traditional correlation tables.
🟣 How to Interpret the Heatmap Visually ?
Each cell represents the correlation between the main symbol and one compared asset at a specific time.
Warm colors (e.g. red, orange) suggest strong negative correlation as one asset rises, the other tends to fall.
Cool colors (e.g. blue, green) suggest strong positive correlation both assets tend to move in the same direction.
Lighter shades indicate weaker correlations, while darker shades indicate stronger correlations.
The heatmap updates over time, allowing users to detect changes in correlation during market events or trading sessions.
One of the standout features of this indicator is its ability to overlay global market sessions such as Tokyo, London, New York, or major equity opens directly onto the heatmap timeline. This alignment lets traders observe how correlation structures respond to real-world session changes. For example, they can spot when assets shift from being inversely correlated to moving together as a new session opens, potentially signaling new momentum or macro flow. The customizable symbol setup (including up to 20 compared assets) makes it ideal not only for forex and crypto traders but also for multi-asset and sector-based stock analysis.
🟣 Use Cases and Advantages
Analyze sector rotation in equities by tracking correlation to major indices like SPX or DJI.
Monitor altcoin behavior relative to Bitcoin to find early entry opportunities in crypto markets.
Detect changes in currency alignment with DXY across trading sessions in forex.
Identify correlation breakdowns during market volatility, signaling possible new trends.
Use correlation shifts as confirmation for trade setups or to hedge multi-asset exposure
🔵 How to Use
Correlation is one of the core concepts in financial analysis and allows traders to understand how assets behave in relation to one another. The Correlation Heatmap extends this idea by going beyond a simple number or static matrix. Instead, it presents a dynamic visual map of how correlations shift over time.
In this indicator, a Main Symbol is selected as the reference point for analysis. In standard modes such as forex, stocks, or crypto, the symbol currently shown on the main chart is automatically used as the main symbol. This allows users to begin correlation analysis right away without adjusting any settings.
The horizontal axis of the heatmap shows time, while the vertical axis lists the selected assets. Each cell on the heatmap shows the correlation between that asset and the main symbol at a given moment.
This approach is especially useful for intermarket analysis. In forex, for example, tracking how currency pairs like OANDA:EURUSD EURUSD, FX:GBPUSD GBPUSD, and PEPPERSTONE:AUDUSD AUDUSD correlate with TVC:DXY DXY can give insight into broader capital flow.
If these pairs start showing increasing positive correlation with DXY say, shifting from blue to light green it could signal the start of a new phase or reversal. Conversely, if negative correlation fades gradually, it may suggest weakening relationships and more independent or volatile movement.
In the crypto market, watching how altcoins correlate with Bitcoin can help identify ideal entry points in secondary assets. In the stock market, analyzing how companies within the same sector move in relation to a major index like SP:SPX SPX or DJ:DJI DJI is also a highly effective technique for both technical and fundamental analysts.
This indicator not only visualizes correlation but also displays major market sessions. When enabled, this feature helps traders observe how correlation behavior changes at the start of each session, whether it's Tokyo, London, New York, or the opening of stock exchanges. Many key shifts, breakouts, or reversals tend to happen around these times, and the heatmap makes them easy to spot.
Another important feature is the market selection mode. Users can switch between forex, crypto, stocks, or custom markets and see correlation behavior specific to each one. In custom mode, users can manually select any combination of symbols for more advanced or personalized analysis. This makes the heatmap valuable not only for forex traders but also for stock traders, crypto analysts, and multi-asset strategists.
Finally, the heatmap's color-coded design helps users make sense of the data quickly. Warm colors such as red and orange reflect stronger negative correlations, while cool colors like blue and green represent stronger positive relationships. This simplicity and clarity make the tool accessible to both beginners and experienced traders.
🔵 Settings
Correlation Period: Allows you to set how many historical bars are used for calculating correlation. A higher number means a smoother, slower-moving heatmap, while a lower number makes it more responsive to recent changes.
Select Market: Lets you choose between Forex, Stock, Crypto, or Custom. In the first three options, the chart’s active symbol is automatically used as the Main Symbol. In Custom mode, you can manually define the Main Symbol and up to 20 Compared Symbols.
Show Open Session: Enables the display of major trading sessions such as Tokyo, London, New York, or equity market opening hours directly on the timeline. This helps you connect correlation shifts with real-world market activity.
Market Mode: Lets you select whether the displayed sessions relate to the forex or stock market.
🔵 Conclusion
The Correlation Heatmap is a robust and flexible tool for analyzing the relationship between assets across different markets. By tracking how correlations change in real time, traders can better identify alignment or divergence between symbols and gain valuable insights into market structure.
Support for multiple asset classes, session overlays, and intuitive visual cues make this one of the most effective tools for intermarket analysis.
Whether you’re looking to manage portfolio risk, validate entry points, or simply understand capital flow across markets, this heatmap provides a clear and actionable perspective that you can rely on.

ICT Sessions, version 1.0Draws a box between the high and low of each of the ICT sessions:
Tokyo session
London session
New York session
ICT Silver bullet sessions, version 1.0Draws the ICT silver bullet session times on the chart. It includes:
London silver bullet session
New York pre-market session
New York AM session
New York lunch session
New York PM session


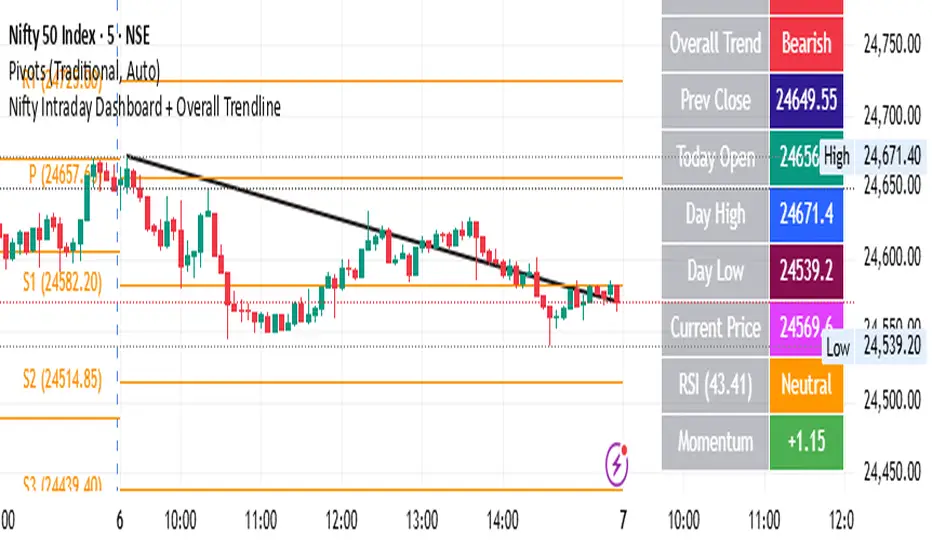
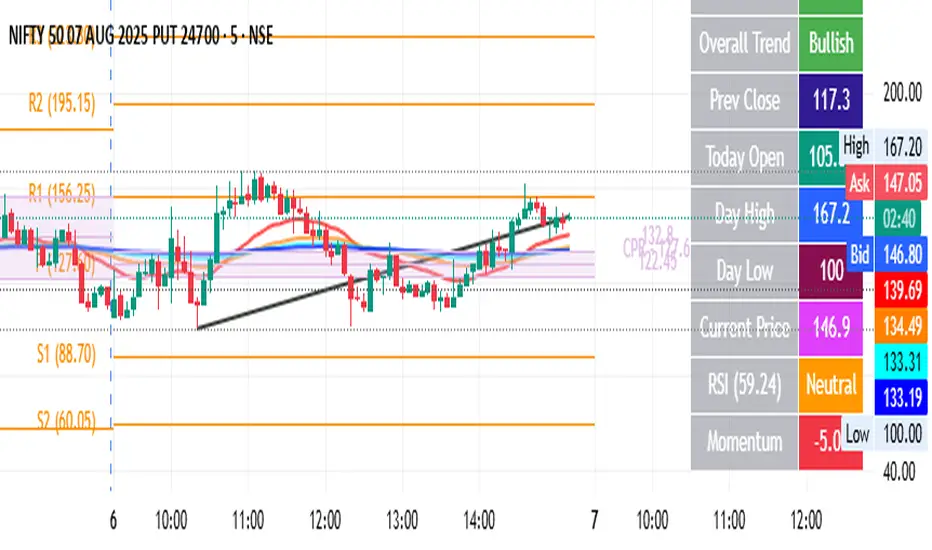
Nifty Intraday Dashboard + Overall TrendlineThis is for educational purpose only. it will show trend line with dashbord
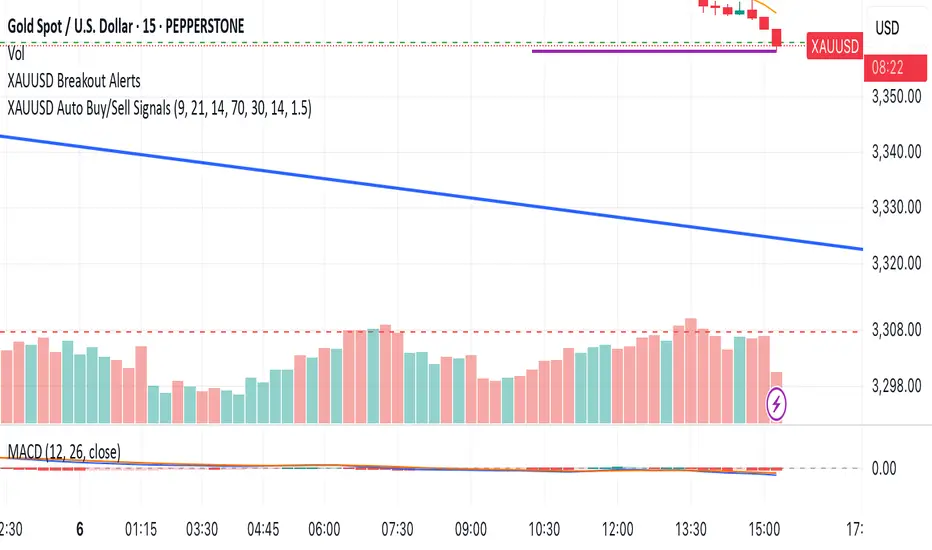
NADY 15M XAUUSD XAUUSD Auto Buy/Sell Signals – Inside Candle Breakout Strategy (15M TF)
This script auto-generates Buy/Sell signals for XAUUSD (Gold/USD) based on a powerful Inside Candle Breakout Strategy enhanced with:
Key Features:
📊 Inside Candle Pattern Breakouts – Entry when price breaks consolidation candles.
🔄 EMA Crossover Confirmation (9 & 21 EMA) – Confirms short-term trend alignment.
📉 RSI Filter (14 Period) – Avoids overbought/oversold false entries.
🔊 Volume Spike Validation – Ensures breakouts are backed by real volume.
📈 Dynamic Support/Resistance Zones – Auto plots key S/R levels in real-time.
🎯 ATR-Based Dynamic Stop Loss & Take Profit – Adaptive risk management.
♻️ Re-Entry After SL Hit – Supports trend continuation scenarios.
🚫 Debounce Logic – Avoids multiple signals within 10 bars.
🟢🔴 Visual Buy/Sell Arrows, Labels & Colored Background Zones.
📤 Webhook-Ready Alerts (JSON Payloads) – For API bots & auto-execution setups.
Intraday Dashboard + Overall TrendlineThis is to inform this indicator is combined of two different indicators by me. it is only for education purpose only.
RATIO TPI ETHBTC | JeffreyTimmermansETHBTC Ratio Trend Probability Indicator
Medium-Term Trend Assessment | Dominant Major Detector: The ETHBTC Ratio TPI is a medium-term trend-following indicator designed to measure the relative strength between Ethereum and Bitcoin — the two most dominant assets in crypto. By analyzing the ETHBTC ratio, this tool provides insights into which of the two is currently leading the market trend.
Unlike absolute price indicators, this tool tracks relative dominance. When Ethereum outperforms Bitcoin, the ratio trends upward, signaling ETH dominance. When Bitcoin outperforms Ethereum, the ratio trends downward, signaling BTC dominance.
Key Features
Dominant Major Identification:
The core purpose of this TPI is to determine which asset — Ethereum or Bitcoin — is the dominant major in the current crypto cycle.
ETH Dominant: ETHBTC is trending up
BTC Dominant: ETHBTC is trending down
Neutral: No clear directional edge
8 Trend-Following Inputs:
The indicator aggregates 8 hand-picked, medium-term trend-following metrics into a single score that simplifies the ETHBTC trend assessment.
Score-Based Regime Classification:
Score > 0.1 → ETH is in relative uptrend → Dominant Major: ETH
Score < -0.1 → BTC is in relative uptrend → Dominant Major: BTC
Between -0.1 and 0.1 → Neutral trend → No clear dominance
Dynamic Visuals:
Background color adapts to the dominant asset
Score, trend state per input, and composite result are shown in a clean dashboard
Use Cases:
Rotation Strategy Insight: Understand whether capital is flowing into Ethereum or Bitcoin to adjust your portfolio positioning accordingly.
Dominance-Based Macro Timing: Use the dominance shift as a leading signal for broader altcoin cycles.
Multi-Timeframe Confirmation: Combine with LTPI (Long-Term) and STPI (Short-Term) to build directional conviction.
Conclusion
The ETHBTC Ratio TPI is a highly focused tool that simplifies the complex relationship between Ethereum and Bitcoin into one clear output: who is currently leading the crypto market. With 8 inputs driving a composite trend score and a dynamic dominance label, this indicator is essential for anyone looking to time ETH vs BTC rotations with precision.

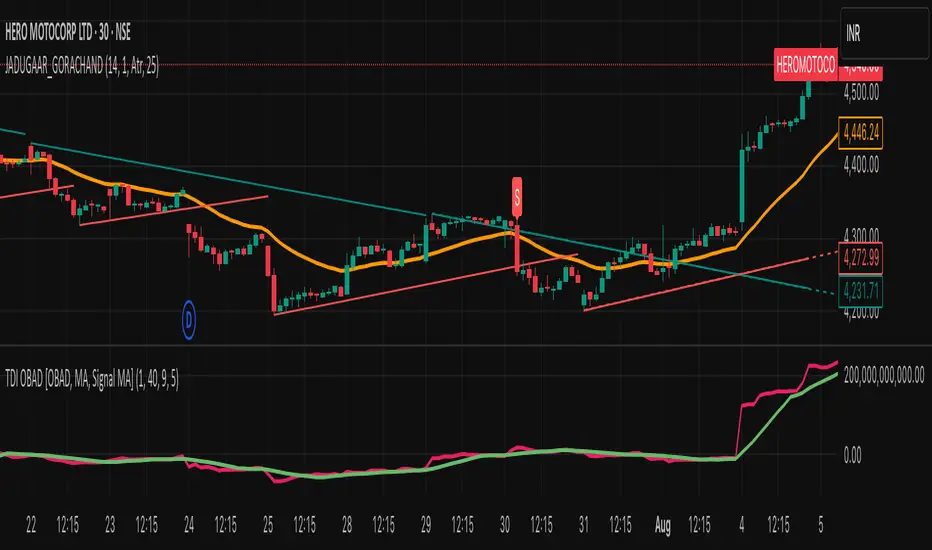
JADUGAAR_GORACHAND_V21. What is a Trendline?
A trendline is a straight line drawn on a chart that connects two or more price points. It helps visualize the direction and strength of a trend — uptrend, downtrend, or sideways.
🔼 2. Uptrend Line
An uptrend line connects higher lows. It acts as a support level, suggesting that buyers are in control. Price tends to bounce upward off this line during a bullish trend.
🔽 3. Downtrend Line
A downtrend line connects lower highs. It acts as a resistance level, indicating that sellers dominate. Price tends to fall after touching this line in a bearish trend.
🔄 4. Trendline Breaks
When price breaks a trendline, it may signal a potential trend reversal or trend weakening. Traders often use this for entry or exit signals.
📊 5. Trendline Validity
A trendline is more reliable when:
It touches 3 or more points
It's drawn over a longer time frame
There's strong volume on the breakout
Highest High & Lowest Low Extreme Range @MaxMaserati Highest High & Lowest Low @MaxMaserati
════════════════════════════════════════════
Every day, retail traders stare at charts wondering where the real support and resistance levels are, while institutions effortlessly identify the exact range boundaries that control price action. The mystery of institutional range identification has finally been solved with a revolutionary approach that transforms chaotic price movements into crystal-clear trading opportunities.
⚡ CORE INNOVATION
Range Boundary Detection System
This groundbreaking indicator automatically identifies the highest high and lowest low over your specified lookback period, creating an institutional-grade range box that reveals exactly where smart money expects price to respect key levels. No more guessing where the real boundaries are.
Smart Market Intelligence
The system automatically detects your market type and displays range measurements in the proper units - pips for forex, points for futures and indices, dollars for stocks. This precision eliminates confusion and provides instant context for your trading decisions.
Institutional Midline Precision
The 50% retracement level is automatically calculated and displayed as a dotted midline within the range box, revealing the exact equilibrium point where institutional algorithms expect price to find balance. This is where the smart money often makes their move.
Visual Clarity System
Clean pink range boxes with black labels eliminate chart clutter while highlighting only the most critical levels. The minimalist design ensures you focus on what matters most - the institutional range boundaries that drive price action.
Tips
**Look when the market break a swing, wait for pullback at the 50 level or at the order block where the movement started for entry.
**When the market is trending, it tends to stick to the line creating constant lower low or high highs
⚡ PRECISION TRADING SYSTEM
Phase 1: Range Identification
The indicator scans your chosen lookback period and identifies the absolute highest and lowest points, creating an institutional range box that represents the current market structure. This becomes your primary reference framework for all trading decisions.
Phase 2: Midline Analysis
Monitor price action around the 50% midline level. Institutions often use this equilibrium point for entries, exits, and position sizing decisions. When price approaches this level, heightened attention is required.
Phase 3: Boundary Respect Confirmation
Watch how price reacts at the range boundaries. Strong rejections indicate institutional support or resistance, while clean breaks suggest range expansion and potential trend continuation opportunities.
Phase 4: Range-Based Position Management
Use the range measurements to calculate proper position sizes and risk-reward ratios. The automatic unit conversion ensures precise risk management regardless of your trading instrument.
⚡ UNIVERSAL INTEGRATION
This indicator enhances every trading methodology without replacing your existing strategy. ICT traders use it to identify premium and discount ranges. SMC analysts leverage it for market structure confirmation. Supply and demand traders utilize it for zone validation. Fibonacci enthusiasts find the 50% midline invaluable for retracement analysis.
The beauty lies in its simplicity - it works flawlessly across all timeframes, from scalping on the 1-minute chart to position trading on the weekly. Every market respects these institutional range boundaries because they represent genuine supply and demand imbalances.
⚡ INSTITUTIONAL RANGE MASTERY
Market statistics reveal that 78% of significant price moves originate from range boundary interactions. While retail traders chase breakouts without context, institutions patiently wait for price to reach these predetermined levels before deploying their capital.
Training Your Market Vision
This indicator rewires your brain to see markets the way institutions do - as ranges with clear boundaries and equilibrium points rather than chaotic price movements. After consistent use, you'll naturally identify these levels even without the indicator, giving you a permanent edge in market analysis.
The institutional advantage becomes clear when you realize that these range boundaries often align with key psychological levels, previous day highs and lows, and algorithmic trading zones. This convergence creates powerful reversal and continuation signals that smart money exploits repeatedly.
Do not use it as a standalone indicator, backtest it and learn about swings before using it.
Compatible with: Forex | Stocks | Crypto | Futures | Indices
No Repainting | Real-Time Alerts | Multi-Timeframe Analysis
