US30 Q4_trade _levels_Jan2025updated description and use
US30 Trade Levels.plus 50% take profit levels
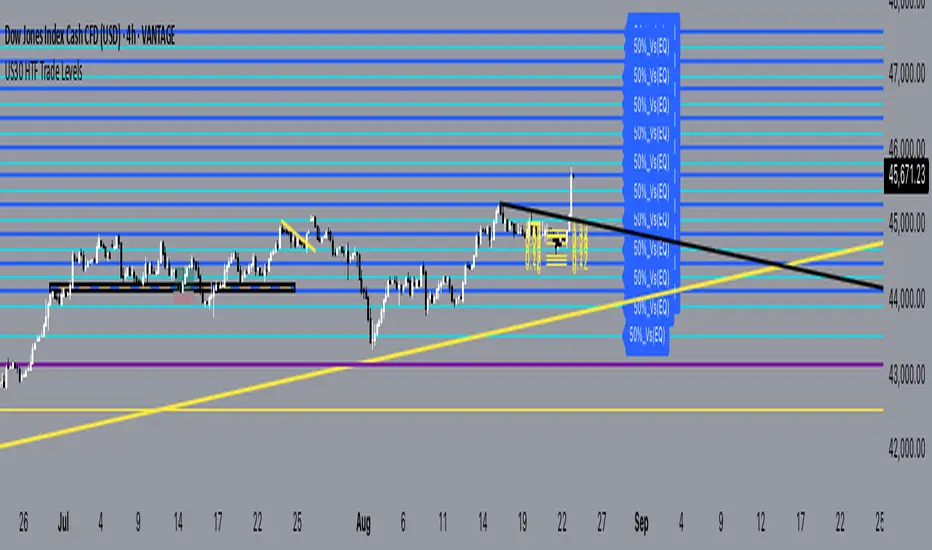
this indicator is based on the US30 quarterly theory level strategy
the difference here is that the zones have been zoom'd out for the H2 view for oversight and M30 as application theory to the Q4 levels.
The Q4 levels are spaced and calculated 385 pips apart, and also span within the daily ADR range for US30.
so these are zones that has proven to be valid going back as far as Nov2022
these are pass through levels, to together with other confluences like order blocks and or breaker blocks, will give you a guideline as to expect a valid zone of interest.
USE this indicator in conjunction with an SMC point of view to identify OB & CHOCH
Dowjones
Breadth Indicators NYSE Percent Above Moving AverageBreadth Indicators NYSE - transmits the processed data from the Barchart provider
NYSE - Breadth Indicators
S&P 500 - Breadth Indicators
DOW - Breadth Indicators
RUSSEL 1000 - Breadth Indicators
RUSSEL 2000 - Breadth Indicators
RUSSEL 3000 - Breadth Indicators
Moving Average - 5, 20, 50, 100, 150, 200
The "Percentage above 50-day SMA" indicator measures the percentage of stocks in the index trading above their 50-day moving average. It is a useful tool for assessing the general state of the market and identifying overbought and oversold conditions.
One way to use the "Percentage above 50-day SMA" indicator in a trading strategy is to combine it with a long-term moving average to determine whether the trend is bullish or bearish. Another way to use it is to combine it with a short-term moving average to identify pullbacks and rebounds within the overall trend.
The purpose of using the "Percentage above 50-day SMA" indicator is to participate in a larger trend with a better risk-reward ratio. By using this indicator to identify pullbacks and bounces, you can reduce the risk of entering trades at the wrong time.
Bull Signal Recap:
150-day EMA of $SPXA50R crosses above 52.5 and remains above 47.50 to set the bullish tone.
5-day EMA of $SPXA50R moves below 40 to signal a pullback
5-day EMA of $SPXA50R moves above 50 to signal an upturn
Bear Signal Recap:
150-day EMA of $SPXA50R crosses below 47.50 and remains below 52.50 to set the bearish tone.
5-day EMA of $SPXA50R moves above 60 to signal a bounce
5-day EMA of $SPXA50R moves below 50 to signal a downturn
Tweaking
There are numerous ways to tweak a trading system, but chartists should avoid over-optimizing the indicator settings. In other words, don't attempt to find the perfect moving average period or crossover level. Perfection is unattainable when developing a system or trading the markets. It is important to keep the system logical and focus tweaks on other aspects, such as the actual price chart of the underlying security.
What do levels above and below 50% signify in the long-term moving average?
A move above 52.5% is deemed bullish, and below 47.5% is deemed bearish. These levels help to reduce whipsaws by using buffers for bullish and bearish thresholds.
How does the short-term moving average work to identify pullbacks or bounces?
When using a 5-day EMA, a move below 40 signals a pullback, and a move above 60 signals a bounce.
How is the reversal of pullback or bounce identified?
A move back above 50 after a pullback or below 50 after a bounce signals that the respective trend may be resuming.
How can you ensure that the uptrend has resumed?
It’s important to wait for the surge above 50 to ensure the uptrend has resumed, signaling improved breadth.
Can the system be tweaked to optimize indicator settings?
While there are various ways to tweak the system, seeking perfection through over-optimizing settings is advised against. It's crucial to keep the system logical and focus tweaks on the price chart of the underlying security.
RUSSIAN \ Русская версия.
Индикатор "Процент выше 50-дневной скользящей средней" измеряет процент акций, торгующихся в индексе выше их 50-дневной скользящей средней. Это полезный инструмент для оценки общего состояния рынка и выявления условий перекупленности и перепроданности.
Один из способов использования индикатора "Процент выше 50-дневной скользящей средней" в торговой стратегии - это объединить его с долгосрочной скользящей средней, чтобы определить, является ли тренд бычьим или медвежьим. Другой способ использовать его - объединить с краткосрочной скользящей средней, чтобы выявить откаты и отскоки в рамках общего тренда.
Цель использования индикатора "Процент выше 50-дневной скользящей средней" - участвовать в более широком тренде с лучшим соотношением риска и прибыли. Используя этот индикатор для выявления откатов и отскоков, вы можете снизить риск входа в сделки в неподходящее время.
Краткое описание бычьего сигнала:
150-дневная ЕМА на уровне $SPXA50R пересекает отметку 52,5 и остается выше 47,50, что задает бычий настрой.
5-дневная ЕМА на уровне $SPXA50R опускается ниже 40, сигнализируя об откате
5-дневная ЕМА на уровне $SPXA50R поднимается выше 50, сигнализируя о росте
Обзор медвежьих сигналов:
150-дневная ЕМА на уровне $SPXA50R пересекает уровень ниже 47,50 и остается ниже 52,50, что указывает на медвежий настрой.
5-дневная ЕМА на уровне $SPXA50R поднимается выше 60, сигнализируя о отскоке
5-дневная ЕМА на уровне $SPXA50 опускается ниже 50, что сигнализирует о спаде
Корректировка
Существует множество способов настроить торговую систему, но графологам следует избегать чрезмерной оптимизации настроек индикатора. Другими словами, не пытайтесь найти идеальный период скользящей средней или уровень пересечения. Совершенство недостижимо при разработке системы или торговле на рынках. Важно поддерживать логику системы и уделять особое внимание другим аспектам, таким как график фактической цены базовой ценной бумаги.
Что означают уровни выше и ниже 50% в долгосрочной скользящей средней?
Движение выше 52,5% считается бычьим, а ниже 47,5% - медвежьим. Эти уровни помогают снизить риски, используя буферы для бычьих и медвежьих порогов.
Как краткосрочная скользящая средняя помогает идентифицировать откаты или отскоки?
При использовании 5-дневной ЕМА движение ниже 40 указывает на откат, а движение выше 60 указывает на отскок.
Как определяется разворот отката или отскока?
Движение выше 50 после отката или ниже 50 после отскока сигнализирует о возможном возобновлении соответствующего тренда.
Как вы можете гарантировать, что восходящий тренд возобновился?
Важно дождаться скачка выше 50, чтобы убедиться в возобновлении восходящего тренда, сигнализирующего о расширении диапазона.
Можно ли настроить систему для оптимизации настроек индикатора?
Хотя существуют различные способы настройки системы, не рекомендуется стремиться к совершенству с помощью чрезмерной оптимизации настроек. Крайне важно сохранить логичность системы и сфокусировать изменения на ценовом графике базовой ценной бумаги.

Market Average TrendThis indicator aims to be complimentary to SPDR Tracker , but I've adjusted the name as I've been able to utilize the "INDEX" data provider to support essentially every US market.
This is a breadth market internal indicator that allows quick review of strength given the 5, 20, 50, 100, 150 and 200 simple moving averages. Each can be toggled to build whatever combinations are desired, I recommend reviewing classic combinations such as 5 & 20 as well as 50 & 200.
It's entirely possible that I've missed some markets that "INDEX" provides data for, if you find any feel free to drop a comment and I'll add support for them in an update.
Markets currently supported:
S&P 100
S&P 500
S&P ENERGIES
S&P INFO TECH
S&P MATERIALS
S&P UTILITIES
S&P FINANCIALS
S&P REAL ESTATE
S&P CON STAPLES
S&P HEALTH CARE
S&P INDUSTRIALS
S&P TELECOM SRVS
S&P CONSUMER DISC
S&P GROWTH
NAS 100
NAS COMP
DOW INDUSTRIAL
DOW COMP
DOW UTILITIES
DOW TRANSPORTATION
RUSSELL 1000
RUSSELL 2000
RUSSELL 3000
You can utilize this to watch stocks for dip buys or potential trend continuation entries, short entries, swing exits or numerous other portfolio management strategies.
If using it with stocks, it's advisable to ensure the stock often follows the index, otherwise obviously it's great to use with major indexes and determine holdings sentiment.
Important!
The "INDEX" data provider only supplies updates to all of the various data feeds at the end of day, I've noticed quite some delays even after market close and not taken time to review their actual update schedule (if even published). Therefore, it's strongly recommended to mostly ignore the last value in the series until it's the day after.
Only works on daily timeframes and above, please don't comment that it's not working if on other timeframes lower than daily :)
Feedback and suggestions are always welcome, enjoy!

Nasdaq DowJones STOCH+RSIAlternative & UPDATED version of my previous indicator for spread trading.
This indicator can work pretty well also with other indices or correlated assets such as nasdaq100 and dax40.
The spikes from one side of the channel or the orizzontal lines signal a possible entry signal for a spread trading strategy.

DOW 30 - Market BreadthDOW 30 indicator is intended for short-term intraday analysis and should not be used solely alone. Best to use this indicator in a combination with technical and fundamental analysis.
This indicator is calculated from all stocks in the DJI as of 8/9/2022;
- Evaluating VWAP,
- 9 EMA,
- 20 EMA.
Vwap Calculations;
Stock above Vwap = 1 (Vwap Bull),
Stock below Vwap = 1 (Vwap Bear),
As there are 30 stocks in the DJI, there is a max value of 30 Vwap Bulls/ Vwap Bears.
Ema Calculation;
Stock above 9 EMA = 0.5 (EMA Bulls),
Stock below 9 EMA = 0.5 (EMA Bears),
Stock above 20 EMA = 0.5 (EMA Bulls),
Stock below 20 EMA = 0.5 (EMA Bears),
For the EMA Bulls to reach 30 all stocks must be trading above both the 9 EMA and 20 EMA to reach a Max Value of 30.
The reasoning for this calculation is to suggest the current strength and speed of the current turn in the market.
Horizontal Lines:
There are three horizontal lines, MAX, MIN & Neutral;
MAX & MIN
Resides at the 30 & 0 levels suggesting the market is currently at an extreme. Representing all stocks are moving in the same direction together.
When the MAX or MIN are represented in the VWAP Line this represents directional conviction in the underlining DJI.
Neutral
Neutral resides at the 15 level and represents that the market is either about to make a decision or is choppy.
EXAMPLE
Below are some examples of how the DOW 30 indicator is able to represent the current market conditions.
Understand Current Market Conditions, either being Bullish, Neutral, or Bearish.
See live Market Mechanics, and understand the current market direction on a short-term timeframe.
DOW 30 indicator is intended for short-term intraday analysis and should not be used solely alone. Best to use this indicator in a combination with technical and fundamental analysis.
If there are any additional requests to the indicator feel free to leave a comment or privet message.
Best of luck trading.

Nasdaq DowJones RATIOThis script gives you the ratio between the Nasdaq 100 and the Dow 30 (nas100/dow30). The RSI helps you understand when one of the two indices is overbought or oversold compared to the other one. This indicator is supposed to be of help for the strategy called spread trading, which consists in shorting an asset and buying the other one.

Function Square WaveThis is a script to draw a square wave on the chart, with an indicator for current price.
Markets undergoing Dow Jones or Wyckoff Accumulation/Distribution cycles tend to move in such waves, and if the period of the cycles are detected, a signal for accumulation/distribution phases can be created as an early warning.
Useful inputs:
- Average True Range as the wave height.
- Assumed Wave period as the wave duration.
I divided the current price wave by 2 to make the indicator more visually friendly.
GLHF
- DPT

ZoneBand (@Mido_yuiya)Bollinger band is converted to EMA , and support and resistance bands are made into regions
