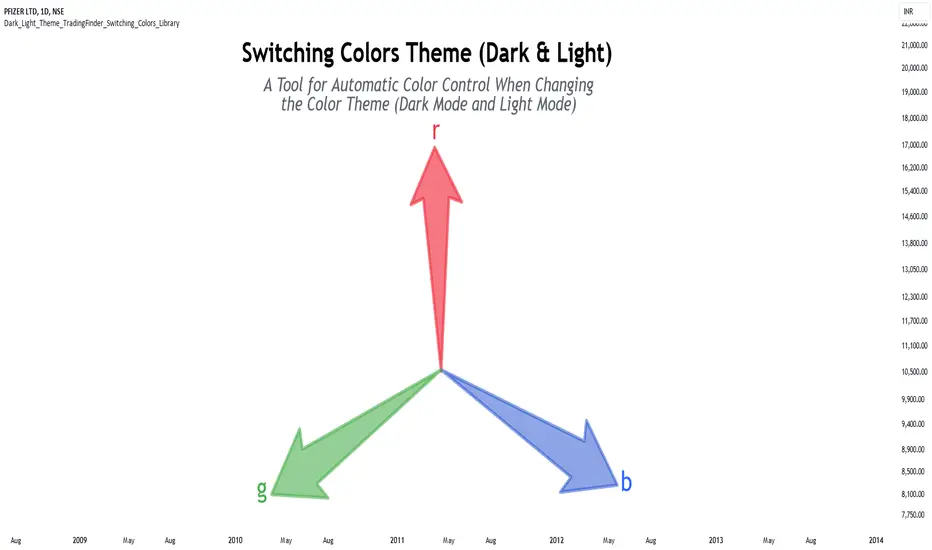
Dark & Light Theme [TradingFinder] Switching Colors Library🔵 Introduction
One of the challenges of script users is matching the colors used in indicators or strategies. By default, colors are chosen to display based on either the dark theme or the light theme.
In scripts with a large number of colors used, changing all colors to better display in dark mode or light mode can be a difficult and tedious process.
This library provides developers with the ability to adjust the colors used in their scripts based on the theme of the display.
🔵 Logic
To categorize the color spectrum, the range from 0 to 255 of all three main colors red, green and blue was divided into smaller ranges.
Blue color, which is more effective in darkening or lightening colors, is divided into 8 categories, red color into 5 categories, and green color into 3 categories, because it has little effect on darkening or brightening colors.
The combination of these categories creates 120 different modes for the color range, which leads to a more accurate identification of the color and its brightness, and helps to decide how to change it.
Except for these 120 modes, there are 2 other modes that are related to colors almost white or black, which makes a total of 122 modes.
🔵 How to Use
First, you can add the library to your code as shown in the example below.
import TFlab/Dark_Light_Theme_TradingFinder_Switching_Colors_Library/1 as SC
🟣 Parameters
SwitchingColorMode(Color, Mode) =>
Parameters:
Color (color)
Mode (string)
Color : In this parameter, enter the color you want to adjust based on light mode and dark mode.
Mode : Three modes "Off", "Light" and "Dark" are included in this parameter. "Light" mode is for color adjustment for use in "Light Mode".
"Dark" mode is for color adjustment for use in "Dark Mode" and "Off" mode turns off the color adjustment function and the input color to the function is the same as the output color.
🔵 Function Outputs
OriginalColor = input.color(color.red)
= SC.SwitchingColorMode(OriginalColor, Mode)
Display
ChartUtilsLibrary "ChartUtils"
Library for chart utilities, including managing tables
initTable(rows, cols, bgcolor)
Initializes a table with specific dimensions and color
Parameters:
rows (int) : (int) Number of rows in the table
cols (int) : (int) Number of columns in the table
bgcolor (color) : (color) Background color of the table
Returns: (table) The initialized table
updateTable(tbl, is_price_below_avg, current_investment_USD, strategy_position_size, strategy_position_avg_price, strategy_openprofit, strategy_opentrades, isBullishRate, isBearishRate, mlRSIOverSold, mlRSIOverBought)
Updates the trading table
Parameters:
tbl (table) : (table) The table to update
is_price_below_avg (bool) : (bool) If the current price is below the average price
current_investment_USD (float) : (float) The current investment in USD
strategy_position_size (float) : (float) The size of the current position
strategy_position_avg_price (float) : (float) The average price of the current position
strategy_openprofit (float) : (float) The current open profit
strategy_opentrades (int) : (int) The number of open trades
isBullishRate (bool) : (bool) If the current rate is bullish
isBearishRate (bool) : (bool) If the current rate is bearish
mlRSIOverSold (bool) : (bool) If the ML RSI is oversold
mlRSIOverBought (bool) : (bool) If the ML RSI is overbought
updateTableNoPosition(tbl)
Updates the table when there is no position
Parameters:
tbl (table) : (table) The table to update

SessionBoxLibrary "SessionBox"
This library provides functions to manage and visualize session boxes and labels on chart. A session box is a visual representation of a trading session with properties like time, name, color and the ability to track the high and low price within that session.
SessionBox
SessionBox: stores session data and provides methods to manage that data and visualize it on the chart.
Fields:
session_time (series bool)
session_name (series string)
session_color (series color)

[ALGOA+] AutofiboLibrary "Autofibo"
fibonacci(up, down, calculate, log, color1, color2, plot)
Creates an array with fibbonaci levels and plots lines.
Parameters:
up (float)
down (float)
calculate (bool)
log (bool)
color1 (color)
color2 (color)
plot (bool)
Returns: --> var float tupple.
fibonacciExtension(up, down, direction, log, calculate, color1, plot)
Fibonacci extension.
@description up (float) Up level.
@description down (float) Down level.
@description direction (string) Options "up" or "down".
Parameters:
up (float)
down (float)
direction (string)
log (bool)
calculate (bool)
color1 (color)
plot (bool)
Returns: -> var float, var float
trendFibo(uptrend, downtrend, log_option, color1, color2, plot)
Calculates automatic fibo values based on trends, returning a tupple with most important values.
Parameters:
uptrend (bool)
downtrend (bool)
log_option (bool)
color1 (color)
color2 (color)
plot (bool)
Returns:

ColourUtilitiesLibrary "ColourUtilities"
Utility functions for colour manipulation
adjust_colour(rgb, desaturation_amount, transparency_amount)
to reduce saturation or increase transparency of an RGB colour
Parameters:
rgb (color)
desaturation_amount (float) : 0 means no desaturation (colours remains as-is), and 1 means full desaturation (colour turns grey). Can also be used inversely with negative numbers
transparency_amount (float) : How much more transparent the default transparency should become. E.g. with a value of 0.5, a transparency of 0 becomes 50 and 40 becomes 70. A value of 1 makes it fully transparent, en -1 fully opaque.
Returns: color with adjusted saturation and transparency
method apply_default_palette(self, palette_name)
Some nice looking colour palettes, consisting of 6 gradient colours, are already defined here and can be quickly applied to the Palette class
Namespace types: Palette
Parameters:
self (Palette)
palette_name (string) : Currently there are 4 6-coloured palettes available: "GYTS flux signal", "GYTS purple", "GYTS flux filter" and "GYTS maroon"
Returns: None, as it populates the Palette class with pre-defined colours
method get_colour(self, colour_no, transparency)
Retrieves colour from the palette and possibly changes transparency if set
Namespace types: Palette
Parameters:
self (Palette)
colour_no (int) : from the palette
transparency (int) : to possibly change the default transparency of the palette
Returns: colour
method get_dynamic_colour(self, x, mid_point, colour_lb, colour_ub, trend_lookback, use_rate)
Retrieves a colour based on strength and direction of the passed series
Namespace types: Palette
Parameters:
self (Palette)
x (float) : the input data series
mid_point (float) : value as a cutoff point where the bullish/bearish colour scenario
colour_lb (float) : value (lower bound) where to apply the bearish colour at full strength
colour_ub (float) : value (upper bound) where to apply the bullish colour at full strength
trend_lookback (int) : how much bars back to check if there was a consistent move into a certain direction, otherwise a the neutral colour from the centre of the palette will be used.
use_rate (bool) : whether to use the rate (proportional difference with previous `x` value) or the input series `x` directly
Returns: colour
Palette
Fields:
transparency (series__integer)
palette (array__color)

Sessions KillZones Library [TradingFinder]🔵 Introduction
"The Forex Trading Sessions" highlight the active periods across different markets where significant trading volume and influence on the forex market are evident. The primary trading sessions globally include the "Asian Session," "London Session," and "New York Session."
A "Kill Zone" refers to a segment within a session characterized by high trading volume and notably sharper price movements. Consequently, there's a higher probability of encountering price action setups within these zones. Traders capitalize on this phenomenon in pursuit of more successful trading outcomes.
If you aim to integrate sessions or kill zones into your indicators or strategies, utilizing this library can amplify the precision and efficiency of your Python script development.
🔵 How to Use
First, you can add the library to your code as shown in the example below:
import TFlab/SessionAndKillZoneLibrary_TradingFinder/1
🟣 Parameters
SessionDetector(Session_Name, Session_Time, KillZone_Time, Session_Show, KillZone_Show, AreaUpdate, MoreInfo, Session_Color, Info_Color) =>
Parameters:
•Session_Name (string)
•Session_Time (string)
•KillZone_Time (string)
•Session_Show (bool)
•KillZone_Show (bool)
•AreaUpdate (string)
•MoreInfo (bool)
•Session_Color (color)
•Info_Color (color)
Session_Name : You must enter the session name in this parameter.
Session_Time : Enter here the start and end time of the session, which should be based on the UTC time zone.
KillZone_Time : Enter the start and end times of the kill zone, which should be based on the UTC time zone, here.
Session_Show : You can control whether or not to show the session using this entry. You must set true to display and false to not display.
KillZone_Show : Using this input you can control whether the kill zone is displayed or not. You must set true to display and false to not display.
AreaUpdate : If you want the session to be determined based on the time and high and low of the session itself, you must enter "Session" and if you want the area to be determined based on the time and high and low of the kill zone, you must enter "Kill Zone".
MoreInfo : If you want more information, you should set this entry to true, otherwise set to false. This information includes the number of candles in the area, the length of time in the area and the volume of transactions in the area.
Session_Color : Enter your desired color to display the session at this section. It is recommended to use bright and sharp colors.
Info_Color : Enter your desired color to display more information in this section.
🔵 Function Outputs
The outputs of this function are direct and indirect.
🟣 Indirect outputs
These outputs include session display, kill zone display, and time and volume information of session or kill zone.
🟣 Direct outputs
There are 8 direct outputs, which are:
Session Time : If the Session is active, it outputs 1, and if the Session is inactive, it outputs 0.
Kill Zone Time : If the Kill Zone is active, it outputs 1, and if the Kill Zone is inactive, it outputs 0.
Open : Session opening price.
High : The highest price of the session.
Low : The lowest price of the session.
Close : The last price of the session.
Low Touch Alert : If "Area Update" is in "Kill Zone" mode, if the price reaches the lowest price of the kill zone in the same session after the end of the kill zone, this output will be true. You can use this output to create an alert.
High Touch Alert : If "Area Update" is in "Kill Zone" mode, if the price reaches the highest price of the kill zone in the same session after the end of the kill zone, this output will be true. You can use this output to create an alert.
Important : To use "Open", "High", "Low" and "Close", "Area Update" must be in "Session" mode.

Order Block Drawing [TradingFinder]🔵 Introduction
Perhaps one of the most challenging tasks for Pine script developers (especially beginners) is properly drawing order blocks. While utilizing the latest technical analysis methods for "Price Action," beginners heavily rely on accurately plotting "Supply" and "Demand" zones, following concepts like "Smart Money Concept" and "ICT".
However, drawing "Order Blocks" may pose a challenge for developers. Therefore, to minimize bugs, increase accuracy, and speed up the process of coding order blocks, we have released the "Order Block Drawing" library.
Below, you can read more details about how to use this library.
Important :
This library has direct and indirect outputs. The indirect output includes the ranges of order blocks plotted on the chart. However, the direct output is a "Boolean" value that becomes "true" only when the price touches an order block, colloquially termed as "Mitigate." You can use this output for setting up alerts.
🔵 How to Use
First, you can add the library to your code as shown in the example below.
import TFlab/OrderBlockDrawing_TradingFinder/1
🟣Parameters
OBDrawing(OBType, TriggerCondition, DistalPrice, ProximalPrice, Index, OBValidDis, Show, ColorZone) =>
Parameters:
• OBType (string)
• TriggerCondition (bool)
• DistalPrice (float)
• ProximalPrice (float)
• Index (int)
• OBValidDis (int)
• Show (bool)
• ColorZone (color)
OBType : All order blocks are summarized into two types: "Supply" and "Demand." You should input your order block type in this parameter. Enter "Demand" for drawing demand zones and "Supply" for drawing supply zones.
TriggerCondition : Input the condition under which you want the order block to be drawn in this parameter.
DistalPrice : Generally, if each zone is formed by two lines, the farthest line from the price is termed "Distal." This input receives the price of the "Distal" line.
ProximalPrice : Generally, if each zone is formed by two lines, the nearest line to the price is termed "Proximal" line.
Index : This input receives the value of the "bar_index" at the beginning of the order block. You should store the "bar_index" value at the occurrence of the condition for the order block to be drawn and input it here.
OBValidDis : Order blocks continue to be drawn until a new order block is drawn or the order block is "Mitigate." You can specify how many candles after their initiation order blocks should continue. If you want no limitation, enter the number 4998.
Show : You may need to manage whether to display or hide order blocks. When this input is "On", order blocks are displayed, and when it's "Off", order blocks are not displayed.
ColorZone : You can input your preferred color for drawing order blocks.
🔵 Function Outputs
This function has only one output. This output is of type "Boolean" and becomes "true" only when the price touches an order block. Each order block can be touched only once and then loses its validity. You can use this output for alerts.
= Drawing.OBDrawing('Demand', Condition, Distal, Proximal, Index, 4998, true, Color)

garbage_collection_and_utilitiesGarbage Collection and Utilities is a library that offers a set of functions designed for efficient management of various types of arrays. This library provides garbage collection utilities to remove and delete excess elements, and also includes utilities for checking the size of arrays. It's particularly useful for developers who want to manage labels, lines, polylines, boxes, linefills, chart points, floats, integers, booleans, and strings efficiently within their scripts.
Both dump and trim act on the array backwards . This means that for trim , the elements that will be left start from 0. If you want the most recent element to be left after trim, you must use unshift().
Garbage Collection:
Functions to remove and delete excess elements from various types of arrays.
Useful for freeing up memory and keeping the arrays within desired size limits.
Size Checking:
Functions to check if arrays are larger than a specified size.
Helps in ensuring that arrays have enough elements before performing operations.
Supported Types:
Compatible with a wide range of array types, including labels, lines, polylines, boxes, linefills, chart points, floats, integers, booleans, and strings.
Usage:
The dump methods are ideal for clearing out unwanted elements from arrays, while the trim methods allow for more refined control over the size of arrays.
The ready methods enable you to verify if arrays have the required number of elements before proceeding with further operations.
Library "garbage_collection_and_utilities"
Provides garbage collection utilities for managing and trimming various types of arrays, and utilities to check if an array is of a specific size. Included types are: labels, lines, polylines, boxes, linefills, chart points, floats, integers, booleans, and strings.
method ready(self, size)
Checks if an array of labels is larger than a specified size
Namespace types: array
Parameters:
self (array)
size (int) : The minimum size of the array
Returns: A boolean indicating whether the array is ready
method ready(self, size)
Checks if an array of lines is larger than a specified size
Namespace types: array
Parameters:
self (array)
size (int) : The minimum size of the array
Returns: A boolean indicating whether the array is ready
method ready(self, size)
Checks if an array of polylines is larger than a specified size
Namespace types: array
Parameters:
self (array)
size (int) : The minimum size of the array
Returns: A boolean indicating whether the array is ready
method ready(self, size)
Checks if an array of boxes is larger than a specified size
Namespace types: array
Parameters:
self (array)
size (int) : The minimum size of the array
Returns: A boolean indicating whether the array is ready
method ready(self, size)
Checks if an array of linefills is larger than a specified size
Namespace types: array
Parameters:
self (array)
size (int) : The minimum size of the array
Returns: A boolean indicating whether the array is ready
method ready(self, size)
Checks if an array of chart points is larger than a specified size
Namespace types: array
Parameters:
self (array)
size (int) : The minimum size of the array
Returns: A boolean indicating whether the array is ready
method ready(self, size)
Checks if an array of floats is larger than a specified size
Namespace types: array
Parameters:
self (array)
size (int) : The minimum size of the array
Returns: A boolean indicating whether the array is ready
method ready(self, size)
Checks if an array of integers is larger than a specified size
Namespace types: array
Parameters:
self (array)
size (int) : The minimum size of the array
Returns: A boolean indicating whether the array is ready
method ready(self, size)
Checks if an array of booleans is larger than a specified size
Namespace types: array
Parameters:
self (array)
size (int) : The minimum size of the array
Returns: A boolean indicating whether the array is ready
method ready(self, size)
Checks if an array of strings is larger than a specified size
Namespace types: array
Parameters:
self (array)
size (int) : The minimum size of the array
Returns: A boolean indicating whether the array is ready
method dump(self, max_size, trigger)
Removes and deletes excess elements from an array of labels
Namespace types: array
Parameters:
self (array)
max_size (int) : The maximum size of the array
trigger (bool) : A condition to trigger the dumping process
Returns: void
method dump(self, max_size, trigger)
Removes and deletes excess elements from an array of lines
Namespace types: array
Parameters:
self (array)
max_size (int) : The maximum size of the array
trigger (bool) : A condition to trigger the dumping process
Returns: void
method dump(self, max_size, trigger)
Removes and deletes excess elements from an array of polylines
Namespace types: array
Parameters:
self (array)
max_size (int) : The maximum size of the array
trigger (bool) : A condition to trigger the dumping process
Returns: void
method dump(self, max_size, trigger)
Removes and deletes excess elements from an array of boxes
Namespace types: array
Parameters:
self (array)
max_size (int) : The maximum size of the array
trigger (bool) : A condition to trigger the dumping process
Returns: void
method dump(self, max_size, trigger)
Removes and deletes excess elements from an array of linefills
Namespace types: array
Parameters:
self (array)
max_size (int) : The maximum size of the array
trigger (bool) : A condition to trigger the dumping process
Returns: void
method dump(self, max_size, trigger)
Removes and deletes excess elements from an array of chart points
Namespace types: array
Parameters:
self (array)
max_size (int) : The maximum size of the array
trigger (bool) : A condition to trigger the dumping process
Returns: void
method dump(self, max_size, trigger)
Removes and deletes excess elements from an array of floats
Namespace types: array
Parameters:
self (array)
max_size (int) : The maximum size of the array
trigger (bool) : A condition to trigger the dumping process
Returns: void
method dump(self, max_size, trigger)
Removes and deletes excess elements from an array of integers
Namespace types: array
Parameters:
self (array)
max_size (int) : The maximum size of the array
trigger (bool) : A condition to trigger the dumping process
Returns: void
method dump(self, max_size, trigger)
Removes and deletes excess elements from an array of booleans
Namespace types: array
Parameters:
self (array)
max_size (int) : The maximum size of the array
trigger (bool) : A condition to trigger the dumping process
Returns: void
method dump(self, max_size, trigger)
Removes and deletes excess elements from an array of strings
Namespace types: array
Parameters:
self (array)
max_size (int) : The maximum size of the array
trigger (bool) : A condition to trigger the dumping process
Returns: void
method trim(self, max_size, min_size, trigger)
Removes excess elements and trims an array of labels
Namespace types: array
Parameters:
self (array)
max_size (int) : The maximum size of the array
min_size (int) : The minimum size of the array
trigger (bool) : A condition to trigger the trimming process
Returns: void
method trim(self, max_size, min_size, trigger)
Removes excess elements and trims an array of lines
Namespace types: array
Parameters:
self (array)
max_size (int) : The maximum size of the array
min_size (int) : The minimum size of the array
trigger (bool) : A condition to trigger the trimming process
Returns: void
method trim(self, max_size, min_size, trigger)
Removes excess elements and trims an array of polylines
Namespace types: array
Parameters:
self (array)
max_size (int) : The maximum size of the array
min_size (int) : The minimum size of the array
trigger (bool) : A condition to trigger the trimming process
Returns: void
method trim(self, max_size, min_size, trigger)
Removes excess elements and trims an array of boxes
Namespace types: array
Parameters:
self (array)
max_size (int) : The maximum size of the array
min_size (int) : The minimum size of the array
trigger (bool) : A condition to trigger the trimming process
Returns: void
method trim(self, max_size, min_size, trigger)
Removes excess elements and trims an array of linefills
Namespace types: array
Parameters:
self (array)
max_size (int) : The maximum size of the array
min_size (int) : The minimum size of the array
trigger (bool) : A condition to trigger the trimming process
Returns: void
method trim(self, max_size, min_size, trigger)
Removes excess elements and trims an array of chart points
Namespace types: array
Parameters:
self (array)
max_size (int) : The maximum size of the array
min_size (int) : The minimum size of the array
trigger (bool) : A condition to trigger the trimming process
Returns: void
method trim(self, max_size, min_size, trigger)
Removes excess elements and trims an array of floats
Namespace types: array
Parameters:
self (array)
max_size (int) : The maximum size of the array
min_size (int) : The minimum size of the array
trigger (bool) : A condition to trigger the trimming process
Returns: void
method trim(self, max_size, min_size, trigger)
Removes excess elements and trims an array of integers
Namespace types: array
Parameters:
self (array)
max_size (int) : The maximum size of the array
min_size (int) : The minimum size of the array
trigger (bool) : A condition to trigger the trimming process
Returns: void
method trim(self, max_size, min_size, trigger)
Removes excess elements and trims an array of booleans
Namespace types: array
Parameters:
self (array)
max_size (int) : The maximum size of the array
min_size (int) : The minimum size of the array
trigger (bool) : A condition to trigger the trimming process
Returns: void
method trim(self, max_size, min_size, trigger)
Removes excess elements and trims an array of strings
Namespace types: array
Parameters:
self (array)
max_size (int) : The maximum size of the array
min_size (int) : The minimum size of the array
trigger (bool) : A condition to trigger the trimming process
Returns: void

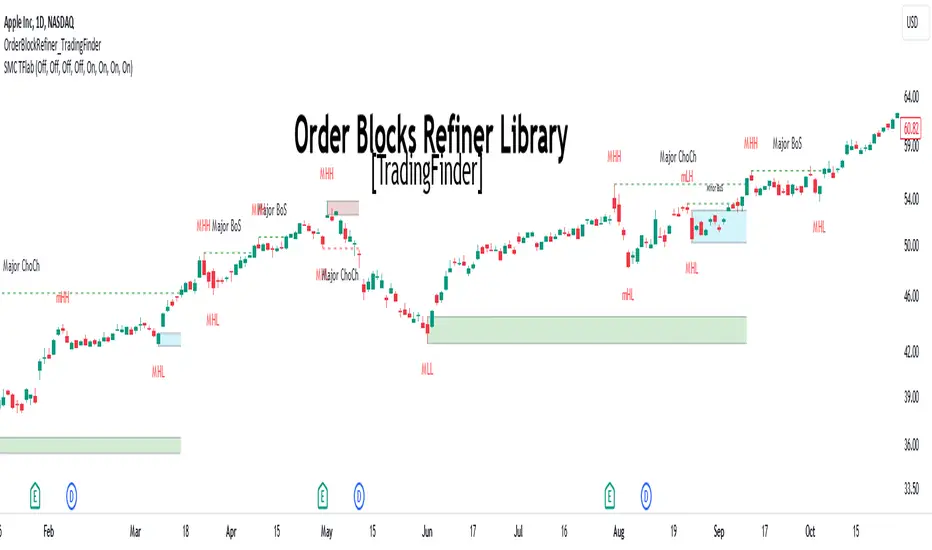
Order Block Refiner [TradingFinder]🔵 Introduction
The "Refinement" feature allows you to adjust the width of the order block according to your strategy. There are two modes, "Aggressive" and "Defensive," in the "Order Block Refine". The difference between "Aggressive" and "Defensive" lies in the width of the order block.
For risk-averse traders, the "Defensive" mode is suitable as it provides a lower loss limit and a greater reward-to-risk ratio. For risk-taking traders, the "Aggressive" mode is more appropriate. These traders prefer to enter trades at higher prices, and this mode, which has a wider order block width, is more suitable for this group of individuals.
Important :
One of the advantages of using this library is increased code accuracy. Not only does it have the capability to create order blocks, but you can also simply define the condition for order block creation (true/false) and "bar_index," and you'll find the primary range without applying any filters.
🟣 Order Block Refinement Algorithm
The order block ranges are filtered in two stages. In the first stage, the "Open," "High," "Low," and "Close" of the current order block candle, its two or three previous candles, and one subsequent candle (if available) are examined. In this stage, minimum and maximum distances are calculated, and logical range filters are applied.
In the second stage, two modes, "Aggressive" and "Defensive," are calculated.
For the "Defensive" mode, the width of these ranges is compared with the "ATR" (Average True Range) of period 55, and if they are smaller than "ATR" or 1 to more than 4 times "ATR," the width of the range is reduced from 0 to 80 percent.
For the "Aggressive" mode, you get the same output as the first filter, which usually has a wider width than the "Defensive" mode.
• Order Block Refiner : Off
• Order Block Refiner : On / "Aggressive Mode"
• Order Block Refiner : On / "Defensive Mode"
🔵 How to Use
OBRefiner(string OBType, string OBRefine, string RefineMethod, bool TriggerCondition, int Index) =>
Parameters:
• OBType (string)
• OBRefine (string)
• RefineMethod (string)
• TriggerCondition (bool)
• Index (int)
To add "Order Block Refiner Library", you must first add the following code to your script.
import TFlab/OrderBlockRefiner_TradingFinder/1
OBType : This parameter receives 2 inputs. If the order block you want to "Refine" is of type demand, you should enter "Demand," and if it's of type supply, you should enter "Supply."
OBRefine : Set to "On" if you want the "Refine" operation to be performed. Otherwise, set to "Off."
RefineMethod : This input receives 2 modes, "Aggressive" and "Defensive." You can switch between these modes according to your needs.
TriggerCondition : Enter the condition with which the order block is formed in this parameter.
Index : Enter the "bar_index" of the candle where the order block is formed in this parameter.
🟣 Function Outputs
This function has 6 outputs: "bar_index" at the beginning of the "Distal" line, "bar_index+1" at the end of the "Distal" line, "Price" at the "Distal" line, "bar_index" at the beginning of the "Proximal" line, "bar_index+1" at the end of the "Proximal" line, and "Price" at the "Proximal" line, which can be used to draw order blocks.
Sample :
= Refiner.OBRefiner('Demand', 'Off', 'Aggressive',BuMChMain_Trigger, BuMChMain_Index)
if BuMChMain_Trigger
BuMChHlineMain := line.new(BuMChMain_Xp1 , BuMChMain_Yp12 , bar_index , BuMChMain_Yp12, color = color.black , style = line.style_dotted)
BuMChLlineMain := line.new(BuMChMain_Xd1 , BuMChMain_Yd12 , bar_index , BuMChMain_Yd12, color = color.black , style = line.style_dotted)
BuMChFilineMain := linefill.new(BuMChHlineMain ,BuMChLlineMain , color = color.rgb(76, 175, 80 , 75 ) )
Alert Sender Library [TradingFinder]Library "AlertSenderLibrary_TradingFinder"
🔵 Introduction
The "Alert Sender Library" is a management and production program for "Alert Messages" that enables the creation of unique messages for any type of signal generated by indicators or strategies.
These messages include the direction of the signal, symbol, time frame, the date and time the condition was triggered, prices related to the signal, and a personal message from you. To make better and more optimal use of this "library", you should carefully study " Key Features" and "How to Use".
🔵 Key Features
Automatic Detection of Appropriate Type :
Using two parameters, "AlertType" and "DetectionType", which you must enter at the beginning into the "AlertSender" function, the type of the alert message is determined.
For example, if you select one of the "DetectionType"s such as "Order Block Signal", "Signal", and "Setup", your alert type will be chosen based on "Long" and "Short". Whether it's "Long" or "Short" depends on the "AlertType" you have set to either "Bullish" or "Bearish".
Automatic Symbol Detection :
Whenever you add an alert for a specific symbol, if you want the name of that symbol to be in your message text, you must manually write the name of the symbol in your message. One of the capabilities of the "Alert Sender" is the automatic detection of the symbol and adding it to the message text.
Automatic Time Frame Detection :
When adding your alert, the "Alert Sender" detects the time frame of the symbol you intend to add the alert for and adds it to the text. This feature is very practical and can prevent traders from making mistakes.
For example, a trader might add alerts for a specific symbol using a specific indicator in different time frames, taking the main signal in the 1-hour time frame and only a confirmation signal in the 15-minute time frame. This feature helps to identify in which time frame the signal is set.
Detection of Date and Time When the Signal is Triggered :
You can have the date and time at the moment the message is sent. This feature has various uses. For example, if you use the Webhook URL feature to send messages to a Telegram channel, there might be issues with alert delivery on your server, causing delays, and you might receive the message when it has lost its validity.
With this feature, you can match the sending time of the message from TradingView with the receipt time in your messenger and detect if there is a delay in message delivery.
Important :
You can also set the Time Zone you wish to receive the date and time based on.
Display of "Key Prices" :
Key prices can vary based on the type of signals. For example, when the "DetectionType" is in "Order Block Signal" mode, the key prices are the "Distal" and "Proximal" prices. Or if the "DetectionType" is in "Setup" mode, the key prices are "Entry", "Stop Loss", and "Take Profit".
Receipt of Personal "Messages" :
You can enter your personal message using "input.string" or "input.text_area" in addition to the messages that are automatically created.
Beautiful and Functional Display of Messages :
The titles of messages sent by "AlertSender" are displayed using related emojis to prevent mistakes due to visual errors, enhancing beauty.
🔵 How to Use
🟣 Familiarity with Function and Parameters
AlertSender(Condition, Alert, AlertName, AlertType, DetectionType, SetupData, Frequency, UTC, MoreInfo, Message, o, h, l, c, Entry, TP, SL, Distal, Proximal)
Parameters:
- Condition (bool)
- Alert (string)
- AlertName (string)
- AlertType (string)
- DetectionType (string)
- SetupData (string)
- Frequency (string)
- UTC (string)
- MoreInfo (string)
- Message (string)
- o (float)
- h (float)
- l (float)
- c (float)
- Entry (float)
- TP (float)
- SL (float)
- Distal (float)
- Proximal (float)
To add "Alert Sender Library", you must first add the following code to your script.
import TFlab/AlertSenderLibrary_TradingFinder/1
🟣 Parameters
"Condition" : This parameter is a Boolean. You need to set it based on the condition that, when met (or fired), you want to receive an alert. The output should be either "true" or "false".
"Alert" : This parameter accepts one of two inputs, "On" or "Off". If set to "On", the alarm is active; if "Off", the alarm is deactivated. This input is useful when you have numerous alerts in an indicator or strategy and need to activate only a few of them. "Alert" is a string parameter.
Alert = input.string('On', 'Alert', , 'If you turn on the Alert, you can receive alerts and notifications after setting the "Alert".', group = 'Alert')
"AlertName" : This is a string parameter where you can enter the name you choose for your alert.
AlertName = input.string('Order Blocks Finder ', 'Alert Name', group = 'Alert')
"AlertType" : The inputs for this parameter are "Bullish" or "Bearish". If the condition selected in the "Condition" parameter is of a bullish bias, you should set this parameter to "Bullish", and if the condition is of a bearish bias, it should be set to "Bearish". "AlertType" is a string parameter.
"DetectionType" : This parameter's predefined inputs include "Order Block Signal", "Signal", "Setup", and "Analysis". You may provide other inputs, but some functionalities, like "Key Price", might be lost. "DetectionType" is a string parameter.
"SetupData" :
If "DetectionType" is set to "Setup", you must specify "SetupData" as either "Basic" or "Full". In "Basic" mode, only the "Entry" price needs to be defined in the function, and "TP" (Take Profit) and "SL" (Stop Loss) can be any number or NA. In "Full" mode, you need to define "Entry", "SL", and "TP". "Setup" is a string parameter.
"Frequency" : This string parameter defines the announcement frequency. Choices include: "All" (activates the alert every time the function is called), "Once Per Bar" (activates the alert only on the first call within the bar), and "Once Per Bar Close" (the alert is activated only by a call at the last script execution of the real-time bar upon closing). The default setting is "Once per Bar".
Frequency = input.string('Once Per Bar', 'Message Frequency', , 'The triggering frequency. Possible values are: All (all function calls trigger the alert), Once Per Bar (the first function call during the bar triggers the alert), Per Bar Close (the function call triggers the alert only when it occurs during the last script iteration of the real-time bar, when it closes). The default is alert.freq_once_per_bar.', group = 'Alert')
"UTC" : With this parameter, you can set the Time Zone for the date and time of the alert's dispatch. "UTC" is a string parameter and can be set as "UTC-4", "UTC+1", "UTC+9", or any other Time Zone.
UTC = input.string('UTC', 'Show Alert time by Time Zone', group = 'Alert')
"MoreInfo" : This parameter can take one of two inputs, "On" or "Off", which are strings. Additional information, including "Time" and "Key Price", is included. If set to "On", this information is received; if "Off", it is not displayed in the sent message.
MoreInfo = input.string('On', 'Display More Info', , group = 'Alert')
"Message" : This parameter captures the user's personal message through an input and displays it at the end of the sent message. It is a string input.
MessageBull = input.text_area('Long Position', 'Long Signal Message', group = 'Alert') MessageBear = input.text_area('Short Position', 'Short Signal Message', group = 'Alert')
"o" (Open Price): A floating-point number representing the opening price of the candle. This input is necessary when the "DetectionType" is set to "Signal". Otherwise, it can be any number or "na".
"h" (High Price): A float variable for the highest price of the candle. Required when "DetectionType" is "Signal"; in other cases, any number or "na" is acceptable.
"l" (Low Price): A float representing the lowest price of the candle. This field must be filled if "DetectionType" is "Signal". If not, it can be any number or "na".
"c" (Close Price): A floating-point variable indicating the closing price of the candle. Needed for "Signal" type detections; otherwise, it can take any value or "na".
"Entry" : A float variable indicating the entry price into a trading setup. This is relevant when "DetectionType" is in "Setup" mode. In other scenarios, it can be any number or "na". It denotes the price at which the trade setup is entered.
"TP" (Take Profit): A float that is necessary when "DetectionType" is "Setup" and "SetupData" is "Full". Otherwise, it can be any number or "na". It signifies the price target for taking profits in a trading setup.
"SL" (Stop Loss): A float required when "DetectionType" is "Setup" and "SetupData" is "Full". It can be any number or "na" in other cases. This value represents the price at which a stop loss is set to limit losses.
"Distal" : A float important for "Order Block Signal" detection. It can be any number or "na" if not in use. This variable indicates the price reaching the distal line of an order block.
"Proximal" : A float needed for "Order Block Signal" detection mode. It can take any value or "na" otherwise. It marks the price reaching the proximal line of an order block.

footpint_drovingLibrary "footpint_droving"
methods for printing all footprint objects
method print_droving(foot_bar, sup)
printing all footprint objects
Namespace types: footprint_type.Footprint_bar
Parameters:
foot_bar (Footprint_bar type from dboichenko/footprint_type/1) : instance of Footprint_bar type
sup (Support_objects type from dboichenko/footprint_type/1) : instance of Support_objects type
Returns: Void.

footprint_typeLibrary "footprint_type"
Contains all types for calculating and rendering footprints
Inputs
Inputs objects
Fields:
inbalance_percent (series int) : percentage coefficient to determine the Imbalance of price levels
stacked_input (series int) : minimum number of consecutive Imbalance levels required to draw extended lines
show_summary_footprint (series bool) : bool input for show summary footprint
procent_volume_area (series int) : definition size Value area
show_vah (series bool) : bool input for show VAH
show_poc (series bool) : bool input for show POC
show_val (series bool) : bool input for show VAL
color_vah (series color) : color VAH line
color_poc (series color) : color POC line
color_val (series color) : color VAL line
show_volume_profile (series bool)
new_imbalance_cond (series bool) : bool input for setup alert on new imbalance buy and sell
new_imbalance_line_cond (series bool) : bool input for setup alert on new imbalance line buy and sell
stop_past_imbalance_line_cond (series bool) : bool input for setup alert on stop past imbalance line buy and sell
Constants
Constants all Constants objects
Fields:
imbalance_high_char (series string) : char for printing buy imbalance
imbalance_low_char (series string) : char for printing sell imbalance
color_title_sell (series color) : color for footprint sell
color_title_buy (series color) : color for footprint buy
color_line_sell (series color) : color for sell line
color_line_buy (series color) : color for buy line
color_title_none (series color) : color None
Calculation_data
Calculation_data data for calculating
Fields:
detail_open (array) : array open from calculation timeframe
detail_high (array) : array high from calculation timeframe
detail_low (array) : array low from calculation timeframe
detail_close (array) : array close from calculation timeframe
detail_vol (array) : array volume from calculation timeframe
previos_detail_close (array) : array close from calculation timeframe
isBuyVolume (series bool) : attribute previosly bar buy or sell
Footprint_row
Footprint_row objects one footprint row
Fields:
price (series float) : row price
buy_vol (series float) : buy volume
sell_vol (series float) : sell volume
imbalance_buy (series bool) : attribute buy inbalance
imbalance_sell (series bool) : attribute sell imbalance
buy_vol_box (series box) : for ptinting buy volume
sell_vol_box (series box) : for printing sell volume
buy_vp_box (series box) : for ptinting volume profile buy
sell_vp_box (series box) : for ptinting volume profile sell
row_line (series label) : for ptinting row price
empty (series bool) : = true attribute row with zero volume buy and zero volume sell
Value_area
Value_area objects for calculating and printing Value area
Fields:
vah_price (series float) : VAH price
poc_price (series float) : POC price
val_price (series float) : VAL price
vah_label (series label) : label for VAH
poc_label (series label) : label for POC
val_label (series label) : label for VAL
vah_line (series line) : line for VAH
poc_level (series line) : line for POC
val_line (series line) : line for VAL
Imbalance_line_var_object
Imbalance_line_var_object var objects printing and calculation imbalance line
Fields:
cum_buy_line (array) : line array for saving all history buy imbalance line
cum_sell_line (array) : line array for saving all history sell imbalance line
Imbalance_line
Imbalance_line objects printing and calculation imbalance line
Fields:
buy_price_line (array) : float array for saving buy imbalance price level
sell_price_line (array) : float array for saving sell imbalance price level
var_imba_line (Imbalance_line_var_object) : var objects this type
Footprint_info_var_object
Footprint_info_var_object var objects for info printing
Fields:
cum_delta (series float) : var delta volume
cum_total (series float) : var total volume
cum_buy_vol (series float) : var buy volume
cum_sell_vol (series float) : var sell volume
cum_info (series table) : table for ptinting
Footprint_info
Footprint_info objects for info printing
Fields:
var_info (Footprint_info_var_object) : var objects this type
total (series label) : total volume
delta (series label) : delta volume
summary_label (series label) : label for ptinting
Footprint_bar
Footprint_bar all objects one bar with footprint
Fields:
foot_rows (array) : objects one row footprint
val_area (Value_area) : objects Value area
imba_line (Imbalance_line) : objects imbalance line
info (Footprint_info) : objects info - table,label and their variable
row_size (series float) : size rows
total_vol (series float) : total volume one footprint bar
foot_buy_vol (series float) : buy volume one footprint bar
foot_sell_vol (series float) : sell volume one footprint bar
foot_max_price_vol (map) : map with one value - price row with max volume buy + sell
calc_data (Calculation_data) : objects with detail data from calculation resolution
Support_objects
Support_objects support object for footprint calculation
Fields:
consts (Constants) : all consts objects
inp (Inputs) : all input objects
bar_index_show_condition (series bool) : calculation bool value for show all objects footprint
row_line_color (series color) : calculation value - color for row price

ZigZag Library [TradingFinder]🔵 Introduction
The "Zig Zag" indicator is an analytical tool that emerges from pricing changes. Essentially, it connects consecutive high and low points in an oscillatory manner. This method helps decipher price changes and can also be useful in identifying traditional patterns.
By sifting through partial price changes, "Zig Zag" can effectively pinpoint price fluctuations within defined time intervals.
🔵 Key Features
1. Drawing the Zig Zag based on Pivot points :
The algorithm is based on pivots that operate consecutively and alternately (switch between high and low swing). In this way, zigzag lines are connected from a swing high to a swing low and from a swing low to a swing high.
Also, with a very low probability, it is possible to have both low pivots and high pivots in one candle. In these cases, the algorithm tries to make the best decision to make the most suitable choice.
You can control what period these decisions are based on through the "PiPe" parameter.
2.Naming and labeling each pivot based on its position as "Higher High" (HH), "Lower Low" (LL), "Higher Low" (HL), and "Lower High" (LH).
Additionally, classic patterns such as HH, LH, LL, and HL can be recognized. All traders analyzing financial markets using classic patterns and Elliot Waves can benefit from the "zigzag" indicator to facilitate their analysis.
" HH ": When the price is higher than the previous peak (Higher High).
" HL ": When the price is higher than the previous low (Higher Low).
" LH ": When the price is lower than the previous peak (Lower High).
" LL ": When the price is lower than the previous low (Lower Low).
🔵 How to Use
First, you can add the library to your code as shown in the example below.
import TFlab/ZigZagLibrary_TradingFinder/1 as ZZ
Function "ZigZag" Parameters :
🟣 Logical Parameters
1. HIGH : You should place the "high" value here. High is a float variable.
2. LOW : You should place the "low" value here. Low is a float variable.
3. BAR_INDEX : You should place the "bar_index" value here. Bar_index is an integer variable.
4. PiPe : The desired pivot period for plotting Zig Zag is placed in this parameter. For example, if you intend to draw a Zig Zag with a Swing Period of 5, you should input 5.
PiPe is an integer variable.
Important :
Apart from the "PiPe" indicator, which is part of the customization capabilities of this indicator, you can create a multi-time frame mode for the indicator using 3 parameters "High", "Low" and "BAR_INDEX". In this way, instead of the data of the current time frame, use the data of other time frames.
Note that it is better to use the current time frame data, because using the multi-time frame mode is associated with challenges that may cause bugs in your code.
🟣 Setting Parameters
5. SHOW_LINE : It's a boolean variable. When true, the Zig Zag line is displayed, and when false, the Zig Zag line display is disabled.
6. STYLE_LINE : In this variable, you can determine the style of the Zig Zag line. You can input one of the 3 options: line.style_solid, line.style_dotted, line.style_dashed. STYLE_LINE is a constant string variable.
7. COLOR_LINE : This variable takes the input of the line color.
8. WIDTH_LINE : The input for this variable is a number from 1 to 3, which is used to adjust the thickness of the line that draws the Zig Zag. WIDTH_LINE is an integer variable.
9. SHOW_LABEL : It's a boolean variable. When true, labels are displayed, and when false, label display is disabled.
10. COLOR_LABEL : The color of the labels is set in this variable.
11. SIZE_LABEL : The size of the labels is set in this variable. You should input one of the following options: size.auto, size.tiny, size.small, size.normal, size.large, size.huge.
12. Show_Support : It's a boolean variable that, when true, plots the last support line, and when false, disables its plotting.
13. Show_Resistance : It's a boolean variable that, when true, plots the last resistance line, and when false, disables its plotting.
Suggestion :
You can use the following code snippet to import Zig Zag into your code for time efficiency.
//import Library
import TFlab/ZigZagLibrary_TradingFinder/1 as ZZ
// Input and Setting
// Zig Zag Line
ShZ = input.bool(true , 'Show Zig Zag Line', group = 'Zig Zag') //Show Zig Zag
PPZ = input.int(5 ,'Pivot Period Zig Zag Line' , group = 'Zig Zag') //Pivot Period Zig Zag
ZLS = input.string(line.style_dashed , 'Zig Zag Line Style' , options = , group = 'Zig Zag' )
//Zig Zag Line Style
ZLC = input.color(color.rgb(0, 0, 0) , 'Zig Zag Line Color' , group = 'Zig Zag') //Zig Zag Line Color
ZLW = input.int(1 , 'Zig Zag Line Width' , group = 'Zig Zag')//Zig Zag Line Width
// Label
ShL = input.bool(true , 'Label', group = 'Label') //Show Label
LC = input.color(color.rgb(0, 0, 0) , 'Label Color' , group = 'Label')//Label Color
LS = input.string(size.tiny , 'Label size' , options = , group = 'Label' )//Label size
Show_Support= input.bool(false, 'Show Last Support',
tooltip = 'Last Support' , group = 'Support and Resistance')
Show_Resistance = input.bool(false, 'Show Last Resistance',
tooltip = 'Last Resistance' , group = 'Support and Resistance')
//Call Function
ZZ.ZigZag(high ,low ,bar_index ,PPZ , ShZ ,ZLS , ZLC, ZLW ,ShL , LC , LS , Show_Support , Show_Resistance )

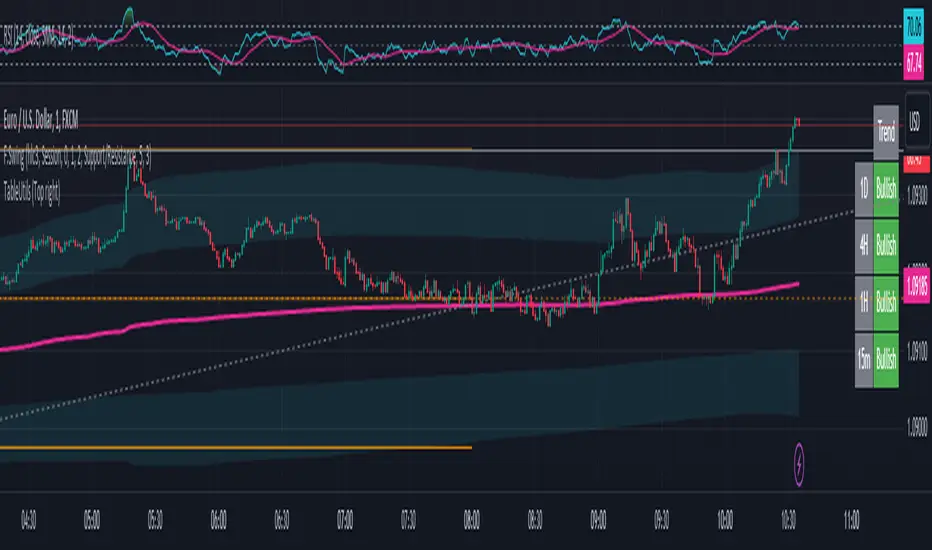
MTF TREND-PANEL-(AS)
0). INTRODUCTION: "MTF TREND-PANEL-(AS)" is a technical tool for traders who often perform multi-timeframe analysis.
This simple tool is meant for traders who wish to monitor and keep track of trend directions simultaneously on various timeframes, ranging from 1MIN to 3MONTHS (or other - 'DIFF')
script enhances decision-making efficiency and provides a clearer picture of market condition by integrating multiple timeframe analysis into a single panel.
1). WARNING!:
-script doesn't make any calculations on its own really but is more of a tool for traders to remember what is happening on other time frames
- use tooltips to navigate settings easier
2). MAIN OPTIONS:
- Keeps track of up to 7 timeframes. (NUMBER of TimeFrames setting, from 1-7)
- Customizable Display: Choose to display nothing, upward/downward arrows, or a range indication for each timeframe.
- timeframe options: '1-MIN','5-MIN','15-MIN','30-MIN','1H','4H','1D','1W','1M','3M','DIFF'
- Color Coding: Define your preferred colors for each timeframe
- set position of the table and size of text (Position/text)
- Personal Touch: Add your own trading maxim or motto for inspiration to show up when SHOW TEXT is turned on
3. )OPTIONS:
-NUMBER of TimeFrames setting: from 1-7 - how many rows to show
-SHOW TABLE: Toggle to display or hide the trend table panel.
-SHOW TEXT: Show or hide your personalized trading maxim.
-SHOW TREND: Enable to display trend direction arrows.
-SHOW_CLRS: Turn on to activate color coding for each timeframe.
-position/text size for table
-settings for each timeframe:color,time,trend
-place to type ur own text
5). How to Use the Script:
-After adding the script to your chart, use the 'NUMBER of TimeFrames' setting to select how many timeframes you want to track (1 to 7).
-Customize the appearance of each timeframe row using the color and arrow options.
-For trend analysis, the script offers arrows to indicate upward, downward, or ranging markets.
-decide what trend dominates particular TF (using other tools - script does not calculate trend on its own )
- mark trends on panel to keep track of all TF
-Enable or disable various features like the table panel, trader maxim, and color coding using the ON/OFF options.
6). just in case:
- ask me anything about the code
-don't be shy to report any bugs or offer improvements of any kind.
- originally created for @ict_whiz and made public at his request

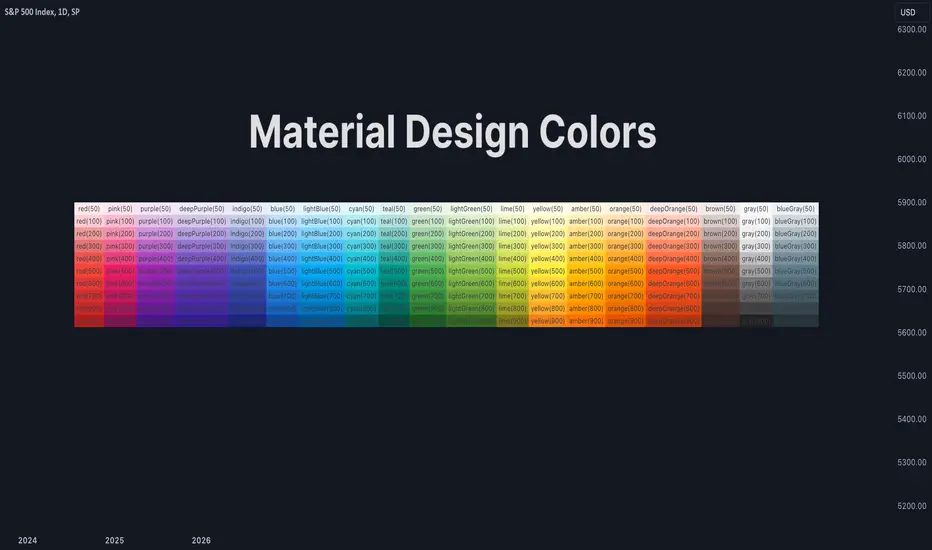
Material Design ColorsThis library provides a standard set of colors defined in Material Design 2.0.
🔵 API
Step 1: Import this library.
import algotraderdev/material/1
// remember to check the latest version of this library and replace the 1 above.
Step 2: Get the color you like. Check the source code or the screenshot above to see all the supported colors.
material.red()
Each color function (except for `black()` and `white()`) accepts an optional `variant` parameter. You can choose any of 50, 100, 200, 300, 400, 500, 600, 700, 800, and 900. By default, 500 is chosen if this parameter is not provided.
LineWrapperLibrary "LineWrapper"
Wrapper Type for Line. Useful when you want to store the line details without drawing them. Can also be used in scnearios where you collect lines to be drawn and draw together towards the end.
method draw(this)
draws line as per the wrapper object contents
Namespace types: Line
Parameters:
this (Line) : (series Line) Line object.
Returns: current Line object
method draw(this)
draws lines as per the wrapper object array
Namespace types: Line
Parameters:
this (Line ) : (series array) Array of Line object.
Returns: current Array of Line objects
method update(this)
updates or redraws line as per the wrapper object contents
Namespace types: Line
Parameters:
this (Line) : (series Line) Line object.
Returns: current Line object
method update(this)
updates or redraws lines as per the wrapper object array
Namespace types: Line
Parameters:
this (Line ) : (series array) Array of Line object.
Returns: current Array of Line objects
method delete(this)
Deletes the underlying line drawing object
Namespace types: Line
Parameters:
this (Line) : (series Line) Line object.
Returns: Current Line object
method get_price(this, bar)
get line price based on bar
Namespace types: Line
Parameters:
this (Line) : (series Line) Line object.
bar (int) : (series/int) bar at which line price need to be calculated
Returns: line price at given bar.
Line
Line Wrapper object
Fields:
p1 (chart.point)
p2 (chart.point)
xloc (series string) : (series string) See description of x1 argument. Possible values: xloc.bar_index and xloc.bar_time. Default is xloc.bar_index.
extend (series string) : (series string) If extend=extend.none, draws segment starting at point (x1, y1) and ending at point (x2, y2). If extend is equal to extend.right or extend.left, draws a ray starting at point (x1, y1) or (x2, y2), respectively. If extend=extend.both, draws a straight line that goes through these points. Default value is extend.none.
color (series color) : (series color) Line color.
style (series string) : (series string) Line style. Possible values: line.style_solid, line.style_dotted, line.style_dashed, line.style_arrow_left, line.style_arrow_right, line.style_arrow_both.
width (series int) : (series int) Line width in pixels.
obj (series line) : line object

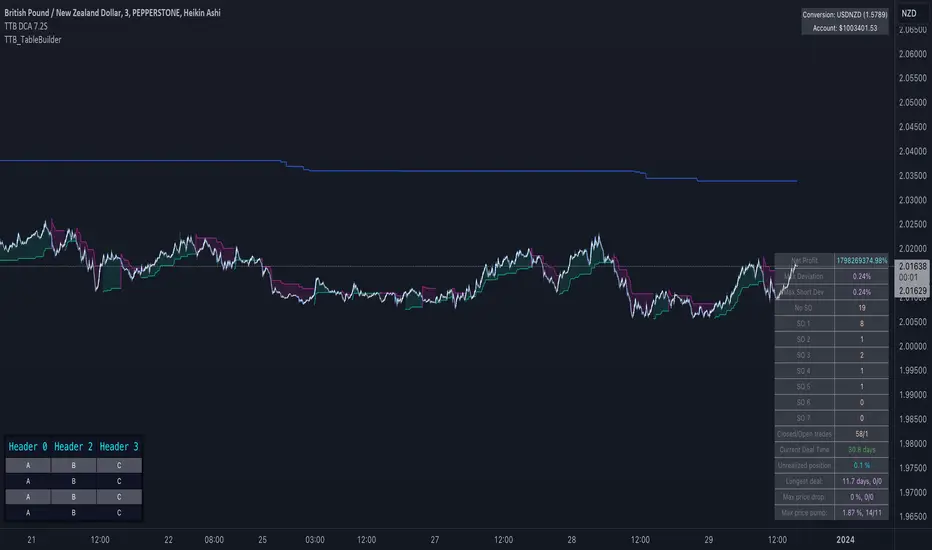
TTB_TableBuilderLibrary "TTB_TableBuilder"
A helper library to make it simpler to create tables in pinescript
DefaultDarkStyle()
method Size(this, width, height)
Change the size (width, height) of the table cell.
Namespace types: Cell
Parameters:
this (Cell)
width (int)
height (int)
Returns: Cell
method Size(this, width, height)
Change the width of all cells in that row
Namespace types: Row
Parameters:
this (Row)
width (int)
height (int)
Returns: Row
method Width(this, width)
Change the width of the table cell.
Namespace types: Cell
Parameters:
this (Cell)
width (int)
Returns: Cell
method Width(this, width)
Change the width of all cells in that row
Namespace types: Row
Parameters:
this (Row)
width (int)
Returns: Row
method Height(this, height)
Change the height of the table cell.
Namespace types: Cell
Parameters:
this (Cell)
height (int)
Returns: Cell
method Height(this, height)
Change the height of all cells in that row
Namespace types: Row
Parameters:
this (Row)
height (int)
Returns: Row
method Text(this, text_)
Change the text of the table cell.
Namespace types: Cell
Parameters:
this (Cell)
text_ (string)
Returns: Cell
method Text(this, c0, c1, c3, c4, c5, c6, c7, c8, c9, c10, c11, c12, c13, c14, c15, c16, c17, c18, c19, c20, c21, c22, c23, c24, c25, c26, c27, c28, c29)
Set text
Namespace types: Row
Parameters:
this (Row)
c0 (string) : ... c29
c1 (string)
c3 (string)
c4 (string)
c5 (string)
c6 (string)
c7 (string)
c8 (string)
c9 (string)
c10 (string)
c11 (string)
c12 (string)
c13 (string)
c14 (string)
c15 (string)
c16 (string)
c17 (string)
c18 (string)
c19 (string)
c20 (string)
c21 (string)
c22 (string)
c23 (string)
c24 (string)
c25 (string)
c26 (string)
c27 (string)
c28 (string)
c29 (string)
Returns: Row
method TextSize(this, text_size)
Change the text size of the table cell.
Namespace types: Cell
Parameters:
this (Cell)
text_size (string)
Returns: Cell
method TextSize(this, text_size)
Set text size
Namespace types: Row
Parameters:
this (Row)
text_size (string)
Returns: Row
method TextColor(this, c)
Change the text color of the table cell.
Namespace types: Cell
Parameters:
this (Cell)
c (color)
Returns: Cell
method TextColor(this, text_color)
Change the text color of all cells in that row
Namespace types: Row
Parameters:
this (Row)
text_color (color)
Returns: Row
method Bg(this, c)
Change the background color of the table cell.
Namespace types: Cell
Parameters:
this (Cell)
c (color)
Returns: Cell
method Bg(this, bg)
Change the background color of all cells in that row
Namespace types: Row
Parameters:
this (Row)
bg (color)
Returns: Row
method Font(this, text_font_family)
Change the font family of the table cell.
Namespace types: Cell
Parameters:
this (Cell)
text_font_family (string)
Returns: Cell
method Font(this, text_font_family)
Change the width of all cells in that row
Namespace types: Row
Parameters:
this (Row)
text_font_family (string)
Returns: Row
method AlignH(this, halign)
Change the horizontal align of the table cell.
Namespace types: Cell
Parameters:
this (Cell)
halign (string)
Returns: Cell
method AlignH(this, halign)
Change the horizontal align of all cells in that row
Namespace types: Row
Parameters:
this (Row)
halign (string)
Returns: Cell
method AlignV(this, valign)
Change the vertical align of the table cell.
Namespace types: Cell
Parameters:
this (Cell)
valign (string)
Returns: Cell
method AlignV(this, valign)
Change the vertical of all cells in that row
Namespace types: Row
Parameters:
this (Row)
valign (string)
Returns: Cell
method C(this, column)
Get the cell corresponding to the column number
Namespace types: Row
Parameters:
this (Row)
column (int)
Returns: Cell
method C(this, column, row)
Namespace types: Table
Parameters:
this (Table)
column (int)
row (int)
method R(this, row)
Namespace types: Table
Parameters:
this (Table)
row (int)
method Style(this, style)
Namespace types: Table
Parameters:
this (Table)
style (TableStyle)
method Position(this, position)
Namespace types: Table
Parameters:
this (Table)
position (string)
new(position, columns, rows, style)
Parameters:
position (string)
columns (int)
rows (int)
style (TableStyle)
CellStyle
Fields:
text_color (series__color)
text_halign (series__string)
text_valign (series__string)
text_size (series__integer)
bgcolor (series__color)
tooltip (series__string)
text_font_family (series__string)
TableStyle
Fields:
bgcolor (series__color)
frame_color (series__color)
frame_width (series__integer)
border_color (series__color)
border_width (series__integer)
default_cell_style (|CellStyle|#OBJ)
Cell
Fields:
ref (series__table)
column (series__integer)
row (series__integer)
Row
Fields:
ref (series__table)
row (series__integer)
cells (array__|Cell|#OBJ)
Table
Fields:
body (series__table)
rows (array__|Row|#OBJ)
Mad_FibonacciboxLibrary "Mad_Fibonaccibox"
This library is designed to create and manage multiple Fibonacci boxes, which are graphical representations based on the inputs.
-----------------
exports:
f_fib_calc(_Fibonacci_box, _itemnumber)
fibonacci calc.
@description This function block uses the levels and paramters set into the type_fibonacci_box(levels) and fills the corresponding array of prices.
Parameters:
_Fibonacci_box (type_Fibonacci_box )
_itemnumber (int)
Returns: returns a type_Fibonacci_box with the filled data
f_fib_draw(_Fibonacci_box, _itemnumber)
fibonacci draw.
@description This function block uses the levels, prices and paramters set into the type_fibonacci_box(levels) and draws the fib on the chart
Parameters:
_Fibonacci_box (type_Fibonacci_box )
_itemnumber (int)
Returns: returns lines labels and fills on the chart, no data returns
type_level
s for defining a lines and texts of a fibonacci box
Fields:
level (series float)
price (series float)
drawline (series bool)
linewidth (series int)
linetype (series string)
fiblinecolor (series color)
drawlabel (series string)
labeltext (series string)
textshift (series int)
fibtextcolor (series color)
fibtextsize (series string)
transp (series int)
type_fill
s for defining the fills of a fibonaccibox
Fields:
partner_A (series int)
partner_B (series int)
fill_color (series color)
transp (series int)
type_Fibonacci_box
s for defining a fibonacci box
Fields:
bottom_price (series float)
top_price (series float)
StartBar (series int)
StopBar (series int)
levels (type_level )
fills (type_fill )
ChartisLog (series bool)
fibreverse (series bool)
fibdrawreverse (series bool)
decimals_price (series int)
decimals_percent (series int)
drawlines (series bool)
drawlabels (series bool)
drawfills (series bool)
draw_biginfo (series bool)
biginfo_textshift (series int)
rangeinfo_location (series int)
rangeinfo_color (series color)
rangeinfo_textsize (series string)
line_array (line )
linefill_array (linefill )
label_array (label )
GuageLibrary "Gauge"
The gauge library utilizes a gaugeParams object, encapsulating crucial parameters for gauge creation. Essential attributes include num (the measured value) , min (the minimum value equating to 100% on the gauge's minimum scale) , and max (the maximum value equating to 100% on the gauge's maximum scale) . The size attribute (defaulting to 10) splits the scale into increments, each representing 100% divided by the specified size.
The num value dynamically shifts within the gauge based on its percentage move from the mathematical average between min and max . When num is below the average, the minimum portion of the scale activates, displaying the appropriate percentage based on the distance from the average to the minimum. The same principle applies when num exceeds the average. The 100% scale is reached at either end when num equals min or max .
The library offers full customization, allowing users to configure color schemes, labels, and titles. The gauge can be displayed either vertically (default) or horizontally. The colors employ a gradient, adapting based on the number's movement. Overall, the gauge library provides a flexible and comprehensive tool for visualizing and interpreting numerical values within a specified range.

TableUtilsLibrary "TableUtils"
Collection of table utility functions
getTablePositionByLabel(tablePosition)
Return the position for the table by given label. Useful if you want to control the position of the table with a pine script input selector that use a more human friendly labels
Parameters:
tablePosition (string) : (string) Label of the table position. Possible values are: "Top left", "Top right", "Bottom left", "Bottom right", "Middle left", "Middle right"
Returns: the position for the table by given label. Useful if you want to control the position of the table with a pine script input selector that use a more human friendly labels
TouchedLibrary "Touched"
Breakout(zone, lookback)
Tells if the zone has been broken on the current bar.
Parameters:
zone (Zone) : The definitiin of the zone.
lookback (int) : How many bars to look back.
Returns: a Touch object that tells if the zone has been broken up or down.
FalseBreakout(zone, lookback)
Tells if the zone has a false breakout on the current bar.
Parameters:
zone (Zone) : The definitiin of the zone.
lookback (int) : How many bars to look back.
Returns: a Touch object that tells if the zone has had a false breakout up or down.
Retest(zone, lookback)
Tells if the zone has been retested on the current bar.
Parameters:
zone (Zone) : The definitiin of the zone.
lookback (int) : How many bars to look back.
Returns: a Touch object that tells if the zone has been retested up or down.
Zone
Fields:
High (series__float)
Low (series__float)
BaseTime (series__integer)
Touch
Fields:
Up (series__bool)
Down (series__bool)

StrategyDashboardLibrary ”StrategyDashboard”
Hey, everybody!
I haven’t done anything here for a long time, I need to get better ^^.
In my strategies, so far private, but not about that, I constantly use dashboards, which clearly show how my strategy is working out.
Of course, you can also find a number of these parameters in the standard strategy window, but I prefer to display everything on the screen, rather than digging through a bunch of boxes and dropdowns.
At the moment I am using 2 dashboards, which I would like to share with you.
1. monthly(isShow)
this is a dashboard with the breakdown of profit by month in per cent. That is, it displays how much percentage you made or lost in a particular month, as well as for the year as a whole.
Parameters:
isShow (bool) - determine allowance to display or not.
2. total(isShow)
The second dashboard displays more of the standard strategy information, but in a table format. Information from the series “number of consecutive losers, number of consecutive wins, amount of earnings per day, etc.”.
Parameters:
isShow (bool) - determine allowance to display or not.
Since I prefer the dark theme of the interface, now they are adapted to it, but in the near future for general convenience I will add the ability to adapt to light.
The same goes for the colour scheme, now it is adapted to the one I use in my strategies (because the library with more is made by cutting these dashboards from my strategies), but will also make customisable part.
If you have any wishes, feel free to write in the comments, maybe I can implement and add them in the next versions.
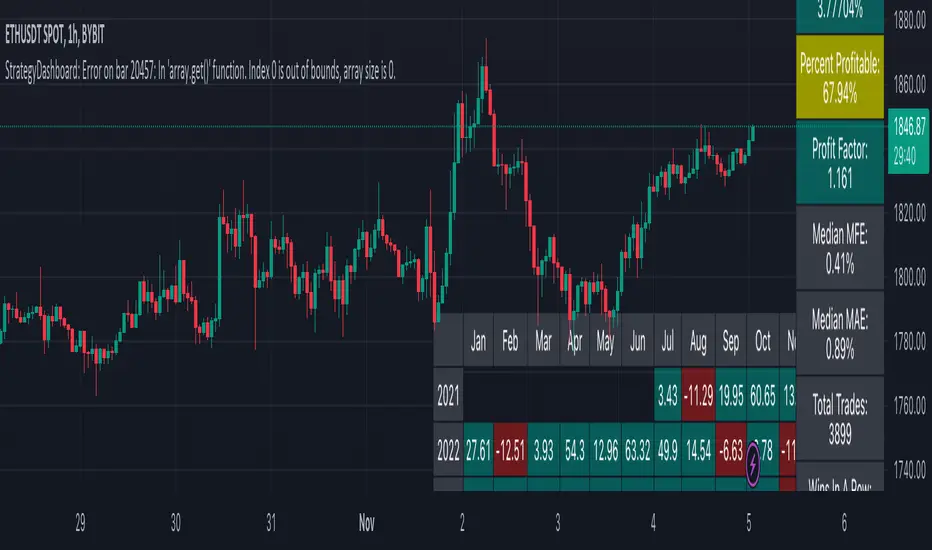
Statistics TableStrategy Statistics
This library will add a table with statistics from your strategy. With this library, you won't have to switch to your strategy tester tab to view your results and positions.
Usage:
You can choose whether to set the table by input fields by adding the below code to your strategy or replace the parameters with the ones you would like to use manually.
// Statistics table options.
statistics_table_enabled = input.string(title='Show a table with statistics', defval='YES', options= , group='STATISTICS')
statistics_table_position = input.string(title='Position', defval='RIGHT', options= , group='STATISTICS')
statistics_table_margin = input.int(title='Table Margin', defval=10, minval=0, maxval=100, step=1, group='STATISTICS')
statistics_table_transparency = input.int(title='Cell Transparency', defval=20, minval=1, maxval=100, step=1, group='STATISTICS')
statistics_table_text_color = input.color(title='Text Color', defval=color.new(color.white, 0), group='STATISTICS')
statistics_table_title_cell_color = input.color(title='Title Cell Color', defval=color.new(color.gray, 80), group='STATISTICS')
statistics_table_cell_color = input.color(title='Cell Color', defval=color.new(color.purple, 0), group='STATISTICS')
// Statistics table init.
statistics.table(strategy.initial_capital, close, statistics_table_enabled, statistics_table_position, statistics_table_margin, statistics_table_transparency, statistics_table_text_color, statistics_table_title_cell_color, statistics_table_cell_color)
Sample:
If you are interested in the strategy used for this statistics table, you can browse the strategies on my profile.
