Simple Line📌 Understanding the Basic Concept
The trend reverses only when the price moves up or down by a fixed filter size.
It ignores normal volatility and noise, recognizing a trend change only when price moves beyond a specified threshold.
Trend direction is visually intuitive through line colors (green: uptrend, red: downtrend).
⚙️ Explanation of Settings
Auto Brick Size: Automatically determines the brick/filter size.
Fixed Brick Size: Manually set the size (e.g., 15, 30, 50, 100, etc.).
Volatility Length: The lookback period used for calculations (default: 14).
📈 Example of Identifying Buy Timing
When the line changes from gray or red to green, it signals the start of an uptrend.
This indicates that the price has moved upward by more than the required threshold.
📉 Example of Identifying Sell Timing
When the line changes from green to red, it suggests a possible downtrend reversal.
At this point, consider closing long positions or evaluating short entries.
🧪 Recommended Use Cases
Use as a trend filter to enhance the accuracy of existing strategies.
Can be used alone as a clean directional indicator without complex oscillators.
Works synergistically with trend-following strategies, breakout strategies, and more.
🔒 Notes & Cautions
More suitable for medium- to long-term trend trading than for fast scalping.
If the brick size is too small, the indicator may react to noise.
Sensitivity varies greatly depending on the selected brick size, so backtesting is essential to determine optimal values.
❗ The Trend Simple Line focuses solely on direction—remove the noise and focus purely on the trend.
초대 전용 스크립트
이 스크립트에 대한 접근이 제한되어 있습니다. 사용자는 즐겨찾기에 추가할 수 있지만 사용하려면 사용자의 권한이 필요합니다. 연락처 정보를 포함하여 액세스 요청에 대한 명확한 지침을 제공해 주세요.
이 비공개 초대 전용 스크립트는 스크립트 모더레이터의 검토를 거치지 않았으며, 하우스 룰 준수 여부는 확인되지 않았습니다. 트레이딩뷰는 스크립트의 작동 방식을 충분히 이해하고 작성자를 완전히 신뢰하지 않는 이상, 해당 스크립트에 비용을 지불하거나 사용하는 것을 권장하지 않습니다. 커뮤니티 스크립트에서 무료 오픈소스 대안을 찾아보실 수도 있습니다.
작성자 지시 사항
.
c9indicator
면책사항
해당 정보와 게시물은 금융, 투자, 트레이딩 또는 기타 유형의 조언이나 권장 사항으로 간주되지 않으며, 트레이딩뷰에서 제공하거나 보증하는 것이 아닙니
Siklus

Filte Ichimoku1. Indicator Name
Filte Ichimoku
2. One-line Introduction
A smoothed and visually enhanced version of the Ichimoku Cloud that highlights trend direction and strength using adaptive color transparency.
3. General Overview
Filte Ichimoku is a modernized take on the classic Ichimoku Kinko Hyo indicator, designed for traders who value clarity and minimalism while retaining core Ichimoku functionality.
It calculates traditional components like Tenkan-sen, Kijun-sen, and the Senkou Span A/B, but focuses primarily on visualizing the Kumo (cloud) with enhanced styling.
Instead of raw plots, Filte Ichimoku applies triple-step smoothing to both Senkou spans, creating a soft, wave-like appearance that reflects trend fluidity.
The color of the cloud dynamically adapts based on whether Span A is above or below Span B (bullish/bearish), and its opacity changes according to the intensity of the trend, which is calculated relative to ATR-based volatility.
By forward-shifting the plots and visually blending the cloud, the indicator helps traders quickly identify dominant trends, potential reversals, and consolidation zones.
Its clean design makes it highly compatible with both traditional Ichimoku strategies and modern price action systems.
4. Key Advantages
🌥 Adaptive Ichimoku Cloud
Cloud color and transparency dynamically change based on real trend strength and direction.
📊 Smoother, Cleaner Display
Triple-smoothing on Senkou A and B creates a less noisy, more readable visual output.
📈 Forward Shift Preserved
Maintains the traditional Ichimoku forward-shift logic, helping project future price zones.
🎨 Customizable Trend Colors
Define your own bullish and bearish cloud colors for easy visual alignment with your strategy.
🚫 Noise Reduction via ATR Normalization
Trend intensity is calculated relative to ATR, reducing false positives in low-volatility zones.
🔒 Lightweight & Secure Design
Optimized script avoids exposure of sensitive logic while remaining fast and reliable in live charts.
📘 Indicator User Guide
📌 Basic Concept
Filte Ichimoku emphasizes cloud dynamics (Kumo) to interpret market structure.
Trend direction is derived from the relationship between Senkou Span A and B, while trend strength is measured by their distance relative to ATR.
The smoother curves make it easier to read while preserving all Ichimoku logic.
⚙️ Settings Explained
Tenkan Sen Length: Fast-moving average calculation period (default: 18)
Kijun Sen Length: Medium trend baseline (default: 52)
Senkou Span Length: Long-term cloud boundary (default: 104)
Bull/Bear Color: Set custom colors for bullish or bearish cloud states
📈 Bullish Timing Example
Senkou Span A > Span B, and the cloud appears green with high opacity
Indicates strong uptrend support, especially when price is above both Tenkan and Kijun
📉 Bearish Timing Example
Span B > Span A, cloud turns red and darkens
Suggests bearish dominance; avoid long entries or prepare for short-side setups
🧪 Recommended Use Cases
Use as a trend background layer for existing Ichimoku or price action systems
Combine with breakouts, support/resistance, and momentum indicators
Great for trend filtering in mid- to long-term strategies
🔒 Precautions
Designed for clarity and filtering—not a standalone entry system
In sideways markets, cloud may compress and color changes may become less meaningful
Adjust smoothing lengths cautiously to avoid lagging during volatile swings
Best results come from combining with price structure analysis

Stochastic Hash Strat [Hash Capital Research]# Stochastic Hash Strategy by Hash Capital Research
## 🎯 What Is This Strategy?
The **Stochastic Slow Strategy** is a momentum-based trading system that identifies oversold and overbought market conditions to capture mean-reversion opportunities. Think of it as a "buy low, sell high" approach with smart mathematical filters that remove emotion from your trading decisions.
Unlike fast-moving indicators that generate excessive noise, this strategy uses **smoothed stochastic oscillators** to identify only the highest-probability setups when momentum truly shifts.
---
## 💡 Why This Strategy Works
Most traders fail because they:
- **Chase prices** after big moves (buying high, selling low)
- **Overtrade** in choppy, directionless markets
- **Exit too early** or hold losses too long
This strategy solves all three problems:
1. **Entry Discipline**: Only trades when the stochastic oscillator crosses in extreme zones (oversold for longs, overbought for shorts)
2. **Cooldown Filter**: Prevents revenge trading by forcing a waiting period after each trade
3. **Fixed Risk/Reward**: Pre-defined stop-loss and take-profit levels ensure consistent risk management
**The Math Behind It**: The stochastic oscillator measures where the current price sits relative to its recent high-low range. When it's below 25, the market is oversold (time to buy). When above 70, it's overbought (time to sell). The crossover with its moving average confirms momentum is shifting.
---
## 📊 Best Markets & Timeframes
### ⭐ OPTIMAL PERFORMANCE:
**Crude Oil (WTI) - 12H Timeframe**
- **Why it works**: Oil markets have predictable volatility patterns and respect technical levels
**AAVE/USD - 4H to 12H Timeframe**
- **Why it works**: DeFi tokens exhibit strong momentum cycles with clear extremes
### ✅ Also Works Well On:
- **BTC/USD** (12H, Daily) - Lower frequency but high win rate
- **ETH/USD** (8H, 12H) - Balanced volatility and liquidity
- **Gold (XAU/USD)** (Daily) - Classic mean-reversion asset
- **EUR/USD** (4H, 8H) - Lower volatility, requires patience
### ❌ Avoid Using On:
- Timeframes below 4H (too much noise)
- Low-liquidity altcoins (wide spreads kill performance)
- Strongly trending markets without pullbacks (Bitcoin in 2021)
- News-driven instruments during major events
---
## 🎛️ Understanding The Settings
### Core Stochastic Parameters
**Stochastic Length (Default: 16)**
- Controls the lookback period for price comparison
- Lower = faster reactions, more signals (10-14 for volatile markets)
- Higher = smoother signals, fewer trades (16-21 for stable markets)
- **Pro tip**: Use 10 for crypto 4H, 16 for commodities 12H
**Overbought Level (Default: 70)**
- Threshold for short entries
- Lower values (65-70) = more trades, earlier entries
- Higher values (75-80) = fewer but higher-conviction trades
- **Sweet spot**: 70 works for most assets
**Oversold Level (Default: 25)**
- Threshold for long entries
- Higher values (25-30) = more trades, earlier entries
- Lower values (15-20) = fewer but stronger bounce setups
- **Sweet spot**: 20-25 depending on market conditions
**Smooth K & Smooth D (Default: 7 & 3)**
- Additional smoothing to filter out whipsaws
- K=7 makes the indicator slower and more reliable
- D=3 is the signal line that confirms the trend
- **Don't change these unless you know what you're doing**
---
### Risk Management
**Stop Loss % (Default: 2.2%)**
- Automatically exits losing trades
- Should be 1.5x to 2x your average market volatility
- Too tight = death by a thousand cuts
- Too wide = uncontrolled losses
- **Calibration**: Check ATR indicator and set SL slightly above it
**Take Profit % (Default: 7%)**
- Automatically exits winning trades
- Should be 2.5x to 3x your stop loss (reward-to-risk ratio)
- This default gives 7% / 2.2% = 3.18:1 R:R
- **The golden rule**: Never have R:R below 2:1
---
### Trade Filters
**Bar Cooldown Filter (Default: ON, 3 bars)**
- **What it does**: Forces you to wait X bars after closing a trade before entering a new one
- **Why it matters**: Prevents emotional revenge trading and overtrading in choppy markets
- **Settings guide**:
- 3 bars = Standard (good for most cases)
- 5-7 bars = Conservative (oil, slow-moving assets)
- 1-2 bars = Aggressive (only for experienced traders)
**Exit on Opposite Extreme (Default: ON)**
- Closes your long when stochastic hits overbought (and vice versa)
- Acts as an early profit-taking mechanism
- **Leave this ON** unless you're testing other exit strategies
**Divergence Filter (Default: OFF)**
- Looks for price/momentum divergences for additional confirmation
- **When to enable**: Trending markets where you want fewer but higher-quality trades
- **Keep OFF for**: Mean-reverting markets (oil, forex, most of the time)
---
## 🚀 Quick Start Guide
### Step 1: Set Up in TradingView
1. Open TradingView and navigate to your chart
2. Click "Pine Editor" at the bottom
3. Copy and paste the strategy code
4. Click "Add to Chart"
5. The strategy will appear in a separate pane below your price chart
### Step 2: Choose Your Market
**If you're trading Crude Oil:**
- Timeframe: 12H
- Keep all default settings
- Watch for signals during London/NY overlap (8am-11am EST)
**If you're trading AAVE or crypto:**
- Timeframe: 4H or 12H
- Consider these adjustments:
- Stochastic Length: 10-14 (faster)
- Oversold: 20 (more aggressive)
- Take Profit: 8-10% (higher targets)
### Step 3: Wait for Your First Signal
**LONG Entry** (Green circle appears):
- Stochastic crosses up below oversold level (25)
- Price likely near recent lows
- System places limit order at take profit and stop loss
**SHORT Entry** (Red circle appears):
- Stochastic crosses down above overbought level (70)
- Price likely near recent highs
- System places limit order at take profit and stop loss
**EXIT** (Orange circle):
- Position closes either at stop, target, or opposite extreme
- Cooldown period begins
### Step 4: Let It Run
The biggest mistake? **Interfering with the system.**
- Don't close trades early because you're scared
- Don't skip signals because you "have a feeling"
- Don't increase position size after a big win
- Don't revenge trade after a loss
**Follow the system or don't use it at all.**
---
### Important Risks:
1. **Drawdown Pain**: You WILL experience losing streaks of 5-7 trades. This is mathematically normal.
2. **Whipsaw Markets**: Choppy, range-bound conditions can trigger multiple small losses.
3. **Gap Risk**: Overnight gaps can cause your actual fill to be worse than the stop loss.
4. **Slippage**: Real execution prices differ from backtested prices (factor in 0.1-0.2% slippage).
---
## 🔧 Optimization Guide
### When to Adjust Settings:
**Market Volatility Increased?**
- Widen stop loss by 0.5-1%
- Increase take profit proportionally
- Consider increasing cooldown to 5-7 bars
**Getting Too Few Signals?**
- Decrease stochastic length to 10-12
- Increase oversold to 30, decrease overbought to 65
- Reduce cooldown to 2 bars
**Getting Too Many Losses?**
- Increase stochastic length to 18-21 (slower, smoother)
- Enable divergence filter
- Increase cooldown to 5+ bars
- Verify you're on the right timeframe
### A/B Testing Method:
1. **Run default settings for 50 trades** on your chosen market
2. Document: Win rate, profit factor, max drawdown, emotional tolerance
3. **Change ONE variable** (e.g., oversold from 25 to 20)
4. Run another 50 trades
5. Compare results
6. Keep the better version
**Never change multiple settings at once** or you won't know what worked.
---
## 📚 Educational Resources
### Key Concepts to Learn:
**Stochastic Oscillator**
- Developed by George Lane in the 1950s
- Measures momentum by comparing closing price to price range
- Formula: %K = (Close - Low) / (High - Low) × 100
- Similar to RSI but more sensitive to price movements
**Mean Reversion vs. Trend Following**
- This is a **mean reversion** strategy (price returns to average)
- Works best in ranging markets with defined support/resistance
- Fails in strong trending markets (2017 Bitcoin, 2020 Tech stocks)
- Complement with trend filters for better results
**Risk:Reward Ratio**
- The cornerstone of profitable trading
- Winning 40% of trades with 3:1 R:R = profitable
- Winning 60% of trades with 1:1 R:R = breakeven (after fees)
- **This strategy aims for 45% win rate with 2.5-3:1 R:R**
### Recommended Reading:
- *"Trading Systems and Methods"* by Perry Kaufman (Chapter on Oscillators)
- *"Mean Reversion Trading Systems"* by Howard Bandy
- *"The New Trading for a Living"* by Dr. Alexander Elder
---
## 🛠️ Troubleshooting
### "I'm not seeing any signals!"
**Check:**
- Is your timeframe 4H or higher?
- Is the stochastic actually reaching extreme levels (check if your asset is stuck in middle range)?
- Is cooldown still active from a previous trade?
- Are you on a low-liquidity pair?
**Solution**: Switch to a more volatile asset or lower the overbought/oversold thresholds.
---
### "The strategy keeps losing money!"
**Check:**
- What's your win rate? (Below 35% is concerning)
- What's your profit factor? (Below 0.8 means serious issues)
- Are you trading during major news events?
- Is the market in a strong trend?
**Solution**:
1. Verify you're using recommended markets/timeframes
2. Increase cooldown period to avoid choppy markets
3. Reduce position size to 5% while you diagnose
4. Consider switching to daily timeframe for less noise
---
### "My stop losses keep getting hit!"
**Check:**
- Is your stop loss tighter than the average ATR?
- Are you trading during high-volatility sessions?
- Is slippage eating into your buffer?
**Solution**:
1. Calculate the 14-period ATR
2. Set stop loss to 1.5x the ATR value
3. Avoid trading right after market open or major news
4. Factor in 0.2% slippage for crypto, 0.1% for oil
---
## 💪 Pro Tips from the Trenches
### Psychological Discipline
**The Three Deadly Sins:**
1. **Skipping signals** - "This one doesn't feel right"
2. **Early exits** - "I'll just take profit here to be safe"
3. **Revenge trading** - "I need to make back that loss NOW"
**The Solution:** Treat your strategy like a business system. Would McDonald's skip making fries because the cashier "doesn't feel like it today"? No. Systems work because of consistency.
---
### Position Management
**Scaling In/Out** (Advanced)
- Enter 50% position at signal
- Add 50% if stochastic reaches 10 (oversold) or 90 (overbought)
- Exit 50% at 1.5x take profit, let the rest run
**This is NOT for beginners.** Master the basic system first.
---
### Market Awareness
**Oil Traders:**
- OPEC meetings = volatility spikes (avoid or widen stops)
- US inventory reports (Wed 10:30am EST) = avoid trading 2 hours before/after
- Summer driving season = different patterns than winter
**Crypto Traders:**
- Monday-Tuesday = typically lower volatility (fewer signals)
- Thursday-Sunday = higher volatility (more signals)
- Avoid trading during exchange maintenance windows
---
## ⚖️ Legal Disclaimer
This trading strategy is provided for **educational purposes only**.
- Past performance does not guarantee future results
- Trading involves substantial risk of loss
- Only trade with capital you can afford to lose
- No one associated with this strategy is a licensed financial advisor
- You are solely responsible for your trading decisions
**By using this strategy, you acknowledge that you understand and accept these risks.**
---
## 🙏 Acknowledgments
Strategy development inspired by:
- George Lane's original Stochastic Oscillator work
- Modern quantitative trading research
- Community feedback from hundreds of backtests
Built with ❤️ for retail traders who want systematic, disciplined approaches to the markets.
---
**Good luck, stay disciplined, and trade the system, not your emotions.**

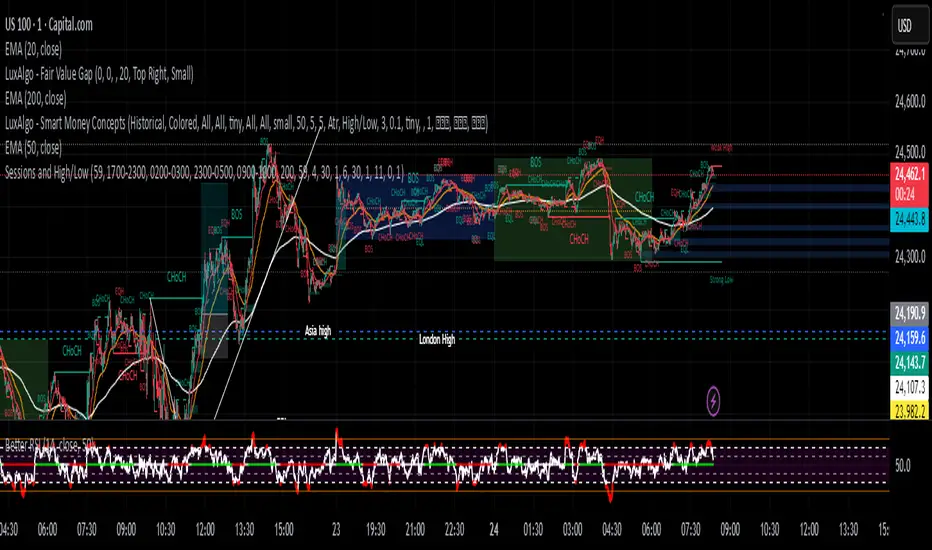
Sessions and High/LowCan be used to mark highs and lows of any sessions you desire can do 4 sessions
Thirdeyechart Global Gold PercentageThe global gold percentage – Percentage Change Indicator is a TradingView tool developed to help traders monitor multiple currency pairs and precious metals in one glance. This indicator was coded personally, using custom formulas to calculate the percentage change for each symbol over selected timeframes, making it unique and fully tailored to individual analysis needs.
Users can input any symbols they wish to track as a comma-separated list, making it highly flexible. The script automatically calculates percentage changes for Daily (D), 1-Hour (H1), and 4-Hour (H4) timeframes. Positive changes are highlighted in blue and negative changes in red, allowing for an instant visual representation of market movements. The table updates in real-time, giving traders immediate feedback without needing to switch between charts.
Designed with simplicity and functionality in mind, this indicator is ideal for intraday traders, swing traders, or anyone who wants to keep an eye on multiple markets efficiently. It works for currency pairs, metals like gold (XAUUSD, XAUJPY), or any TradingView-available symbol. The table is positioned at the top-right corner of the chart and automatically adapts to the number of symbols entered.
This script is purely informational and educational, providing a clear view of price movements but not offering buy or sell signals. Traders should perform their own analysis and risk management before making any trading decisions.
Disclaimer / Copyright:
© 2025 Thirdeyechart. All rights reserved. This indicator is for educational and informational purposes only. The author is not responsible for any trading losses or financial decisions made based on this script. Redistribution, copying, or commercial use of this code without permission is strictly prohibited.

BTC -50% Crash to Recovery ZoneGeneral Overview This is a macro-analysis tool designed to visualize the true duration of Bitcoin’s "Suffering & Recovery Cycles." Unlike standard oscillators that only signal oversold conditions, this script highlights the entire timeline required for the market to flush out leverage and return to All-Time Highs (ATH).
Operational Logic The algorithm tracks Bitcoin’s historical All-Time High (ATH).
The Trigger: It activates automatically when the price drops 50% below the last recorded ATH.
The "Recovery Zone": Once triggered, the chart background turns red (indicating a "Drawdown" state). This zone remains active persistently, even during intermediate relief rallies.
The Reset: The zone deactivates only when the price breaks above the previous ATH, marking the official start of a new Price Discovery phase.
How to Read It
Red Background: We are officially in a Bear Market or Recovery Phase. The asset is technically "underwater." For the long-term investor with a low time preference, this visually defines the accumulation window.
Red Horizontal Line: Indicates the "Target." This is the exact price level of the old ATH that Bitcoin must reclaim to close the bearish cycle.
No Background Color: We are in Price Discovery. The market is healthy and pushing for new highs.
The Financial Lesson This indicator visually demonstrates a fundamental market truth: "Price takes the elevator down, but takes the stairs up." It shows that after a halving of value (-50%), Bitcoin may take months or years to recover previous levels, helping investors filter out the noise of short-term pumps that fail to break the macro-bearish structure.

Weekday-to-Weekday % Change (selectable, Line + Axis)Weekday-to-Weekday % Change
Plots % change between the chosen weekday occurrences (week-over-week style) or intraday open→close if you select that comparison type.
Shows as a line in a separate pane (overlay=false).
Auto-scales the Y-axis in percent using invisible padded bounds so TradingView draws a readable axis and ticks.
Optional EMA smoothing and labels on the selected-day bars.

Classic Dual Momentum – 12-Month Absolute Momentum - AntonacciThis indicator calculates the 12-month absolute momentum exactly as described in Gary Antonacci’s Dual Momentum framework.
It automatically adjusts the lookback period based on the chart’s timeframe:
Daily chart: 252 bars
Weekly chart: 52 bars
Monthly chart: 12 bars
Other timeframes: Estimated automatically using bar time difference
The script computes the 12-month rate of return and displays it as a color-coded column plot:
Green: Positive 12-month momentum
Red: Negative 12-month momentum
A customizable moving average is included to help visualize longer-term trends in the momentum signal.
How It’s Used (from Dual Momentum theory)
This indicator provides the absolute momentum filter used in classic Dual Momentum strategies:
If the 12-month return of an asset is above the risk-free return → trend is positive
If it is below the risk-free return → trend is negative
This absolute momentum check is a key component of the Global Equities Momentum (GEM) model presented in Gary Antonacci’s book Dual Momentum Investing.
Why This Indicator Exists
It gives traders a clean, accurate way to visualize the 12-month trend strength across any timeframe, without the distortions caused by bar length differences.

BTC GOD — DEFINITIVE BTC MULTI INDICATORBTC GOD — The Ultimate Bitcoin Cycle Indicator (2025 Edition)
The one indicator every serious BTC holder and trader has been waiting for.
A single script that perfectly combines the 5 most powerful and accurate Bitcoin indicators ever created — all 100 % official versions:
- Official Pi Cycle Top (LookIntoBitcoin) → in 2013, 2017 & 2021 (3/3 hits)
- Official MVRV Z-Score (Glassnode / LookIntoBitcoin) → every major bottom (2015, 2018–19, 2022)
- Dynamic Bull/Bear background (red bear-market when price drops X % from cycle ATH + monthly RSI filter)
- Monthly Golden/Death Cross (50-month EMA vs 200-week EMA) → huge, unmistakable signals
- SuperTrend + 200-week EMA + 50-month EMA
- Cycle ATH/ATL tracking with flashing alert in the table when new highs/lows are made
- Exact days to/from the next halving + optimal accumulation zone (200–750 days post-halving)
- Fully customizable inputs for experienced traders
Zero repainting. Zero errors. Works on every timeframe.
This is the indicator used by people who truly understand Bitcoin’s 4-year cycles.
If you could only keep ONE Bitcoin indicator for the rest of your life… this would be it.
Save it, test it, and you’ll instantly see why it’s called BTC GOD.
Built with love and obsession for Bitcoin cycles.
Last update: November 2025

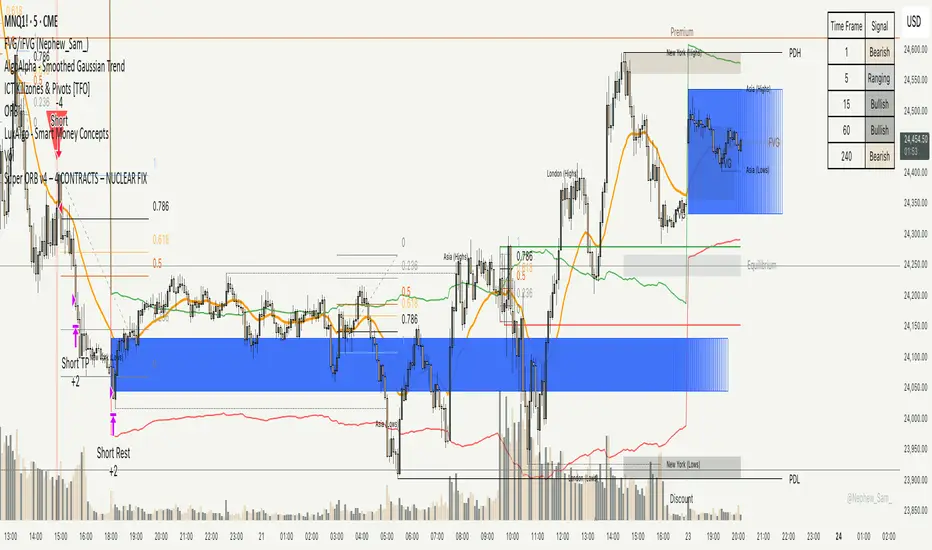
Super ORB v4 – 4 CONTRACTS – NUCLEAR FIXORB hands off printer, this is to gauge how few trades can happen off the ORB while not trading after hours either. Should be in the 5% a month range 4 contracts, no more than 5 trades a month.
SNP420_Five_to_Five_INDIFor consistent 9-5 traders.
Use for your traidingroutine.
Change colours and time for your strategy.
Peace and love! SNP420

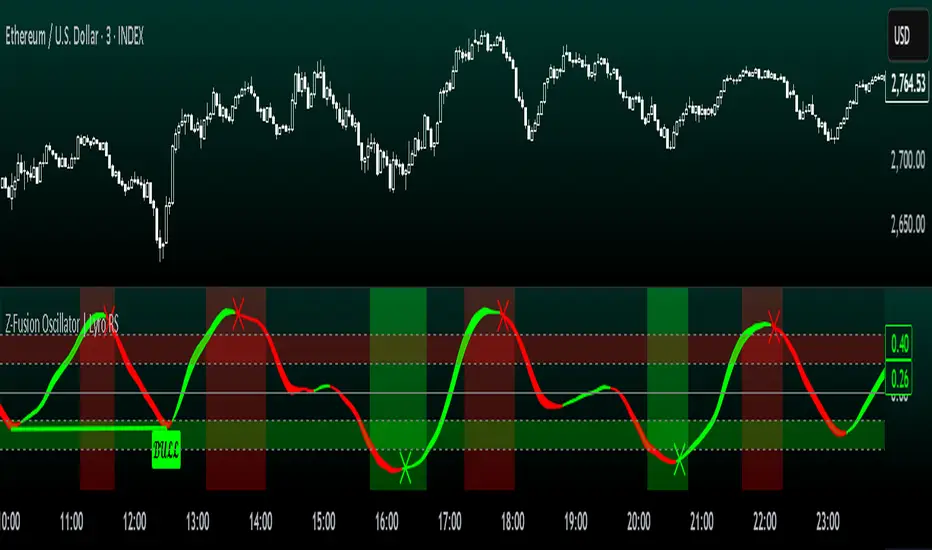
Z-Fusion Oscillator | Lyro RSThe Z-Fusion Oscillator converts five momentum indicators into Z-scores and blends them into one normalized signal that adapts across markets.
By combining normalization, smoothing, and divergence detection, users can easily identify when momentum is accelerating, weakening, reversing, or entering extreme zones
🔶 USAGE
The Z-Fusion Oscillator is designed to give traders a unified reading of market momentum—removing the noise of comparing tools that normally run on different scales.
By transforming RSI, MACD histogram, Stochastic, Momentum, and Rate of Change into Z-scores, this tool standardizes all inputs, making trend strength and shifts easier to interpret.
A dual-line system (fast Z-fusion line + slower baseline) highlights turning points, while overbought/oversold bands and “X-marks” help traders spot exhaustion and potential reversals.
🔹 Unified Momentum Structure
The indicator’s core strength comes from combining five Z-scored signals into one average.
Which makes momentum behavior more consistent across assets, reduces false extremes, and highlights true shifts in trend conviction.
🔹 Divergence Detection
The tool includes fully integrated divergence detection:
Regular Bullish Divergence: Price makes a lower low while Z-Fusion forms a higher low.
Regular Bearish Divergence: Price makes a higher high while Z-Fusion forms a lower high
Bullish and bearish divergences are marked directly on the oscillator with labels and colored pivot connections, making hidden momentum shifts obvious.
🔹 Visual Extremes
Two sets of upper and lower Z-score thresholds help identify:
Extreme overbought surges
Extreme oversold drops
Reversal zones
Potential exhaustion conditions
Background coloring reinforces when the oscillator moves beyond major levels, helping traders quickly assess momentum pressure.
🔹 Detecting Momentum Anomalies
Z-scores allow the oscillator to highlight when market momentum behaves abnormally relative to its own recent history.
For example:
The oscillator reaching +1 or –1 after an extended trend may indicate a climax.
A sharp Z-score reversal within an extreme zone can signal a trend exhaustion or a corrective move.
Divergences often appear earlier due to normalization smoothing out indicator noise.
This makes the Z-Fusion Oscillator particularly useful for spotting subtle shifts in trend direction that traditional indicators may miss.
🔶 DETAILS
🔹 Composite Z-Score Framework
Each momentum tool is smoothed, normalized, and transformed:
RSI → EMA-smoothed, Z-scored
MACD histogram → Z-scored
Stochastic → EMA + SMA smoothing, then Z-scored
Momentum → EMA-smoothed, Z-scored
Rate of Change → EMA-smoothed, Z-scored
These are averaged into one composite Z-score to provide a consistent reading across assets and market conditions.
🔹 Fusion Trend Lines
Two lines serve as the core signal:
Fast Line (savg) – reacts quicker to trend changes
Slow Line (savg2) – acts as a baseline filter
Crossovers between these lines highlight momentum shifts, while their color reflects trend bias.
🔹 Overbought/Oversold Zones
Two upper and two lower Z-score thresholds define “zones”:
Upper zones highlight overheated momentum or potential bearish reversals
Lower zones highlight depressed momentum or potential bullish reversals
Filled regions and background colors help visually confirm extreme conditions.
🔹 Pivot-Based Divergence Engine
The script includes filtered pivot detection with customizable look-backs and range limits to ensure divergences are meaningful, not noise-driven.
🔶 SETTINGS
🔹 Indicator Settings
Source — Price series used for all calculations.
Z-Score Length — Lookback period for Z-score normalization.
Z-Score MA Length — Smoothing length for the fusion signal lines.
Overbought/Oversold Levels — Four customizable threshold lines.
Color Palette — Choose from preset themes or define custom colors.
🔹 RSI
Length — RSI calculation period.
EMA Smoothing Length — Smooths RSI before Z-score conversion.
🔹 MACD
Fast Length — Fast EMA length.
Slow Length — Slow EMA length.
Signal Line Length — MACD signal smoothing.
🔹 Stochastic
%K Length — Main stochastic length.
EMA Smoothing — Smooths %K for stability.
%D Length — Smoothing for the signal line.
🔹 Momentum
Length — Momentum lookback.
EMA Smoothing — Smooths momentum before Z-scoring.
🔹 Rate of Change
Length — ROC lookback.
EMA Smoothing — Smooths ROC values.
🔹 Divergence
Enable/Disable Divergence Detection — Toggle divergence engine.
Pivot Left/Right Lookback — Defines pivot detection sensitivity.
Detection Range Limits — Controls allowable range for divergence.
Bull/Bear Colors & Styling — Customize divergence visualization.
🔶 SUMMARY
The Z-Fusion Oscillator combines multiple momentum signatures into a single normalized signal, enabling traders to:
Identify reversals early
Detect momentum exhaustion
Spot bullish and bearish divergences
Track overbought/oversold conditions
Visualize trend strength with clarity
Whether you're a swing trader, intraday analyst, or trend-reversal hunter, the Z-Fusion Oscillator provides a powerful and adaptive way to read momentum.
BTC Halving Cycle SignalsBTC Halving Cycle Signals
What signals does this script give in real history (2011-2025):
2015 → BUY (bear market bottom)
2019 → BUY (post-2018 bottom)
October 2020 → BUY
November 2023 → BUY
And right now (Nov 2025) → green bottom + price above weekly EMA200 → about to give a buy signal if it breaks $72k strongly.
BUY signal: ~500 days pre-halving + price > weekly EMA200 + monthly RSI <60 (accumulation).
SELL signal: ~1064 days post-halving + RSI >75 or close < SuperTrend (distribution).
Hardcoded halving dates (can be edited). Works on BTCUSD weekly/monthly, gives 1-2 signals per cycle.

BTC Energy + HR + Longs + M2
BTC Energy Ratio + Hashrate + Longs + M2
The #1 Bitcoin Macro Weapon on TradingView 🚀🔥
If you’re tired of getting chopped by fakeouts, ETF noise, and Twitter hopium — this is the one chart that finally puts you on the right side of every major move.
What you’re looking at:
Orange line → Bitcoin priced in real-world mining energy (Oil × Gas + Uranium × Coal) × 1000
→ The true fundamental floor of BTC
Blue line → Scaled hashrate trend (miner strength & capex lag)
Green line → Bitfinex longs EMA (leveraged bull sentiment)
Purple line → Global M2 money supply (US+EU+CN+JP) with 10-week lead (the liquidity wave BTC rides)
Why this indicator prints money:
Most tools react to price.
This one predicts where price is going based on energy, miners, leverage, and liquidity — the only four things that actually drive Bitcoin long-term.
It has nailed:
2022 bottom at ~924 📉
2024 breakout above 12,336 🚀
2025 top at 17,280 🏔️
And right now it’s flashing generational accumulation at ~11,500 (Nov 2025)
13 permanent levels with right-side labels — no guessing what anything means:
20,000 → 2021 Bull ATH
17,280 → 2025 ATH
15,000 → 2024 High Resist
14,000 → Overvalued Zone
13,000 → 2024 Breakout
12,336 → Bull/Bear Line (the most important level)
12,000 → 2024 Volume POC
10,930 → Key Support 2024
9,800 → Strong Buy Fib
8,000 → Deep Support 2023
6,000 → 2021 Mid-Cycle
4,500 → 2023 Accum Low
924 → 2022 Bear Low
Live dashboard tells you exactly what to do — no thinking required:
Current ratio (updates live)
Hashrate + 24H %
Longs trend
Risk Mode → Orange vs Hashrate (RISK ON / RISK OFF)
180-day correlation
RSI
13-tier Zone + SIGNAL (STRONG BUY / ACCUMULATE / HOLD / DISTRIBUTE / EXTREME SELL)
Dead-simple rules that actually work:
Weekly timeframe = cleanest view
Blue peaking + orange holding support → miner pain = next leg up
Green spiking + orange failing → overcrowded longs = trim
Purple rising → liquidity coming in = ride the wave
Risk Mode = RISK OFF → price is cheap vs miners → buy
Set these 3 alerts and walk away:
Ratio > 12,336 → Bull confirmed → add
Ratio > 14,000 → Start scaling out
Ratio < 9,800 → Generational buy → back up the truck
No repainting • Fully open-source • Forced daily data • Works on any TF
Energy is the only real backing Bitcoin has.
Hashrate lag is the best leading indicator.
Longs show greed.
M2 is the tide.
This chart combines all four — and right now it’s screaming ACCUMULATE.
Load it. Trust it.
Stop trading hope. Start trading reality.
DYOR • NFA • For entertainment purposes only 😎
#bitcoin #macro #energy #hashrate #m2 #cycle #riskon #riskoff

Static K-means Clustering | InvestorUnknownStatic K-Means Clustering is a machine-learning-driven market regime classifier designed for traders who want a data-driven structure instead of subjective indicators or manually drawn zones.
This script performs offline (static) K-means training on your chosen historical window. Using four engineered features:
RSI (Momentum)
CCI (Price deviation / Mean reversion)
CMF (Money flow / Strength)
MACD Histogram (Trend acceleration)
It groups past market conditions into K distinct clusters (regimes). After training, every new bar is assigned to the nearest cluster via Euclidean distance in 4-dimensional standardized feature space.
This allows you to create models like:
Regime-based long/short filters
Volatility phase detectors
Trend vs. chop separation
Mean-reversion vs. breakout classification
Volume-enhanced money-flow regime shifts
Full machine-learning trading systems based solely on regimes
Note:
This script is not a universal ML strategy out of the box.
The user must engineer the feature set to match their trading style and target market.
K-means is a tool, not a ready made system, this script provides the framework.
Core Idea
K-means clustering takes raw, unlabeled market observations and attempts to discover structure by grouping similar bars together.
// STEP 1 — DATA POINTS ON A COORDINATE PLANE
// We start with raw, unlabeled data scattered in 2D space (x/y).
// At this point, nothing is grouped—these are just observations.
// K-means will try to discover structure by grouping nearby points.
//
// y ↑
// |
// 12 | •
// | •
// 10 | •
// | •
// 8 | • •
// |
// 6 | •
// |
// 4 | •
// |
// 2 |______________________________________________→ x
// 2 4 6 8 10 12 14
//
//
//
// STEP 2 — RANDOMLY PLACE INITIAL CENTROIDS
// The algorithm begins by placing K centroids at random positions.
// These centroids act as the temporary “representatives” of clusters.
// Their starting positions heavily influence the first assignment step.
//
// y ↑
// |
// 12 | •
// | •
// 10 | • C2 ×
// | •
// 8 | • •
// |
// 6 | C1 × •
// |
// 4 | •
// |
// 2 |______________________________________________→ x
// 2 4 6 8 10 12 14
//
//
//
// STEP 3 — ASSIGN POINTS TO NEAREST CENTROID
// Each point is compared to all centroids.
// Using simple Euclidean distance, each point joins the cluster
// of the centroid it is closest to.
// This creates a temporary grouping of the data.
//
// (Coloring concept shown using labels)
//
// - Points closer to C1 → Cluster 1
// - Points closer to C2 → Cluster 2
//
// y ↑
// |
// 12 | 2
// | 1
// 10 | 1 C2 ×
// | 2
// 8 | 1 2
// |
// 6 | C1 × 2
// |
// 4 | 1
// |
// 2 |______________________________________________→ x
// 2 4 6 8 10 12 14
//
// (1 = assigned to Cluster 1, 2 = assigned to Cluster 2)
// At this stage, clusters are formed purely by distance.
Your chosen historical window becomes the static training dataset , and after fitting, the centroids never change again.
This makes the model:
Predictable
Repeatable
Consistent across backtests
Fast for live use (no recalculation of centroids every bar)
Static Training Window
You select a period with:
Training Start
Training End
Only bars inside this range are used to fit the K-means model. This window defines:
the market regime examples
the statistical distributions (means/std) for each feature
how the centroids will be positioned post-trainin
Bars before training = fully transparent
Training bars = gray
Post-training bars = full colored regimes
Feature Engineering (4D Input Vector)
Every bar during training becomes a 4-dimensional point:
This combination balances: momentum, volatility, mean-reversion, trend acceleration giving the algorithm a richer "market fingerprint" per bar.
Standardization
To prevent any feature from dominating due to scale differences (e.g., CMF near zero vs CCI ±200), all features are standardized:
standardize(value, mean, std) =>
(value - mean) / std
Centroid Initialization
Centroids start at diverse coordinates using various curves:
linear
sinusoidal
sign-preserving quadratic
tanh compression
init_centroids() =>
// Spread centroids across using different shapes per feature
for c = 0 to k_clusters - 1
frac = k_clusters == 1 ? 0.0 : c / (k_clusters - 1.0) // 0 → 1
v = frac * 2 - 1 // -1 → +1
array.set(cent_rsi, c, v) // linear
array.set(cent_cci, c, math.sin(v)) // sinusoidal
array.set(cent_cmf, c, v * v * (v < 0 ? -1 : 1)) // quadratic sign-preserving
array.set(cent_mac, c, tanh(v)) // compressed
This makes initial cluster spread “random” even though true randomness is hardly achieved in pinescript.
K-Means Iterative Refinement
The algorithm repeats these steps:
(A) Assignment Step, Each bar is assigned to the nearest centroid via Euclidean distance in 4D:
distance = sqrt(dx² + dy² + dz² + dw²)
(B) Update Step, Centroids update to the mean of points assigned to them. This repeats iterations times (configurable).
LIVE REGIME CLASSIFICATION
After training, each new bar is:
Standardized using the training mean/std
Compared to all centroids
Assigned to the nearest cluster
Bar color updates based on cluster
No re-training occurs. This ensures:
No lookahead bias
Clean historical testing
Stable regimes over time
CLUSTER BEHAVIOR & TRADING LOGIC
Clusters (0, 1, 2, 3…) hold no inherent meaning. The user defines what each cluster does.
Example of custom actions:
Cluster 0 → Cash
Cluster 1 → Long
Cluster 2 → Short
Cluster 3+ → Cash (noise regime)
This flexibility means:
One trader might have cluster 0 as consolidation.
Another might repurpose it as a breakout-loading zone.
A third might ignore 3 clusters entirely.
Example on ETHUSD
Important Note:
Any change of parameters or chart timeframe or ticker can cause the “order” of clusters to change
The script does NOT assume any cluster equals any actionable bias, user decides.
PERFORMANCE METRICS & ROC TABLE
The indicator computes average 1-bar ROC for each cluster in:
Training set
Test (live) set
This helps measure:
Cluster profitability consistency
Regime forward predictability
Whether a regime is noise, trend, or reversion-biased
EQUITY SIMULATION & FEES
Designed for close-to-close realistic backtesting.
Position = cluster of previous bar
Fees applied only on regime switches. Meaning:
Staying long → no fee
Switching long→short → fee applied
Switching any→cash → fee applied
Fee input is percentage, but script already converts internally.
Disclaimers
⚠️ This indicator uses machine-learning but does not predict the future. It classifies similarity to past regimes, nothing more.
⚠️ Backtest results are not indicative of future performance.
⚠️ Clusters have no inherent “bullish” or “bearish” meaning. You must interpret them based on your testing and your own feature engineering.

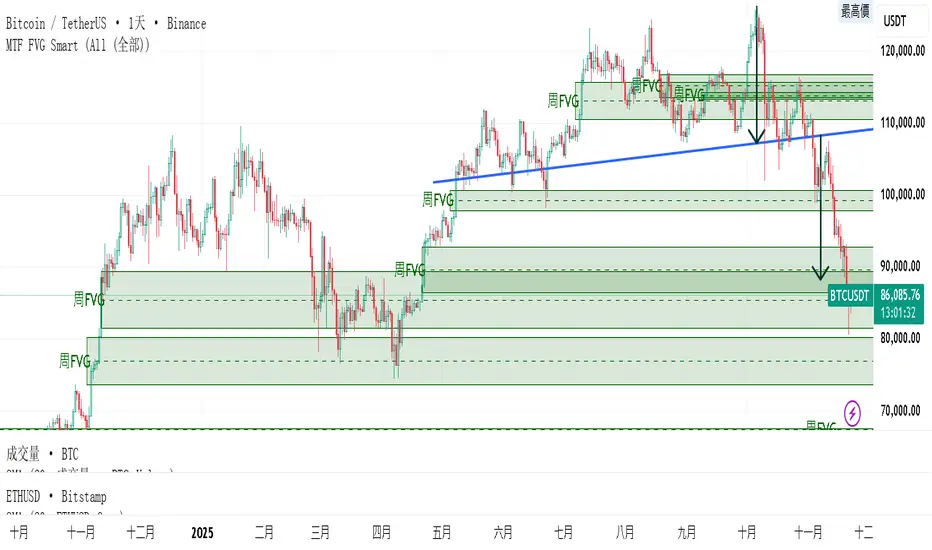
MTF FVG 智能終極版 (Smart Clean)指標名稱:MTF FVG 智能終極版 (Smart Clean)
簡潔介紹
這是一款專為專業交易者設計的 多週期失衡區 (FVG) 監控系統,核心特色如下:
五維度監控:
在任何圖表上同時顯示 月、周、日、4H、2H 五種級別的支撐壓力缺口。
智慧重疊清理 (獨家):
當價格重疊時,自動刪除舊框框,只保留最新的 1~3 個(可設定);若無重疊則完整保留歷史痕跡。確保圖表乾淨且資訊不遺漏。
完美視覺體驗:
大週期無限延伸,小週期固定長度。
文字自動靠右並智慧留白,確保不遮擋右側價格座標。
深色邊框 + 淺色填充 + 中線虛線,層次分明。
Indicator Name: MTF FVG Smart Clean Ultimate Edition
Brief Introduction
This is a multi-timeframe Free Gaps (FVG) monitoring system designed for professional traders. Its core features include:
Five-Dimensional Monitoring: Simultaneously displays support, resistance, and gaps at five timeframes (monthly, weekly, daily, 4H, and 2H) on any chart.
Intelligent Overlap Cleanup (Exclusive): When prices overlap, automatically deletes old boxes, retaining only the latest 1-3 (configurable); if there is no overlap, it retains all historical data. Ensures a clean chart and complete information.
Perfect Visual Experience: Larger timeframes extend infinitely, while smaller timeframes have fixed lengths.
Text automatically aligns to the right with intelligent white space to ensure it doesn't obscure the price coordinates on the right.
Dark borders + light fill + dashed center line create clear visual hierarchy.
Weekends HighlighterHighlights all Saturdays and Sundays on the chart with two different background colors to easily spot weekends.
Session Highlighter (Asia / London / New York)This TradingView Pine Script highlights the three major Forex sessions—Asia, London, and New York—directly on the chart. Each session has customizable start/end times (based on New York time), toggle switches to show or hide them, and adjustable background colors. The script automatically detects sessions that cross midnight and shades the chart accordingly. It can also place optional labels at the exact opening of each session.

CME Bitcoin Weekend Gap (Global) @jerikooDescription:
The Problem: You are watching the wrong hours. Many traders assume CME Bitcoin futures follow standard stock market hours or open Monday morning. This is incorrect.
Stock Market: Opens Monday morning.
CME Bitcoin: Opens Sunday Evening (US Time).
If you are in Europe, this means the market actually opens at Midnight (00:00) Monday. If you are waiting for the "Monday Morning Open," you are late.
The Solution: True Gap Detection This indicator highlights the exact downtime of the CME Bitcoin Futures market to help you identify true liquidity gaps.
Why this script is different: Most gap scripts break when you change your chart's time zone (e.g., switching from UTC to New York). This script is Universal.
Hardcoded Exchange Time: It calculates logic based on "America/Chicago" (CME HQ) time, regardless of your local chart settings.
Manual Offset Fix: Some data feeds have a +/- 1 or 2-hour sync difference depending on the broker. This script includes a "Hour Shift" setting to manually align the box perfectly to your specific candles.
How to use:
Add to your chart.
Look for the Dark Green highlighted zone.
This zone represents the Weekend Gap (Friday Close to Sunday Open).
Troubleshooting: If the box starts 1-2 hours too early or too late, go to Settings and change the "Hour Shift" value (e.g., -1, +1) until it snaps perfectly to the Friday close candle.
Technical Details:
CME Close: Friday 16:00 CT
CME Open: Sunday 17:00 CT
Color: Dark Green (50% Transparency)
Step 3: Categories & Tags
Select these options in the right-hand menu of the publishing page.
Category: Trend Analysis OR Bitcoin
Tags: CME Bitcoin BTC Gap Futures Weekend
Step 4: Final Checklist Before Clicking "Publish"
Load the Code: Make sure the "Manual Fix" version of the code (the last one I gave you) is currently open in the Pine Editor.
Add to Chart: You must click "Add to Chart" so the script is visible on your screen before publishing.
Privacy: Select Public (so others can search for it) or Private (if you only want to share the link).
Visibility: Choose Open (so others can see the code) or Protected (if you want to hide the code, though Open is better for simple scripts like this).

9/21 EMA Trend TOP rIGHT CORNER INDICATORCrossover indicator for the 9 & 21 EMA. Buy Sell for cross up or down respectively. Daily, weekly and Monthly trend.

BTC Risk Metric DCA Adapter (3Commas Webhook Strategy)Risk Metric DCA Adapter (3Commas Webhook Strategy) - WORK IN PROGRESS
This Pine Script strategy, originally inspired by the Risk Metric Indicator, is fundamentally engineered as an Adapter to interface with external trading bots like 3Commas via Webhooks. It calculates a dynamic market risk score and translates that score into specific dollar-cost averaging (DCA) entry levels and tiered profit-taking exits.
Key Features & Logic
Risk Metric Calculation (Credit to The Trading Parrot):
The strategy incorporates a complex, multi-timeframe Risk Metric calculation based on daily and weekly moving averages (SMA) and standard deviation (StDev). This metric aims to quantify the current market overextension or compression relative to long-term historical data. The resulting score dictates the level of conviction for a new trade.
Tiered DCA Entry Sizing:
The strategy defines three distinct Buy Levels (L1, L2, L3) corresponding to increasingly favorable (lower) Risk Metric scores.
L1 (Base): Risk is moderate, initiating the minimum defined trade amount.
L2 (Scaled): Risk is low, initiating L1 amount + L2 amount.
L3 (Aggressive): Risk is very low, initiating L1 + L2 + L3 amounts.
Tiered Profit-Taking Exits:
The strategy implements a staggered, partial profit-taking approach based on the Risk Metric rising:
Sell L1 & L2: Closes a percentage of the current position when the Risk Metric reaches defined high thresholds, locking in partial profits.
Sell L3 (Full Exit): Closes the remaining position when the Risk Metric reaches the highest defined threshold.
The Adapter Function (Webhook Integration)
This script is unique because it uses the Pine Script strategy() function to trigger Order Fills, which are necessary to access powerful placeholders in the TradingView alert system.
Trigger Type: The alert must be set to trigger on Any order fill.
Dynamic Webhook Data: Instead of using fixed alert() commands, the strategy generates dynamic labels (e.g., BUY_ENTRY_L3_USD_1000 or SELL_L1_PCT_25) using the strategy.entry and strategy.close commands.
Data Transfer: The alert message then uses the placeholder {{strategy.order.comment}} to pass these dynamic labels to the 3Commas bot, allowing the bot to execute the precise action (e.g., start_deal_with_volume_in_quote_currency or close_deal_at_market_percentage).
Full Strategy Webhook payload
{
"secret": "YOUR_3COMMAS_SECRET_KEY",
"max_lag": "300",
"timestamp": "{{timenow}}",
"trigger_price": "{{close}}",
"tv_exchange": "{{exchange}}",
"tv_instrument": "{{ticker}}",
"action": "{{strategy.order.action}}",
"bot_uuid": "YOUR_BOT_UUID",
"strategy_info": {
"market_position": "{{strategy.market_position}}",
"market_position_size": "{{strategy.market_position_size}}",
"prev_market_position": "{{strategy.prev_market_position}}",
"prev_market_position_size": "{{strategy.prev_market_position_size}}"
},
"order": {
"amount": "{{strategy.order.contracts}}",
"currency_type": "base",
"comment": "{{strategy.order.comment}}"
}
}
Disclaimer: This script is an adapter tool and does not guarantee profit. Trading requires manual configuration of risk settings, bot parameters, and adherence to platform-specific setup instructions.

Systemic Net Liquidity (Macro Fuel for Crypto & Stocks)This indicator tracks Systemic Net Liquidity, the single most important macro factor for determining the long-term trend of risk assets like Bitcoin (BTC) and major indices (S&P 500). It measures the amount of actual cash available in the financial system to chase speculative assets, distinguishing between money that is circulating and money that is locked up at the Federal Reserve.
Mechanism (What It Measures)
The script uses direct data from the FRED (Federal Reserve Economic Data) to calculate the true state of market funding:
\text{Net Liquidity} = \text{Fed Assets (WALCL)} - \text{Treasury General Account (TGA)} - \text{Reverse Repo (RRP)}
1. Fed Assets (WALCL): The total balance sheet of the Fed (The overall supply of money).
2. Treasury General Account (TGA): Funds the US Treasury collects via bond issuance. When the TGA rises, liquidity is actively drained from the banking system (A major bearish pressure).
3. Overnight Reverse Repo (RRP): Cash parked by banks and money market funds at the Fed, effectively frozen and not contributing to market activity.
How to Interpret Signals
Treat the Net Liquidity line as the market's "Fuel Gauge":
📈 BULLISH SIGNAL (Liquidity Injection): When the Net Liquidity line is rising, money is flowing back into the system, signalling a tailwind for risk assets.
📉 BEARISH SIGNAL (Liquidity Drain): When the line is falling (often due to high TGA balances), cash is being removed. This signals major friction and pressure on price action.
⚠️ DIVERGENCE WARNING: A strong signal is generated when Price (e.g., BTC) rises, but Net Liquidity falls. This macro divergence strongly suggests a major trend reversal or correction is imminent.
Important Notes
Data Source: Data is directly sourced from FRED and updates daily/weekly. This tool is best used for macro analysis and identifying high-level cycles, not short-term scalping.
Disclaimer: Use this indicator as a confirmation tool within your broader strategy. It is not a standalone trading signal.
