Dynamic ATR BandsDescription:
The Dynamic ATR Bands indicator visualizes ATR-based stop-loss, take-profit, and trailing levels. Bands can be drawn relative to a fixed entry price or dynamically relative to the current price. It is ideal for trend-following, swing trading, and hybrid strategies, especially on volatile or noisy instruments.
Key Features:
Base ATR Bands:
Plots ATR-based bands above and below a reference price.
Acts as initial stop-loss or target guidance.
Adjustable multiplier (default 1× ATR).
Extra ATR Band:
Add an additional ATR band at a custom multiplier.
Position it above or below the reference price.
Useful for trailing stops or extended profit targets.
Hybrid Entry Mode:
Use Fixed Entry Price: bands are drawn relative to your entry and remain fixed.
Dynamic Mode: bands behave like standard ATR bands, moving with the current price.
Allows visualization of hybrid ATR stop-loss and trailing strategies.
Clean Visuals:
Color-coded bands differentiate base (solid) from extra (semi-transparent).
How to Use:
Set ATR length and multipliers according to your strategy.
Toggle hybrid entry mode and input your entry price, or leave off for dynamic bands.
Set the extra band multiplier and choose its position (upper/lower).
Use the bands as visual guides for stop-loss, take-profit, and trailing levels.
Inputs:
ATR Length: number of periods for ATR calculation
Base ATR Multiplier: distance of base bands from reference price
Extra ATR Multiplier: distance for the additional band
Extra Band Position: choose Upper or Lower
Use Fixed Entry Price: toggle hybrid entry mode
Entry Price: specify entry price if hybrid mode is enabled
Note:
This script is visual only; it does not place trades. It is designed to help plan ATR-based stop-loss, take-profit, and hybrid trade management visually on the chart.
Customize

Normalized Oscillators Spider Chart [LuxAlgo]This indicator displays a spider chart overlaid on the user’s current chart allowing the visualization of information given by various normalized oscillators. It is possible to customize the spider chart by hiding certain oscillators from within the settings which removes their corresponding spokes from the chart.
Users can control the length settings of each oscillator individually or use a global length setting that applies to every oscillator. An additional meter element is displayed and aims to give the overall sentiment returned by the oscillators. This can also be used to gauge whether the market is trending or ranging.
This is a relatively simple application of a spider chart but can prove to be useful to some users.
1. Settings
RSI: Displays the Relative Strength Index spoke on the spider chart, includes the length setting on the right of the toggle.
%K: Displays the Stochastic Oscillator "%K" spoke on the spider chart, includes the length setting on the right of the toggle.
COR: Displays the Correlation Oscillator spoke on the spider chart, includes the length setting on the right of the toggle.
MFI: Displays the Money Flow Index oscillator spoke on the spider chart, includes the length setting on the right of the toggle.
WPR: Displays the Williams Percent Rank oscillator spoke on the spider chart, includes the length setting on the right of the toggle.
%UP: Displays the percentage of upward variations spoke on the spider chart, includes the length setting on the right of the toggle.
CMO: Displays the Chande Momentum Oscillator spoke on the spider chart, includes the length setting on the right of the toggle.
AOS: Displays the Aroon oscillator spoke on the spider chart, includes the length setting on the right of the toggle.
Global Oscillators Length: Determines whether all oscillators should use the same length settings, determined by the setting on the right of the toggle.
1.1 Style Settings
Spider Chart Length: Determines the horizontal width of the spider chart.
Spider Chart Offset: Offset between the most recent bar and the left extremity of the spider chart.
2. Usage
A spider chart can be a very useful visualization tool when it comes to seeing the individual characteristics of various variables at the same time.
Here, the tool can give a general sentiment on the direction of the trend without adding each indicator to your chart. It is also possible to determine when an oscillator is considered overbought or oversold with this indicator.
The dashed line represents the central value for each oscillator.
Disabling any of the oscillators from the settings will return a spider chart using fewer spokes.
The script also displays a meter that can be used to determine the overall sentiment given by all oscillators. This metric is based on the average value between each oscillator. An overall sentiment closer to 50 would indicate a ranging market.

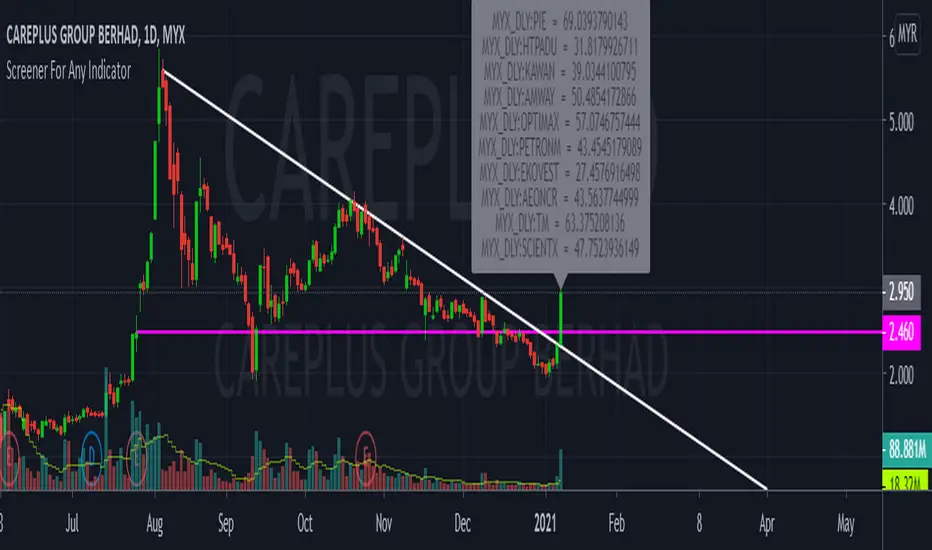
CustomScreenerTo apply your indicator with screener , please modify the section which i mention "Start your indicator pine script" & "End your indicator pine script"
At the pinescript section you will able to change the ticket symbol .
I only able to show screener result with 10 item in 1 times . To view more result, please go to setting and change stock list "1-10">"11,20">"21-30".....
Able to screener 100 items with this indicator.
Kindly change the exchange and stock in the pinescript according your watchlist.
As examples, my indicator is to determine the stock in which trend, i want to find out all stock with aqua color trend
The screener result show only 9 of 10 are in aqua color trend.
Rubber BandOne indicator for ALL
Bollinger Bands :
A well known system for defining volatility and Squeeze / expansion
Moving Averages :
SMA 50 (color coded based on direction) for showing the dynamic trend line
EMA 15 for showing local resistance / support lines
SMA 100 and 200 for showing higher time frame resistance/ support or dynamic trend lines
Ichimoko Cloud:
From all the Ichimoko indicator system, it's cloud is one of the best parts to show you the future possible resistance/support zones but it will occlude the chart, so, why not have the needed part?
Parabolic Sar :
One the good indicators to show the shift in the momentum and the power behind it, color coded for easier definition of bullish from bearish
Pivot Points :
One of the best indications for resistance / support levels, separated check mark to hide or show each line, up to 5 support and 5 resistance levels.
Automatic Fibonacci Retrace :
One check mark, and instead of Pivots, you will see the fibo levels to find possible retrace positions
Draw all if them and you will find one of the most complete yet robust indicators to be used will enough information in it. This script is fully customize-able, from the number of candles each time frame will look back to find fibo levels up to the parameters used for parabolic sar or bollinger bands.
For getting access to this script, all you need is to send 0.01 bitcoin (the amount should sit in the wallet after reduction of the fee) to the following address and contact me via pm and giving me the transaction information. I will give you the access as soon as that 0.01 Bit sits in the wallet. Also, the license is life time, so with paying once, you will get access to this indicator's updates (if any in the future) your whole life.
Here are some images from the input and style section :
prntscr.com
prntscr.com
prntscr.com
prntscr.com
prntscr.com
prntscr.com
prntscr.com
prntscr.com
prntscr.com
prntscr.com
prntscr.com
I hope you enjoy using this indicator and win money ;)
Bitcoin Address to Buy this script :
1PB3TBm85JC6Y3jxifv3Y5i9p1pu2vbofi
Amount to buy the script
0.01 BTC

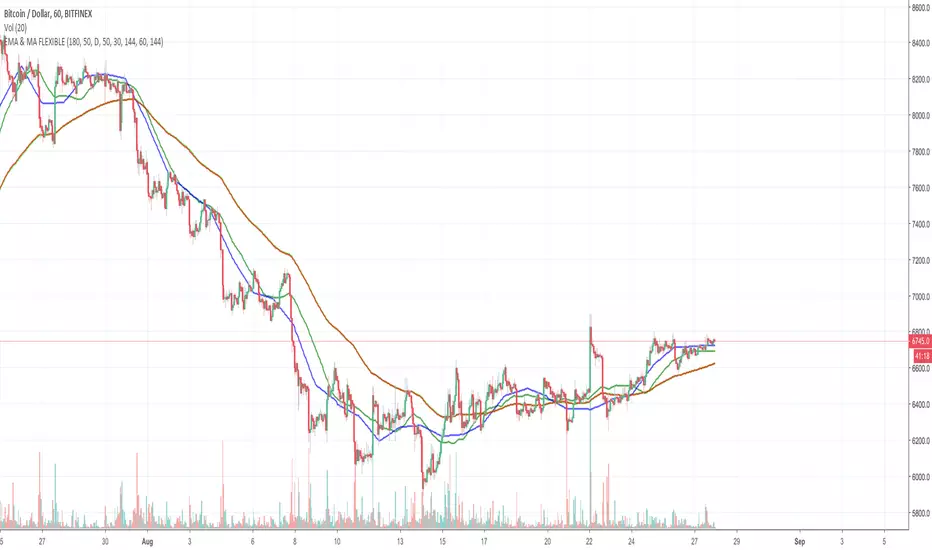
Price and EMA Difference Customizable [Requested script]
Easy options, you can toggle the lines and other things. Even turn of the histogram.

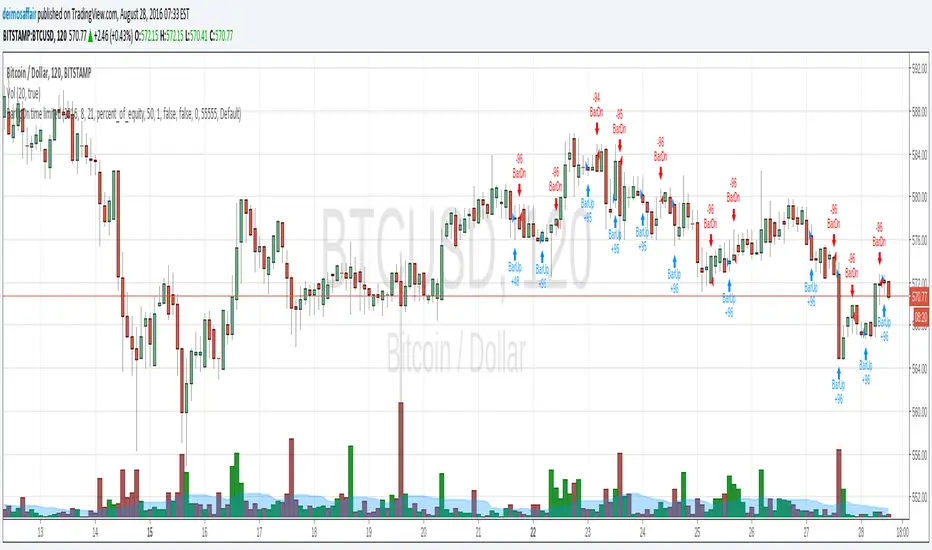
BarUpDn time limitedtrying to understand strategies, it appears that there is a lot of black magic in how a strat works behind the scenes.
anyway, it's hard to analyse what's all the data with one gazillion entries, and i wanted to know how we can manipulate/do stuff with a chart.
so, i needed to know how to "give" the script my values to work on. bundled two wants/needs into one, and created a script that only applies a strategy from the date given onwards.
how to use:
at the chart, go to the "format" little button, then the input tab, and there is all the date fields i created. fun to set it to the current date, then start going backwards and see all the little arrows filing up the chart :)
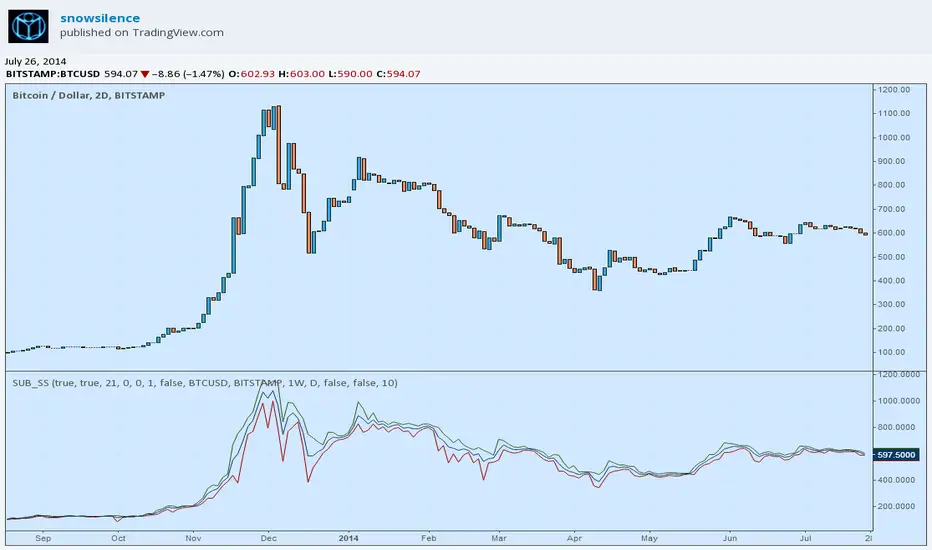
Substratum Module [snowsilence]This module is meant to act as a framework and platform over which to develop other indicators. On its own it does essentially nothing, yet simplifies the work of adding basic customizations and flexibility to ideas immediately. The chart on this post is not a demo, so its better to just try adding the indicator to a test chart — you may find it more convenient to set "overlay=true" in the study header — and look into the settings for an intuitive sense of its purpose.
Please build off of this, let me know if you find it useful, and credit/reference me where it seems reasonable. Feedback is always appreciated!