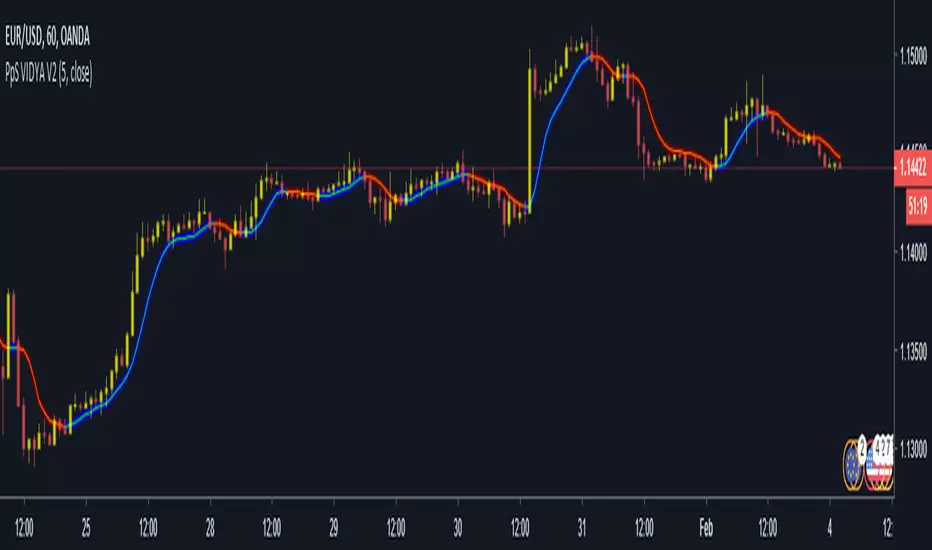
PpSignal Variable Index Dynamic Average V2The Moving Average is, perhaps, the most popular indicator in trading for a reason. Comparatively, the crossing average can tell you plenty about a trend, i.e. whether it’s broken or unbroken, changing or holding. But the Moving Average isn’t perfect; there is one area where it falls short and that is volatility. Even an Exponential Moving Average, which places more emphasis on the latest data, can miss the mark when it comes to a sudden change in volatility, rising or falling. Consequently, it can either give a fake signal or else generate a signal only when it is too late to trade on. Volatility is where the Variable Index Dynamic Average comes in, or VIDYA for short.
The Variable Index Dynamic Average or VIDYA was developed by Tushar Chande, and its focus is precisely on volatility. In other words, the VIDYA is an average that adjusts itself to changing volatility. When volatility is high, the VIDYA becomes more sensitive and when volatility is low, the VIDYA becomes less sensitive. That allows you to assess the trend according to current market conditions (and not irrelevant conditions that had earlier prevailed).
The VIDYA in Essence
The math behind the VIDYA formula is quite complicated, but the logic is not.
The VIDYA essentially has two components, the first being the Exponential Moving Average (aka EMA). The second indicator is in the “oscillator family” and it is known as the Chande Momentum Oscillator (aka CMO). Like most oscillators, the Chande Momentum Oscillator generates a signal of -100 and 100, with -100 being oversold and 100 overbought. The EMA is the anchor index, and the CMO’s job is to adjust the exponential average to volatility. The closer the CMO is to 100 or -100 the higher the volatility and the more sensitive our exponential average will turn. Conversely, the closer the CMO is to 0 the less sensitive our exponential average will turn. The final reading after the volatility adjustment is the VIDYA.
As you can see below, once you add the Variable Index Dynamic Average in MetaTrader you get a window with two parameters from which to choose: One is the Period CMO and the other is Period EMA. We can then decide which period the CMO will run on (and thus affect the sensitivity of our EMA) and which period the EMA will run on (to capture our trend). Usually, the best CMO to plug in is a third of the value of the EMA duration; this is to allow the latest change in volatility to impact to the greatest degree. If the CMO period is too long, it will likewise spread over the period too long and consequently fail to reflect current levels of volatility, thus defeating the VIDYA’s purpose.
VIDYA
Comparing the VIDA to the EMA
When we compare the two, we can see the clear advantages the VIDYA(Red) has over the EMA(Green). Both the VIDYA and the EMA run on a 30-week period, but the VIDYA is smoothed out by the Chande Momentum Oscillator running on a 10-week period (again, a third of the whole period). The VIDYA simply captures the trend much more accurately. We can see how, in Point A, when momentum weakens, the Variable Index Dynamic Average starts to flatten, while the EMA just moves across the price and fails to adjust.
This quality is especially beneficial when we want to get an indication if a trend has broken or not. The EMA, in this case, suggests the trend has, indeed, broken but when we look at the VIDYA we quickly get a more accurate picture. We can see that the downtrend has not been broken which allows us to prepare for another bearish round rather than mistakenly expect a rebound.
VIDYA
Of course, for every upside there is a downside and the downside of the VIDYA is that it becomes less effective on a very high duration, such as above 90. The Chande Momentum Oscillator cannot reflect sentiment very well when the duration ןד high and therefore it stops being effective at balancing the Exponential Moving Average within the Variable Index Dynamic Average. One way to tackle or mitigate this is to go higher in the intervals whenever possible, such as from days to weeks or weeks to months. Nonetheless, you should be cognizant of this in inherent weakness in the Variable Index Dynamic Average. Yet, despite that, the Variable Index Dynamic Average does a very effective job. If you are trading under volatile conditions and want to figure out if a trend is broken or set to continue, the Variable Index Dynamic Average could be the solution. When combined with other indicators of momentum, the VIDYA can give you the bigger, clearer picture.
www.onestepremoved.com
Cryptotrader
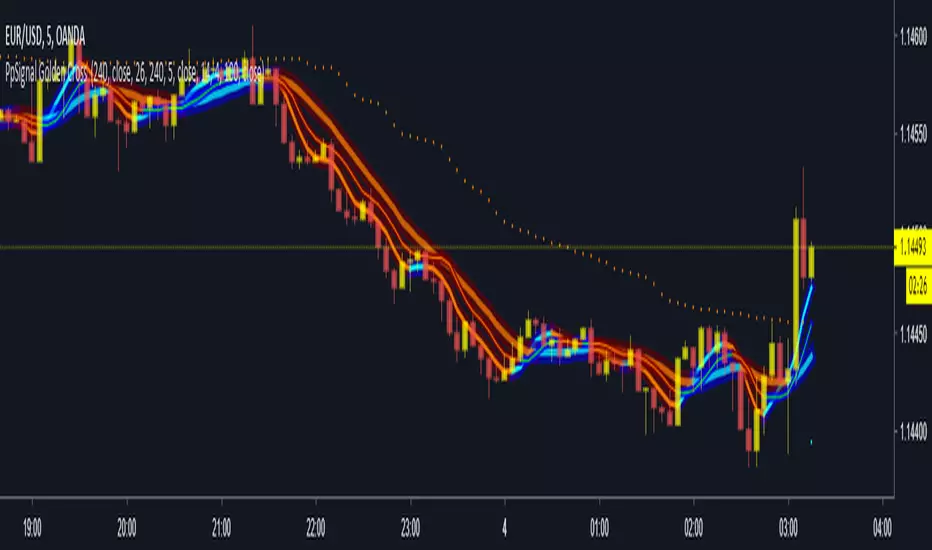
PpSignal Golden Cross we did a 3 move average combination.
We recommended use with ewo MTF breack band.
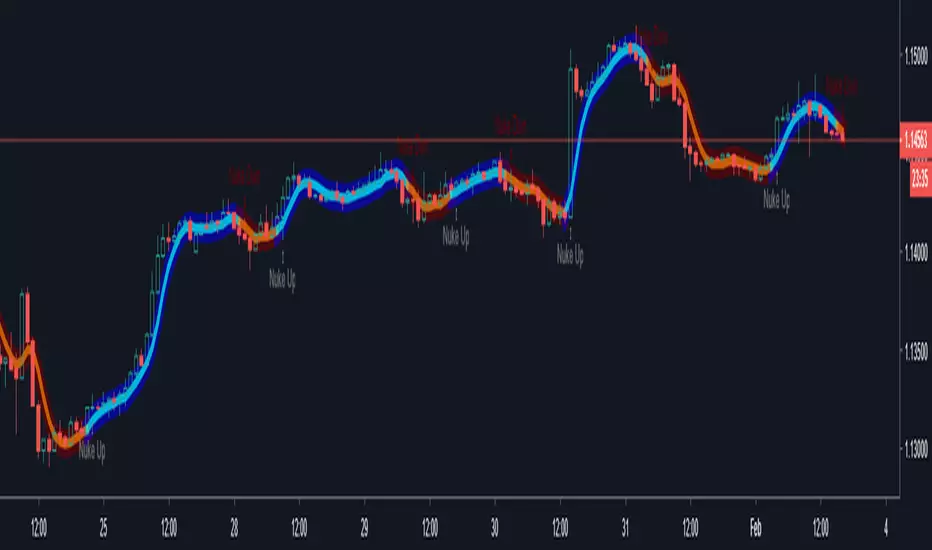

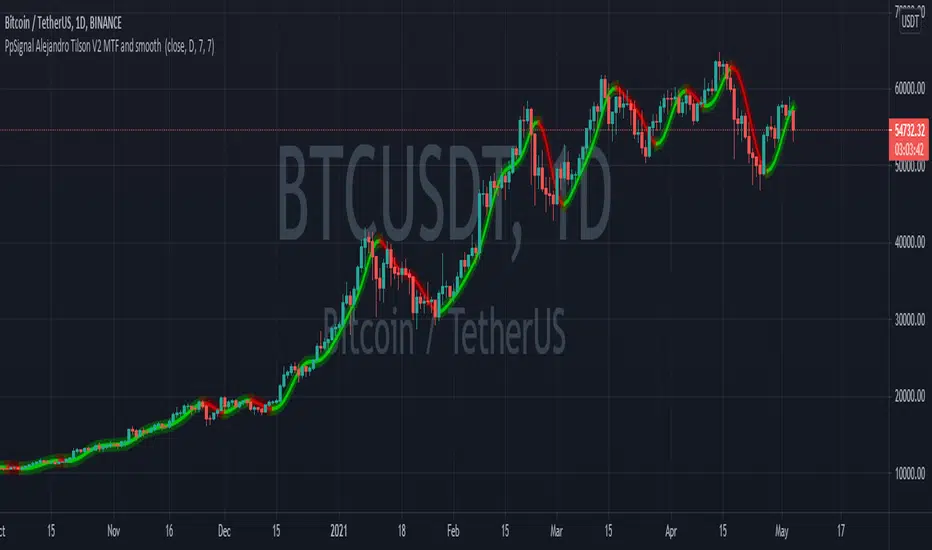
Alejandro Tilson T3 V2 MTFTilson Move average with John Ehlers smooth system adn buy or sell signal trade.
enjoy
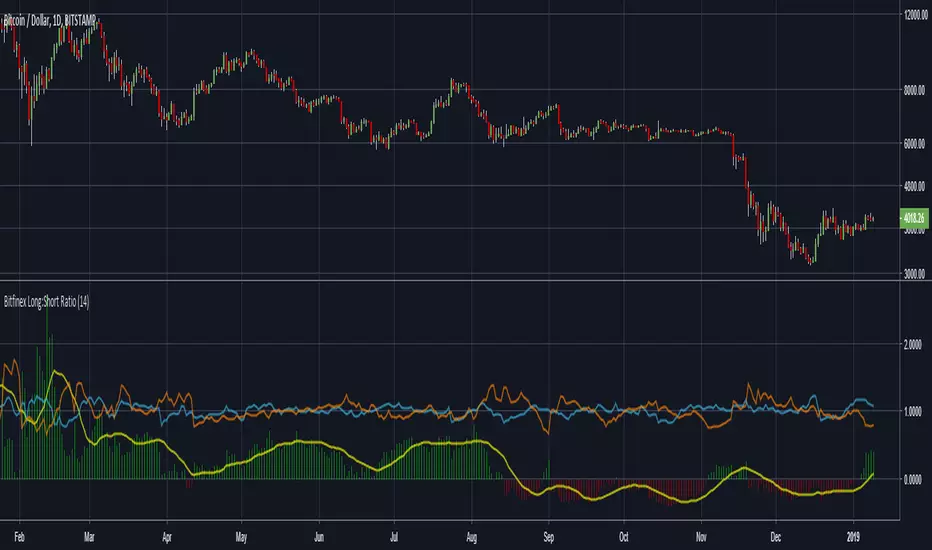
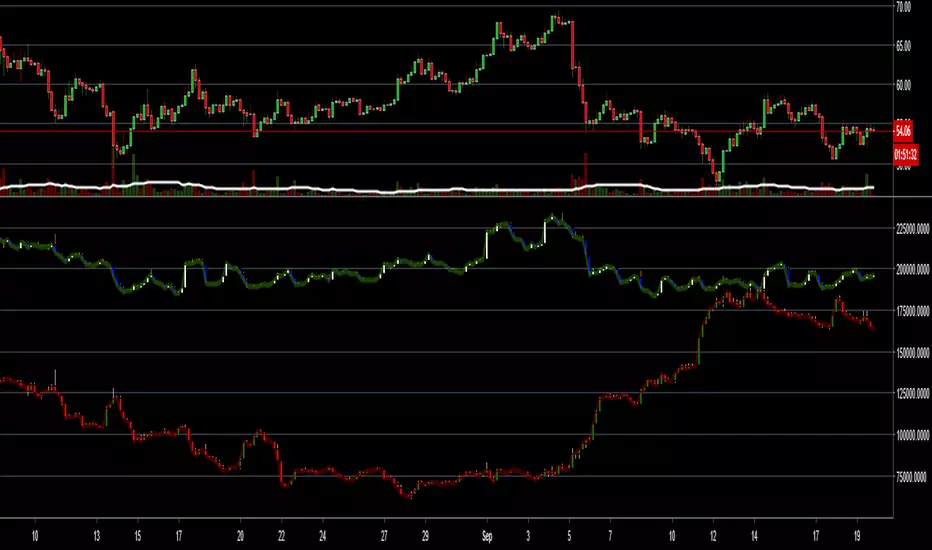
Bitfinex Long:Short RatioThis is a simple indicator that creates a ratio of margin Long & Short positions on Bitfinex for the ticker you currently have selected. If the ticker you are looking at does not have margin positions on Bitfinex; it will error out - however when you select another ticker it automatically resets.
The indicator provides the following:
Histogram of the ratio of margin Longs to margin Shorts. + results (green) are higher longs; - results (red) are higher shorts. NOTE: A 1:1 ratio has been offset to a 0 cross for the benefit of the histogram
A simple moving average line (yellow) for quick reference of current margin trend. Length is adjustable viable input.
A plotted line (blue) of margin longs as a ratio to the SMA of Longs. Above 1 indicates acceleration of trend; below 1 indicates deceleration
A plotted line (orange) of margin shorts as a ratio to the SMA of Shorts. Above 1 indicates acceleration of trend; below 1 indicates deceleration
Ratio is based on the close position and is intended as reference only. Don't rely on this supplied information as a sole indication prior to making a trade.
Megalodon
Why Megalodon?
We believe that enlightening others is an incredible way to make this world a better place. That's why we created the tools you need to stop worrying about your investments and focus on what really matters in your life.
What is Megalodon?
Megalodon uses Artificial Intelligence that combines 574 back-tested indicators and 2674 back-tested setups, simultaneously.
Megalodon works with any kind of asset , market state and time frame .
What is the win rate?
Megalodon is extremely accurate and offers insane profits as long as the fundamental analysis is done right .
Backtesting results can be found on our social media or down below .
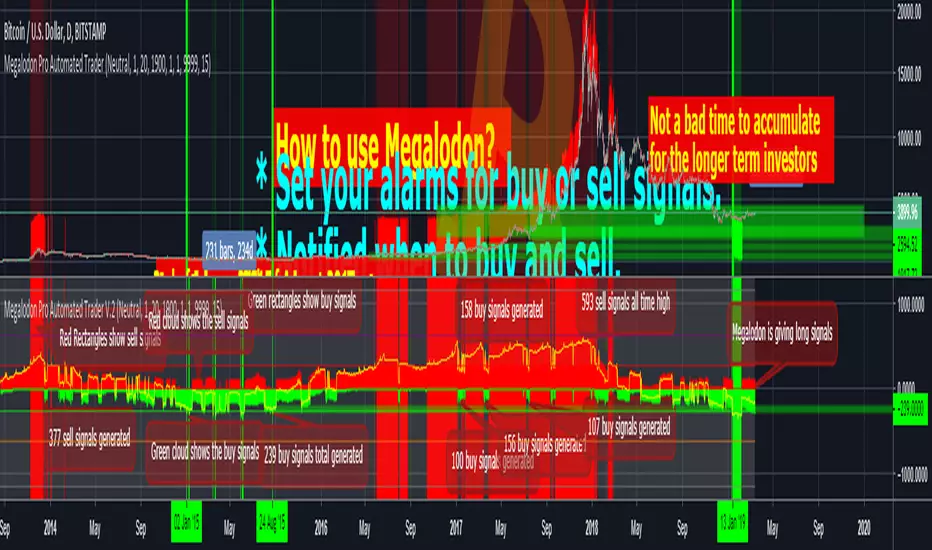
How to use Megalodon Pro Automated Trader?
Simply, orange rectangles are buy signals and purple rectangles are sell signals .
Green clouds show buy signals and red clouds show sell signals.
Yellow line shows the difference between buy and sell counts.
How to set alarms on Megalodon Pro Automated Trader?
Click on Alert, select Megalodon Pro Automated Trader and click on Buy-Signal or Sell-Signal. More details can be found on our social media.
You may also watch our Megalodon Investing Tutorials on Youtube for more information.
How to purchase?
Megalodon is totally FREE .
You may upgrade to Megalodon Pro for the most important features , including automizing your trading on any asset profitably, setting up alarms to get notified , joining to our VIP telegram channel to get daily updates and our VIP telegram group to interact with the community. Simply go to our website on our TradingView page for learning more and joining us for free.
Some of the backtesting results are:
BTC/USD for longer time frame trading in the bear market for the last year.
APPLE for longer time frame trading in the bull market for the last 10 years.
EURO/USD for day trading in the neutral market for the last month.
BTC/USD for day trading in the bull market for the last 15 days.
APPLE for day trading in the neutral market for the last 2 days and 6 hours.
Megalodon Pro Automated Trader
Why Megalodon?
We believe that enlightening others is an incredible way to make this world a better place. That's why we created the tools you need to stop worrying about your investments and focus on what really matters in your life.
What is Megalodon?
Megalodon uses Artificial Intelligence that combines 574 back-tested indicators and 2674 back-tested setups, simultaneously.
Megalodon works with any kind of asset , market state and time frame .
What is the win rate?
Megalodon is extremely accurate and offers insane profits as long as the fundamental analysis is done right .
Backtesting results can be found on our social media or down below .
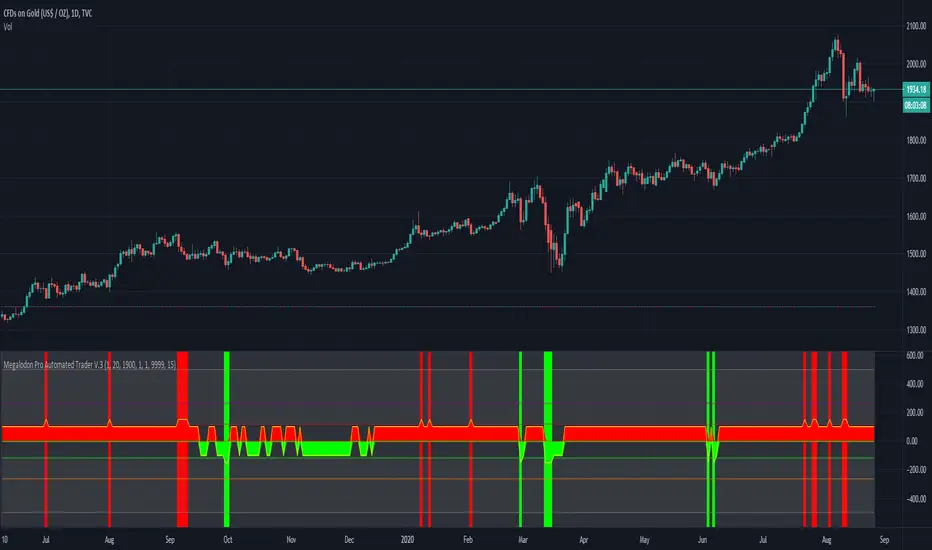
How to use Megalodon Pro Automated Trader?
Simply, orange rectangles are buy signals and purple rectangles are sell signals .
Green clouds show buy signals and red clouds show sell signals.
Yellow line shows the difference between buy and sell counts.
How to set alarms on Megalodon Pro Automated Trader?
Click on Alert, select Megalodon Pro Automated Trader and click on Buy-Signal or Sell-Signal. More details can be found on our social media.
You may also watch our Megalodon Investing Tutorials on Youtube for more information.
How to purchase?
Megalodon is totally FREE .
You may upgrade to Megalodon Pro for the most important features , including automizing your trading on any asset profitably, setting up alarms to get notified , joining to our VIP telegram channel to get daily updates and our VIP telegram group to interact with the community. Simply go to our website on our TradingView page for learning more and joining us for free.
Some of the backtesting results are:
BTC/USD for longer time frame trading in the bear market for the last year.
APPLE for longer time frame trading in the bull market for the last 10 years.
EURO/USD for day trading in the neutral market for the last month.
BTC/USD for day trading in the bull market for the last 15 days.
APPLE for day trading in the neutral market for the last 2 days and 6 hours.
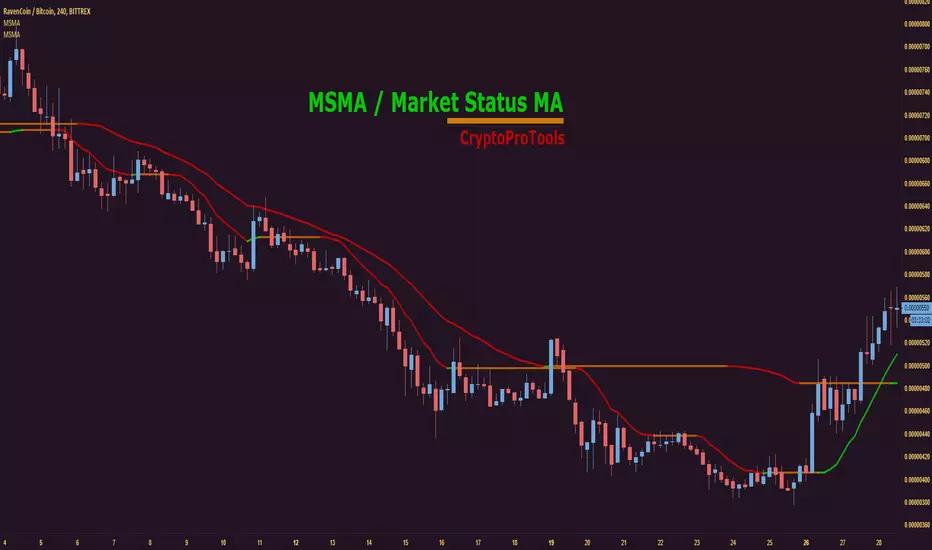
Market Status Moving AverageGet a quick easy view of the current market status.
Examples used above are lengths 6 and 15, but you can tweak to your liking.
Want to stop sweating the small stuff and see the bigger picture? Try increasing the length to 50, 100 etc
Green = Bullish
Orange = Consolidation / Flat
Red = Bearish
--------------------------------------------------------------------
--------------------------------------------------------------------
Check out some of our other recent releases below :
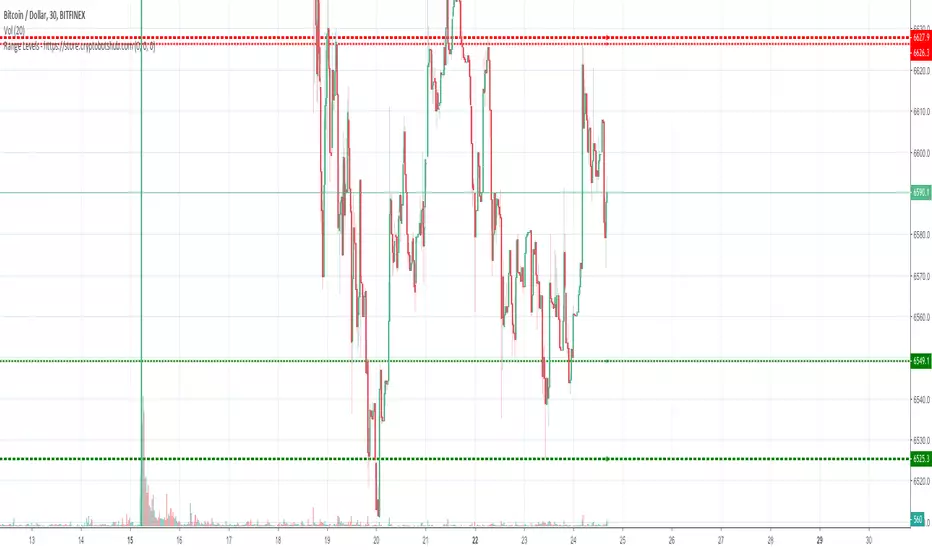
Range Levels - High and Low of Daily, Weekly, and Montly RangesThis is a great free script for the current ranging crypto markets.
You can see the daily, weekly, and monthly high and low of ranges. It also has alerts that you can enable in the settings and then setup in your TradingView alerts for when the price crosses these levels.
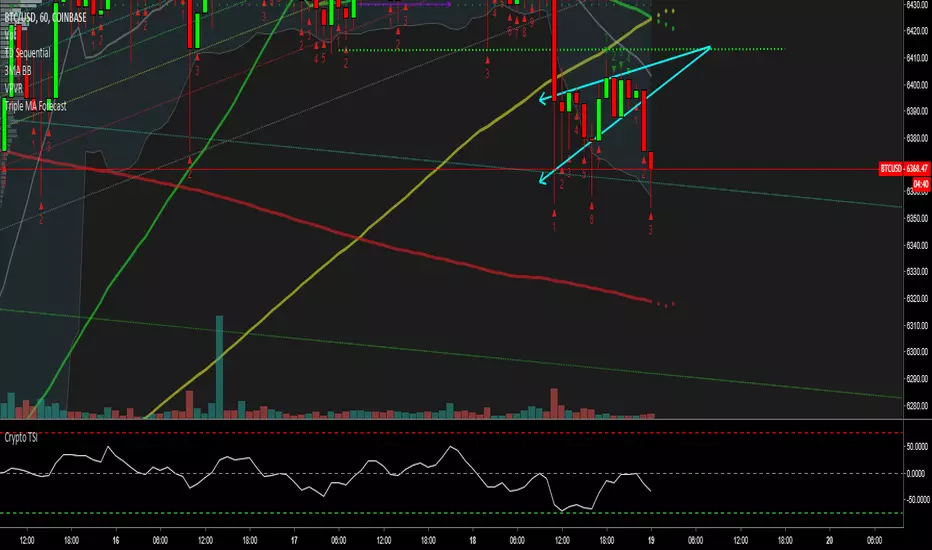
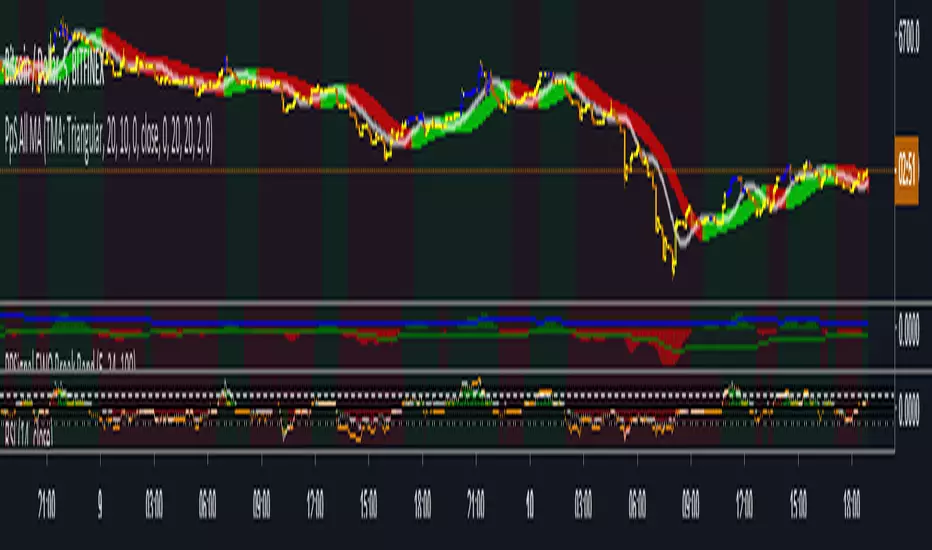
PpSignal ALL MOve Average 1.0Different moving average, Kaufman Adaptive Moving Average, Wilder's Moving Average, Triangular Moving Average , ZLEMA, EMA, SMA , HULL, ALMA, TEMA, ETC. -
BITFINEX:BTCUSD
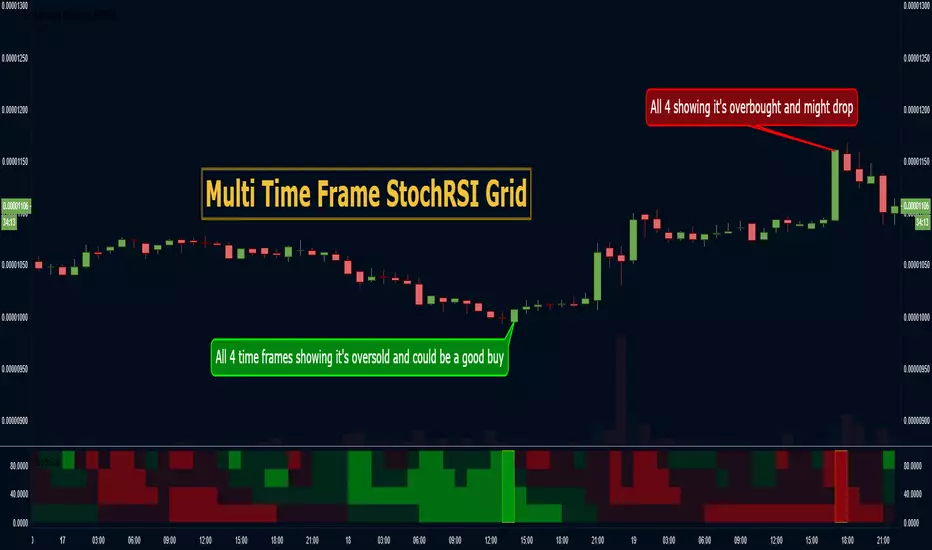
MTF StochRSI Grid v2.0 - CryptoProToolsNew version has added the following :
- Custom Time Frames (not limited to TradingViews default resolution selection)
- Optional Medium Strength Signals (Matching 3 x OB or OS instead of the full 4)
- Toggle Highlight Bar Colors ON and OFF
- Signal arrows visible above and below the grid
Original Version Can Be Found Here :
Get Access To This + All of our other current and future indicator releases with a CryptoProTools Lifetime Membership
------------------------------------------------
Other Popular CryptoProTools Releases

MTF StochRSI Grid - CryptoProToolsUsing this Grid you can monitor StochRSI OB and OS levels across multiple time frames with ease!
----------------------------------------------------------------------
Popular Recent Releases by CryptoProTools
----------------------------------------------------------------------
----------------------------------------------------------------------
May the profit be with you!
LTC Shorts & Longs (candles) - BitfinexSimilar version of my other scripts - this one is for LTCUSD Shorts and Longs in one indicator including the candles so you can see actual movement as well.
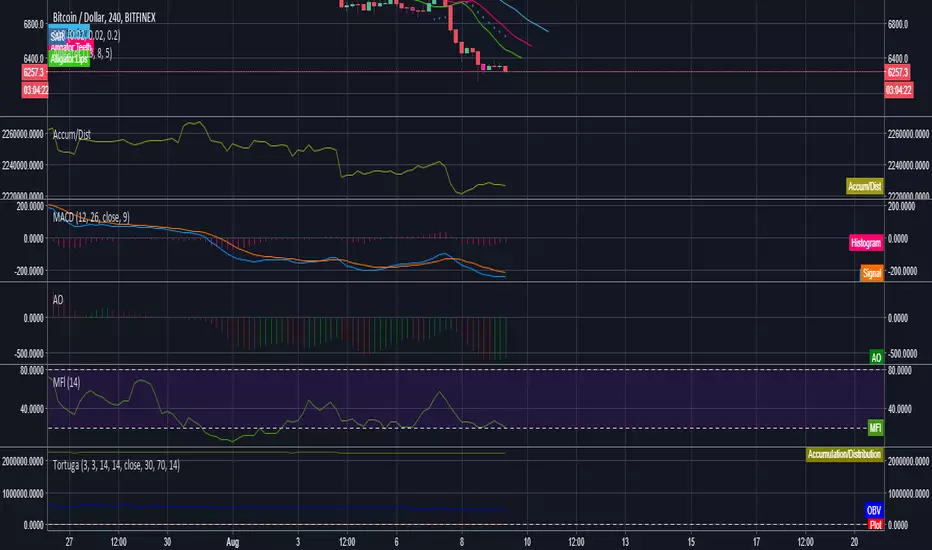
RELEASE THE BEAST! Tortuga V4 FULL RELEASE!GOOD EVENING FELLOW TRADERS!
The Tortuga V.4 indicator is now fully finalized and ready for trading. This indicator utilizes a combination of momentum, volume, volatility, and price action to create top tier condition signals for both long and short positions. In the Tortuga V.4 indicator, I have updated lines of code to: make long signals more common, make long signals more precise, make short signals more precise, and make short signals more common.
If you are interested in the Tortuga V.4 indicator, shoot me a PM.
As always, trade happy!
James

WMHA IndicatorFinalized name of my new indicator - WMHA - is now for sale for $40, on a monthly subscription basis. A free 15 day trial is offered for this indicator as well. This indicator can be used on timeframes above 5 minutes and below 4 hours. On a two week mock portfolio run, the indicator was 76% successful when placing a 0.69% stop-loss. That is right, a stop loss less than 1%. The two week mock portfolio yielded 75% profit compared to your initial trading stack value, and a 15% yield of profit for overall equity. This was using no leverage. With such a successful test run, utilizing such a low stop-loss, one could use 3x-10x leverage when using this indicator to make their profits grow exponentially and successfully. More videos of the WMHA Indicator will be posted shortly, if you have any interest in subscribing to my indicator, shoot me a PM.
As always, trade on.
James

Squeeze indicator V1This is the fifth indicator I am releasing. Will update description, releasing currently for subscribers. If you have any questions about subscribing to any of my indicators, send me a Direct Message.

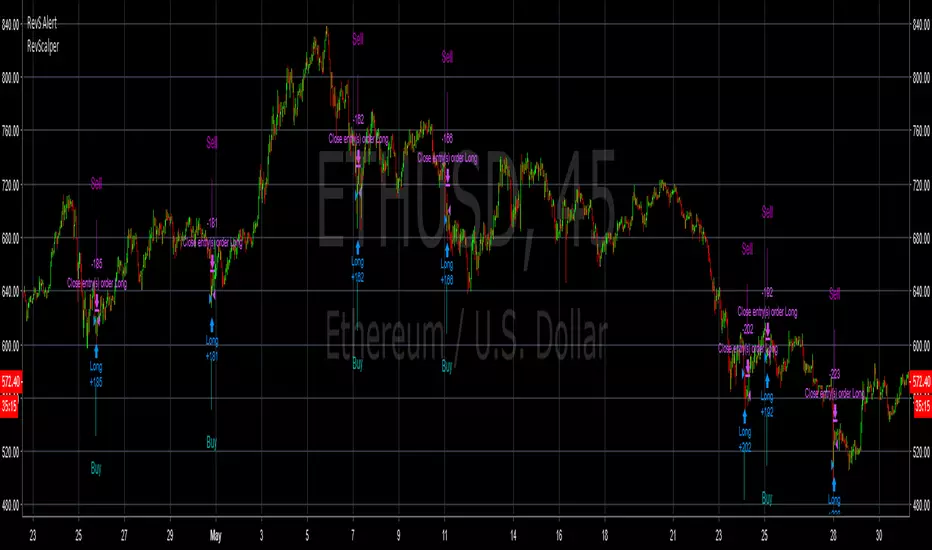
Crypto Reversal Scalper AlertsThis is the alerts for
The script that will detect a reversal with two variables. The script will then attempt to scalp against the trend short-term.
Absolutely, NO REPAINTING. Can be used across crypto pairs.
You must use ONCE PER BAR for alerts! Yes it does work! <- MAKE SURE YOU SET ALERTS PROPERLY!
PM me for a trial.
Cost for the bot will be 0.01 BTC/month. Cost can be negotiable.
Tortuga IndicatorAfter long hours of figuring out what the fuck makes my indicator tick - the Tortuga indicator is finally finished. This indicator entails multiple conditions from indicators: AO, MACD, STOCH RSI, MFI, AD, and OBV. The help identify the most optimal Long or Short positions. The indicator also has been coded to identify Bullish and Bearish divergences on timeframes that have been tested to have a significant effect on prices. The indicator has been backtested to have a 75% win rate with long and short positions on timeframes: 15m, 30m, 45m, 1hr, 2hr, 3hr, and 4hr.
Indicator Guidelines/Legend:
Signals:
Blue Candle: Long Signal
Yellow Candle: Short Signal
Divergences:
Fuchsia Candle: 5 length Bull Divergence
Purple Candle: 10 length Bull Divergence
White Candle: 5 length Bear Divergence
Silver Candle: 10 length Bear Divergence
Gray Candle: 20 length Bear Divergence
The Divergence candles are merely suggestions and hints for potential price movements. While they have been shown to be effective position signals, they have not been backtested - stick with the Blue and Yellow candles.
This indicator is for sale with a monthly fee, DM for details. The price will increase upon updates and successful forward testing.
EdgeAnalysisGroup: Fibbonaci BarsPrivate Message me for more info and EAG Scripts
-------------------------------------------
Colored bars based on EAG Fib MA script.
Potentials:
colorA changes to colorB going down = Open Short or Short Continuation
colorA changes to colorB going up = Open Long or Long Continuation
colorA changes to colorB and the next bar is colorA = Reversal Pattern
Based if used with the Yume Wave or a crypto modified RSI indicator
to determine the likelyhood of color reverse or breakout

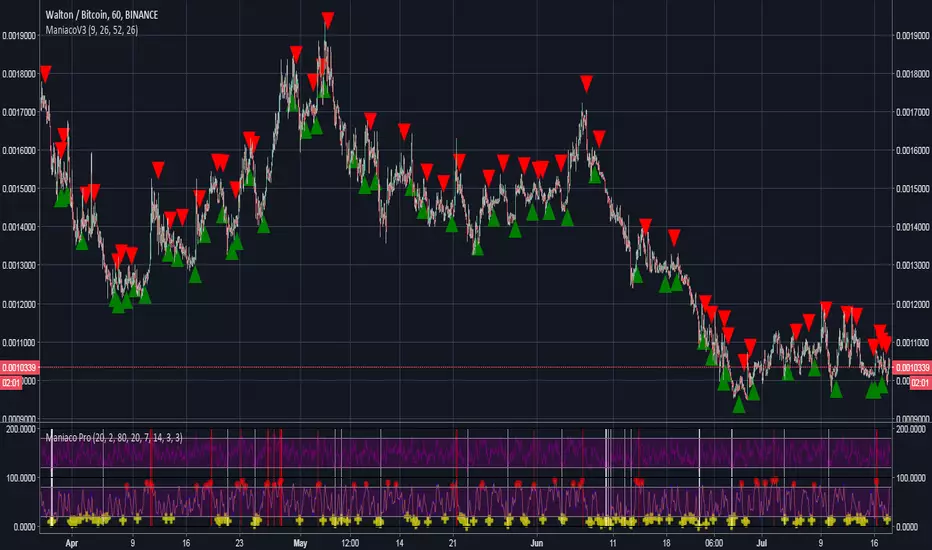
Maniaco ProWe wont reveal the secret sauce, use default settings for best results.
Best on ALTcoins.
WHERE TO GET IT
www.patreon.com
www.youtube.com
Works on any market condition
All time-frames
Do your own backtest and ENJOY the profits!!
Ichimoku Cloud ++I've had several members ask for it, so here it is!
This is the chart setup I use when day trading / swing trading.
It's essentially a crypto adjusted Ichimoku Cloud, along with the 200 EMA and a second "Nagarekomu Cloud"
By default I have the Tenkan-Sen and Kinjun-Sen hidden, but the option is there to turn them on if you prefer.
Basic Options Panel Includes :
Show Tenkan-Sen?
Show Kinjun-Sen?
Show Chikou Span?
Show Kumo?
Show Nagarekomu?
Show 200 EMA?
With this setup I'm looking for Kumo breakouts where the Chikou has a clear path.
The 200 EMA and Nagerekomu are there as extra confirmation as well as support/resistance zones.
0
Also, don't forget to check out some of our other recent script releases:
