NSDT Fracking CryptoThis indicator is part of our Fracking series of indicators and is specifically designed for scalping Crypto. It looks for a particular price action pattern/sequence then displays levels and a label on the chart to show a potential entry, target, and stop based on that analysis. Basically enter long through the green zones and short through the red zones. The target levels are not guaranteed to be hit, but are a good guide with high potential. Pivot Point levels were added for additional confirmation of potential key levels.
Trading is risking and you can lose money. Trade at your own discretion and risk. This indicator is only providing potential scalping zones based on recent price action.
Mata Uang Crypto

Dominion - Bitcoin Altcoin Dominance [mutantdog]A simple and easy reference tool displaying a plot of the market cap dominance values for several significant cryptocurrencies.
The most widely used of these is bitcoin dominance (the top indicator shown above) which calculates the total market cap of bitcoin in relation to the total cryptocurrency market cap, displayed as a percentage. This is commonly used by traders to assess the strength of bitcoin in relation to the broader crypto market; increasing values being indicative of larger bitcoin moves and decreasing values often indicative of potential altcoin cycles. Likewise, ethereum dominance (the bottom indicator shown above) is frequently used as a means to indicate the strength of ethereum in relation to the broader crypto market.
Included options for marketcap dominance values are:
Bitcoin : CRYPTOCAP:BTC.D
Ethereum : CRYPTOCAP:ETH.D
Total DeFi (a composite of multiple top defi tokens): CRYPTOCAP:TOTALDEFI.D
Stablecoins (shows the combined dominance values for usdt and usdc): CRYPTOCAP:USDT.D + CRYPTOCAP:USDC.D
Flippening (shows the difference between bitcoin and ethereum dominance values): CRYPTOCAP:BTC.D - CRYPTOCAP:ETH.D
When used in combination with each other, these can provide a good overview of the general flow of capital within the crypto market.
Additional functionality:
up to three optional moving averages with a choice of SMA, EMA, WMA and RMA for each.
multi timeframe selector
alert condition presets for various moving average crosses.
Please be aware that, while useful as reference, dominance calculations are known to repaint frequently. As such the use of this indicator and its alerts should require caution.

Reversal zone finderThis script would find potential reversal price zones according to RSI over bought or sell condition and big reversal candle.
It works better in range markets and lower time frames like 5M and especially in Support/Resistance zones.
Suit for scalping in forex or crypto markets.
* Use it as a trade assistant not a trade signal!

The Oracle v3 [Redbeard]Welcome,
as the name already says, this indicator will help you to find very early long and short signals for cryptocurrencies and stocks (Didnt test Forex yet).
In the comment section below, i will post some chart examples, in which you will see, how successful the indicator works, when you follow some rules.
1. What does the indicator contain:
This one indicator contains 5 different indicators, which 4 of them are being used as "confirmation signals".
Main Line: The green/red line is a modified RSI , so trendlines are easier to draw.
Stochastic: A regular stochastic indicator.
Multi Divergences: The red/orange and green/olive colored tags with numbers in it, display divergences.
MFI: The vertical blue/purple lines, are being displayed using a MFI calculation. They simply display potential tops/bottoms.
Long/Short Tags: The yellow and blue colored tags with the text "Long/Short" in it, are being displayed by another "secret" indicator.
White vertical line: This is only a offset, so everyone who uses this indicator, knows in which area he should look for trendlines .
2. How to use the indicator:
Its very simple: Trendlines
The only thing you have to do by yourself, is to look for trendline on the "green/red" Main line and to draw them.
If the Main Line closes above a resistance trendline or closes below a support trendline AND has 1-2 additional confirmation signals, then you might have a good early entry.
The most important thing are the stop losses, because like any other indicator, it wont work to 100%. But this i will explain in the discord
3. On which timeframes does it work?
It works on any timeframe.
4. Who should use it?
People who are willing to learn, how to use the indicator.
People with some basic expirience (what is a divergence, what is a trendline)
5. Do i need more indicators?
In best case yes.
Im using 2 additional indicators, which you can use too.
6. Is there any backtest or are there any "proofs" of how good the indicators worked in the past?
Yes.
I will share some examples from the past in the comment section.

SSR - Stablecoin Supply Ratio - Bitcoin - CryptocurrencyThe Stablecoin Supply Ratio (SSR) is the ratio between Bitcoin supply and the supply of stablecoins, denominated in BTC.
When the SSR is low, the current stablecoin supply has more "buying power" to purchase BTC. It serves as a proxy for the supply/demand mechanics between BTC and USD.

BTC Dominance TrendThis simple script applies the DMI/ADX (trend) indicator to the Bitcoin Dominance Index (BTC.D) to check whether BTC is increasing its dominance or not on that day. It is meant to be applied to altcoins on medium intervals. I put it together to test the following hypothesis: On days when BTC dominance is on the rise, altcoins are harder to take off, because Bitcoin is draining the lifeblood out of them, so caution is needed when opening trades.
Olive background means BTC dominance is rising on that day, purple that it is decreasing. White background means it is not moving significantly in any direction.
You can change the resolution (i.e. apply the DMI/ADX to a different BTC.D interval), just make sure to lower the threshold as well. I hope you find a good use for it! Beware if you try to incorporate it in your strategy, it uses higher timeframe data and hence is prone to repainting.

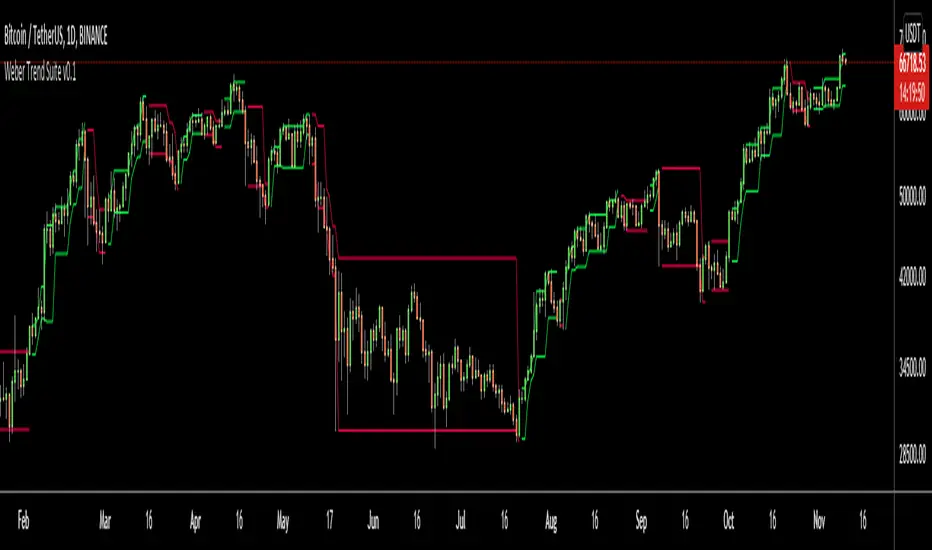
Weber Trend SuiteThe Weber Trend Suite (WTS) supports trend trading over longer timeframes.
Identification of the trend direction
Automatic identification of support and resistance level
Multi-Timeframe
Designed as a decision making framework for trading trending growth assets such as tech stocks and cryptocurrencies
The support and resistance lines are derived from the high, low and direction (bearish/bullish) from the latest outside bar at a time. The timeframe on which outside bars are detected can be chosen freely by the user. The importance of an outside bars tends to increase with the timeframe. Outside bars can play an important role in price action trading by providing support and resistance levels as well as the currently predominant trend direction. So this indicator enables a trader to automatically display the high, low and direction of the current outside bar from two different (usually higher) timeframes and therefore gives rationally and automatically derived support and resistance levels as well as the predominant trend direction from the chosen timeframes. The adjustable crossing EMA with its volatility noise filter gives further guidance on the current trend direction and strength.
The WTS can help traders and investors following a rule based system by providing a measure of trend strength and consistency as well as specific support and resistance levels.
WhaleCrew Long/Short Ratio (Bitfinex)Shows the long/short ratio (amount of longs per short) on ANY Bitfinex pair (BTCUSD, ETHUSD, ADAUSD, ...).

Rolling VWAP - Vhunt Scalper botBINANCE:ADAUSDTPERP
Modified VWAP to use scalping in lower timeframe.
Use 1minute TF for best results but can also use up to 30min.
This indicator is made for crypto but may also work for other assets.
The bands serve as support and resistance and used for opening quick profit position if conditions below are met:
Indicators:
Blue - modified rolling vwap
Orange - Band1
Green - Band2
Opening position Conditions:
Long:
Band2 < Band1
Price < Band2
Short:
Band2 > Band1
Price > Band2

AI Crypto Signals BTCUSD 15m Ultimate ScriptBYBIT:BTCUSD
Hello everyone! Sky First Capital in partnership with AI Crypto Signals is proud to introduce the AI Crypto Signals 15M BTCUSD Ultimate Script . This script works well on the 15M, 30M, 45M and 1HR chart using traditional candles. This means no false data or inaccurate entry/exit points such as with the ones using HA candles.
The script is based upon an initial strategy developed by user Bunghole here on TradingView, but we have optimized it, back-tested it with ideal settings, and added alerts that you can use to connect with your trading bot such as Alertatron, Cornix, etc. This script uses BB (Bollinger Bands) and RSI (Relative Strength Index) as indicators for signals.
Back-testing data for the 15M chart from 7/1/2021 to 10/15/2021 showed a 51.19% profit.
Back-testing data for the 1HR chart from 7/1/2021 to 10/15/2021 showed a 191% profit.
This script does not repaint.
Ideal use is to enter and exit at the close of the candle and take-profit/stop-loss once per candle.
This script has Entry/Exit/Take-Profit/Stop-Loss alerts.
We offer consulting and training services if you need help on using this script or getting it configured with an automated trading system.
We offer a 24 hour free trial of the script, send us a message to request access.

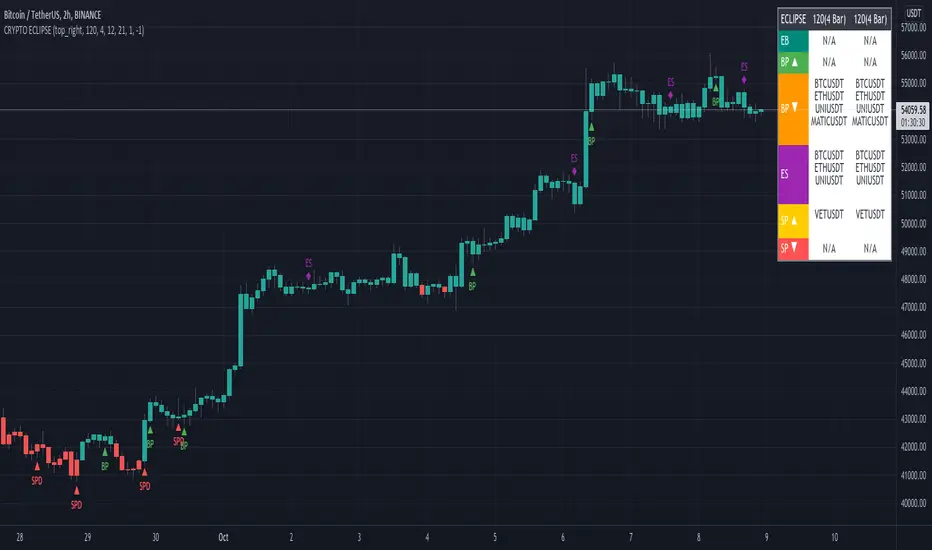
CRYPTO ECLIPSEWelcome to CRYPTO ECLIPSE!
If you see the market as a game between buyers and sellers, CRYPTO ECLIPSE is the EASY MODE.
Don't believe in any word I wrote, but please don't doubt about it until you TEST IT. Just go ahead and take your own conclusions, maybe this script changes your life, like it changed mine.
What would be like if you could see the markets through the eyes of a trader with many years of experience? (and If you are already this trader, you could add this as a live second opnion)
Imagine if you could consistently predcit buyers and sellers actions, attempts and rejections. That's what Price action technical analysis tries, but price action often feels like very subjective and to succeed and learn it, you will probably need at least 4 years of trading, winning and loosing to find consistancy, that's the process. CRYPTO ECLIPSE will show how you will see the market after this years spent, You''ll be skipping this years.
CRYPTO ECLIPSE is a setup that translates the market to you and give you the view of the market as it is, and not only how it was in the past. Differently from almost all other indicators i've seen in my life, CRYPTO ECLIPSE is a setup focused in PREDICT, not REACT. In my opnion that's why indicators not work well, they are too focused in the past, giving late decisions.
Truth be told, it's sounds good, but how do I use it?
I will explain you the main features, what you need to do is: Take some time to learn it, mess with the configs. Until you see the chart as you believe is the best predict scenario for the past, and then just sit and see how it will keep predicting the next moviments. Well, it works for me :)
Why am I renting this setup?
I am not. This is made for you to test for free, and for those who this setup makes all sense, we will build a small comunity around it. Just watch as we go, or Join us.
Before I forget, the setup is also a screener to track the 6 conditions above in the last 1-5 periods.
Main Features description:
BAR COLOR 2 = Strong Buyers domain(Candle's color)
BAR COLOR 3 = Strong Sellers domain(Candle's color)
BAR COLOR 0 e 1 = Fine Tuning(Advanced) There are 3 main ways to use it:
-Standard, following the same 2 and 3 bar colors.
-Changing both 0 and 1 bar colors. You can use Orange or pink or white colors for both 0 and 1, or other any color, try to use one that does not match with green or red for distinction. Consider the 0 and 1 bars as trend changing in course, or the breath of the market before a trend continuation (pullback).
Another option, that's indicated for Professionals only: change bar zero to dark green and 1 to a lighter red. This way you will see the gain and loose game in real time, take some time and you will see dark red going to lighter red will indicate a seller's weakness and the oposite for the buyers. If you are already a PRO, go ahead and play with these 2 options.
BP= STRONG BUYERS DOMAN
BPD= STRONG BUYERS DOMAN DECREASING
SP= STRONG SELLERS DOMAN
SPD= STRONG SELLERS DOMAN DECREASING
EB= POSSIBLE EARLY BUYERS DOMAIN SIGNAL
ES= POSSIBLE EARLY SELLERS DOMAIN SIGNAL
Note that BPD AND SPD are the same as EB and ES, I made this as a double entries so we can combine two different periods. If you look close you'll learn that the periods are related to the range of past periods you want to consider.
IF you pick a low period, it will show more signals, and it willl be more sensitive to the market changes. All the signals are real things that happened there, you will see that there was always a pullback or a consolidation, since this is very sensitive it's better to traders who want what's happening all the time
If you pick a high period, it will show less signals and with significant and strong movement, there are no guesses in this signals, if it did not proceed with a strong moviment, the opposite forces rejected their attempt.
Fit to your market point of view: Mess with the period numbers until you see the signals(arrows) where you understand is the best place to take a trade in the past, and watch it repeat the alert for you in the future, same as bar colors.
Note: If you want to enter only with big movements signals, use Stronger signals and high periods. if you want to try to get the movement begin, go with the early signals, using short periods.
Play with the configs until the chart give you the confidence you want to have to trade your money.
I don't recomend to use it with many indicators, if you add more than one indicator with this, you are probably insecure, and this will be useless to you.
But go ahead and add a trend indicator, if you are a trend trader or a oscillator, if you are a oscillator guy... Whatever you need until you feel confident.
Alway remember, this is only a tool. it's your decision, this is not a buy/sell indicator (maybe in the future), this is a tool to read the market. Always trade SPOT never FUTURES, always keep your stop loss as close as you can.
Enjoy the ECLIPSE
Crypto Scannner for Traffic Lights StrategyI allways try to make trading easier. Developing Scripts for a quick backtest and improvement of a strategy, getting alerts for entry and exit a position. Loading data to a spreadsheet is also important and takes time.
In this case finding good parameters in different markets or assets to enter in a position, is a bit exhausting. It is something you have to do everyday, and sometimes in different moments of the day.
So I manage to develop a Screener, to take a quick look at specific hours, and tell if I have a buy or sell condition in an specific asset. Obviously this is not an alert to make a trade instantaneusly, but this help you filter a lot of information in matters of seconds. Then open those specific charts and make a better analisys.
A few weeks ago, I published a scrpipt called "Traffic Lights Strategy", that uses 4 emas to get a buy or a sell condition.
It is easy to understand and use, but if you don´t want to missed some opportunities, and don't want to be look at the screen in all the time looking for them, I have here a simple solution.
This script works plotting 2 labels. The first one plots all the assets in which the condition is true (fastema > medema > slowema > filterema or fastema < medema < slowema < filterema)
The second one plots the assets were the condition is true only if happened up to 5 candles back, so you can be in time to enter a trade.
You can take the script and customize it for a different strategy or assets. I coded like this because I backtested this strategy in this specific assets, and statistics suggest that it might be profitable.
I hope this works for you. In other time I'll try to code a script for the others strategies I published.

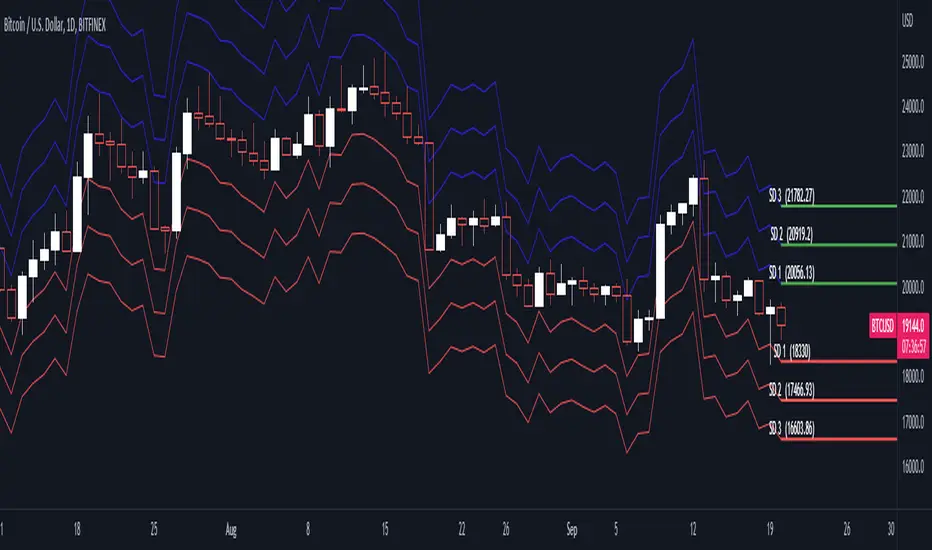
Standard Deviation ModelsBITFINEX:BTCUSD
The standard deviation model can be used for options traders that are selling options contracts to collect a premium to identify a specific range of strike prices which are optimal for selling based on the underlying asset’s historical price fluctuations. Traders will be able to identify the statistical likelihood that their options contract will be in the money (ITM) or out of the money (OTM).
Basic statistics of normal distributions (probability curve):
-1 SD to +1 SD = 68% likelihood
-2 SD to + 2 SD = 95% likelihood
-3 SD to +3 SD = 99% likelihood
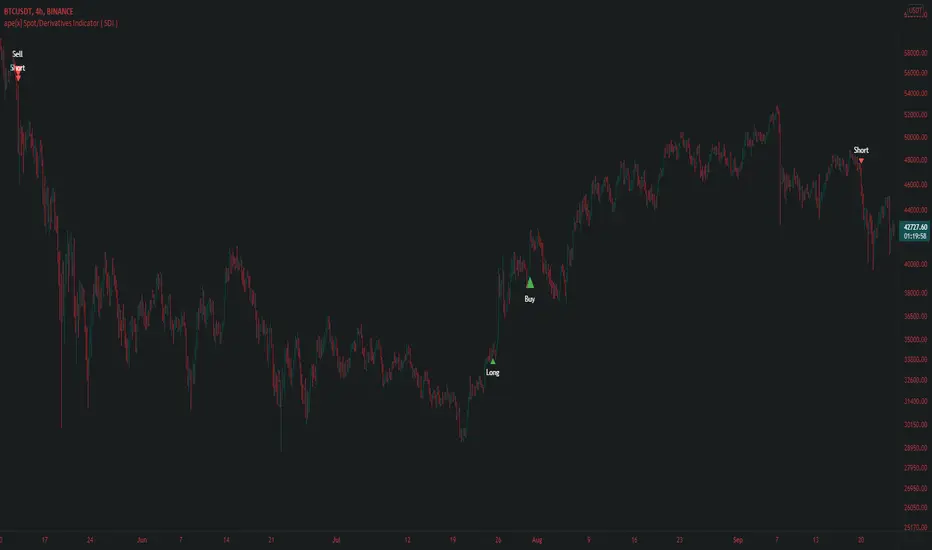
ape[x] Spot/Derivatives Indicator ( SDI )Apex spot and derivatives indicator is the latest generation of volume based algorithmic volatility trend Indicator developed by Quantdegen group.
It is a confluence of multiple modified legacy indicators to suit trader's ease to understand in which direction market is headed.
This generation of apex SDI is also developed with a vision to automate the trades with external third party bots/self scripted bots with the help of trading view alert system.
As we all know market usually outperforms legacy Indicators because they are evolved enough to attack liquidity and take stop loss of those who have poor risk management.
Apex SDI makes sure such attacks do not affect the signals by considering the most important factors like volume and expected volatility. It also confluences higher time frame arrays with lower time frame arrays to filter out the noise which might cause because of LFT volatility.
Quantdegen group is glad to announce this breakthrough in algorithmic trading indicators and make it available for public use.
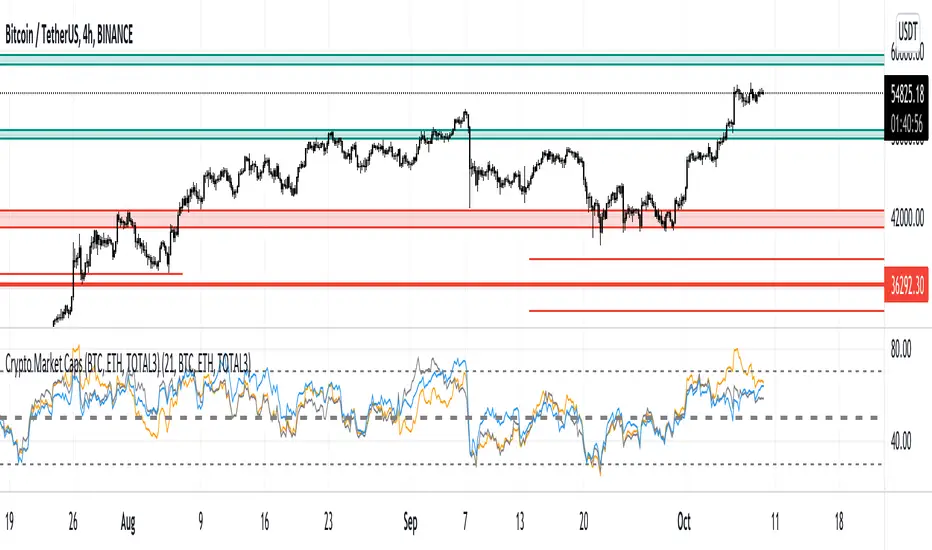
Crypto Market Caps (BTC, ETH, TOTAL3)RSI based Crypto Market Caps (BTC, ETH, TOTAL3) Oscillator
This oscillator displays market caps for:
BTC : CRYPTOCAP:BTC -> in orange
ETH : CRYPTOCAP:ETH -> in gray
ALT (Total crypto excl. BTC & ETH): CRYPTOCAP:TOTAL3 -> in blue
In the settings you can edit:
The 3 market cap symbols
RSI length
All colours ;-)
Hope you enjoy!
Ultimate ABC Indicator by @DaviddTechThis is the indicator version of my Ultimate ABC strategy we are looking for HH & LL to create an ABC pattern.
Shorts are defined by an ABC pattern.
Short:
* Starting with a low to a Higher High
* Breaking that trend to a new low
* Creating a new Higher High (FOMO HH)
* If the price breaks below the previous HH we have our entry.
Longs:
* Starting with a Hight to a Lower Low
* Breaking that trend to a new high
* Creating a new Lower Low (FOMO LL)
* If the price breaks above the previous LL we have our entry.
Stop loss just above or below the FOMO LL/HH.
Take Profit using a Fib or Risk to Reward.
Additional features :
* Add divergences for confluence MACD/RSI
* Auto Fib levels for taking profit.
WARNING:
- For purpose educate only - My mission is to debunk fake strategies with code to find THE ONE.
- Plots EMAs and other values on chart.
- This script to change bars colors.
If you have any questions or feedback, please let me know in the comments.

Trend Fusion By CryptoScriptsWelcome to Trend Fusion! This isn't your typical moving average indicator. It's a multi-timeframe indicator that consists of 3 different moving averages AND let's you choose between EMA, SMA, WMA, VWMA, HMA, and RMA. For example, you can have the 5min 200 EMA, 15min 200 EMA, and 1 hour 200 EMA all on the SAME chart without having to switch timeframes! This helps to create an edge over the competition so you don't have to have multiple charts open and you can see everything on one screen. You can also modify each moving average to the timeframe and value of your choice.
Signals
The Trend Fusion fires a buy signal (green triangle) whenever Moving Average 1 crosses above Moving Average 2 and 3. This is great for catching a bullish trend early, especially when combined with other indicators.
The Trend Fusion fires a sell signal (red triangle) whenever Moving Average 1 crosses below Moving Average 2 and 3. This is great for catching a bearish trend early, especially when combined with other indicators.
You can also make Moving Average 2 and 3 the same value if you just want to create an alert for one moving average crossing over another. (i.e MA 1 is the 50EMA and MA 2 and 3 both have a value of 200 so you're just looking for the 50EMA to cross over the 200EMA).
This indicator is great for catching big trends and catching them early (as seen by the picture), and fires multiple buy signals or sell signals in case you didn't catch the first one so you still have time to get in the trade.
Alerts
You can also set alerts for the buy and sell signals! Just click the clock icon in the top middle of the chart and click Trend Fusion in the drop-down menu. Make sure to select "Once per bar close" so you know the signal is confirmed.
Each timeframe acts differently so make sure you experiment/backtest with each one and tailor your moving average values accordingly.
Disclaimer: Past results are not indicative of future returns.
PM me to obtain access and please let me know if you have any questions! :)

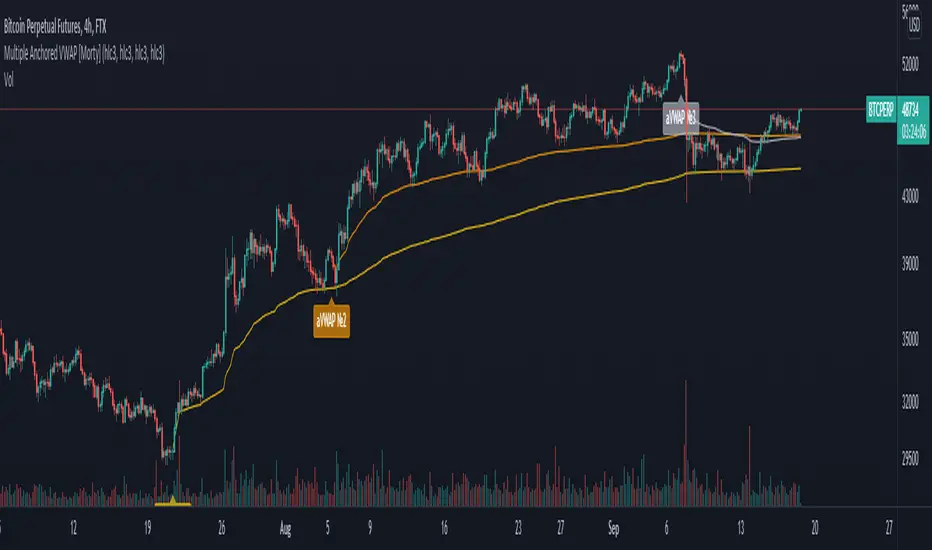
Multiple Anchored VWAP [Morty]The Anchored VWAP (aVWAP) indicator ties VWAP calculations to a specific price bar chosen by the trader. Anchored VWAP allows you to specify the price bar where calculations begin, making it easy to see whether the bulls or bears have been in charge since a very specific point in time. The starting price bar that is chosen generally marks a shift in market psychology, such as a significant high or low, earnings, news, or other announcements. The Anchored VWAP line is charted using price and volume data from that significant event onward.
This indicator plots up to 4 aVWAP lines in the chart.
Features:
- plot up to 4 aVWAP lines
- custom start date of aVWAP
- custom line color
- optional label of starting price bar
- optional custom resolution
----------------------------------------------------
锚定VWAP(aVWAP)指标将VWAP的计算与交易者选择的特定价格柱联系起来。锚定VWAP允许你指定计算开始的价格柱,使你很容易看到自一个非常具体的时间点以来,是牛市还是熊市在起作用。所选择的起始价格条通常标志着市场心理的转变,如一个重要的高点或低点、收益、新闻或其他公告。锚定VWAP线是使用从该重大事件开始的价格和成交量数据绘制的。
该指标在图表中最多绘制了4条aVWAP线。
特色:
- 绘制多达4条aVWAP线
- 自定义aVWAP的开始日期
- 自定义线的颜色
- 可选的起始价格条的标签
- 可选的自定义分辨率
Bitcoin Logarithmic Price BandsBitcoin has been trending up with time. Generally, Bitcoin has been following an increasing logarithmic path, as seen on the chart. This indicator tries to plot areas of buying or selling opportunity. The green area contains data from times when Bitcoin was extremely undervalued. The red area is calculated from times where Bitcoin was extremely overvalued. The logarithmic bands will increase with time, so the values are not static.
Generally speaking, buy when the price is in the green area and sell when the price is in the red area.
The model doesn’t contain ANY data from after November 2020. Nevertheless, it correctly predicted the area where Bitcoin topped in April 2021.
In addition, the yellow logarithmic band manages to indicate strong areas of support or resistance. So did it correctly indicate the top of the mid-cycle peak in 2013, the bottom after the first sell-off in Feb 2018, the 2019 top and at last the mid-cycle bear-market from May-June 2021.
This study will be updated once or twice per year to add new data to the calculation. This means that the logarithmic bands will look slightly different in the future compared to now. Nevertheless, the bands add valuable information on buying or selling opportunities in the market.
The indicator is only useable on the Bitcoin/Dollar index by Tradingview, weekly timeframe.
For access, please take a look at the "Author's Instructions" below.

Asset through the lens of BTCIntended for the cryptocurrency asset class, this indicator will show via background color whether or not Bitcoin is above the 20w SMA and 21w EMA. This allows for a user to easily distinguish how the behavior of a crypto asset acts when BTC is above the bull market support band and below the bull market support band.

Bitfinex Whale Indicator[Benson]This indicator monitors Bitfinex Whale's margin position.
When the indicator pillar turns green, it implies that whales are stacking long position, which would probably be a a good spot buying opportunity.
We can see green pillar before BTC's big pumps wave, such as:
1. 2020/3/14
2. 2020/7/22
3. 2020/9/30
4. 2021/7/25
PS:The green pillar tends to appear in the end of a long consolidation.
------
該指標用來監控 Bitfinex 巨鯨的動向
當指標柱變為綠色時,表示巨鯨正在累積多頭部位,可能會是現貨的絕佳買點。
過往出現綠色柱子時,都在比特幣主升段之前,例如:
1. 2020/3/14
2. 2020/7/22
3. 2020/9/30
4. 2021/7/25
PS:綠柱通常會出現在大型震盪區間的末端。

CryptoFall v1.0.0Category: Trend Analysis
Timeframe:
- Best on 4H, D
- Faster on 30M, 1H
Suggested Use: In uptrend.
Input option: Is possible to use "Alternative Time Frame" using other candles on different Time Frame charts.
Logic: The tradable market range is calculated, on which the Fibonacci levels are automatically calculated, at this point the entries could be defined entering on the important zone levels.
The calculation takes into account a combination of indicators such as:
- Fibonacci Retracement ( FibRetr )
- Theory of W. D. Gann .
Entry: The indicator uses Fibonacci levels to identify a good time to enter using the Buy the Dip approach (i.e. considering that a typical pullback is in the range between 0.382 and 0.618).
Tips: The best way to enter the market is always to split the positions so as not to enter entirely and expose yourself with all your capital, @TheSocialCryptoClub insists on a careful management of the orders so as to be able to mediate the price depending on the depth of the retracements.
Exit: Defined by the investor's long-term objective.
Thanks for attention.

Current to BTC [Morty]This indicator helps you find strong bull altcoin, it shows the ratio of the current symbol to BTC.
Donchian Channels help to identify trends.
Alts Bull coins:
When BTC goes sideway, they pump first.
Alts Bear coins:
When BTC goes sideway, they move sideway.
When BTC goes down, they go down harder.
