Trend & Strength Detector TSDTrend Strength Detector (TSD)
*Objective Trend Quality Measurement for Educational Market Analysis*
Note: This mathematical framework is a proprietary quantitative model developed by Ario Pinelab, inspired by classical EMA, ADX, RSI and MACD principles, yet not documented in any public technical or academic publication.
## 🎯 Purpose & Design Philosophy
The ** Trend Strength Detector- TSD ** is an educational research tool that provides **quantitative measurement of trend quality** through two independent scoring systems (0-100 scale). It answers the analytical question: *"How strong and aligned is the current market trend environment?"*
This indicator is designed with a **modular, complementary approach** to work alongside various analysis methodologies, particularly pattern-based recognition systems.
## 🔗 Complementary Research Framework
### Designed to Work With Pattern Detection Systems
This indicator provides **environmental context measurement** that complements qualitative pattern recognition tools. It works particularly well alongside systems like:
- **RMBS Smart Detector - Multi-Factor Momentum System**
- Traditional chart pattern analyzers
- Any momentum-based pattern identification tools
🔍 **To find RMBS Smart Detector:**
- Search in TradingView Indicators Library: `" RMBS Smart Detector - Multi-Factor Momentum System"`
- Look for: *Multi-Factor Momentum System*
- By author: ` `
### Why This Complementary Approach?
**Trend Quality Measurement** (TSD - this tool) provides:
- ✅ Structural trend alignment (0-100 score)
- ✅ Momentum intensity levels (0-100 score)
- ✅ Environment classification (Strong/Moderate/Weak)
- 📌 **Answers:** *"HOW STRONG is the underlying trend environment?"*
### Educational Research Value
When used together in a research context, these tools enable systematic study of questions like:
- How do reversal patterns behave when Strength Score is above 70 vs below 30?
- Do continuation patterns in weakening environments (declining scores) show different characteristics?
- What is the correlation between high Alignment Scores and pattern "success rates"?
- Can environment classification help identify genuine trend initiation vs false starts?
⚠️ **Important Note:** Both tools are **independent and work standalone**. TSD provides value whether used alone or with other analysis methods. The relationship with RMBS (or any pattern tool) is **complementary for research purposes**, not dependent.
---
###Mathematical Foundation
##TSA Formula: scoring method developed by Ario
-Trend Model (0 – 100)
TAS = EMA Alignment (0–40) + Price Position (0–30) + Trend Consistency (0–30)
EMA Alignment checks EMA_fast vs EMA_slow vs EMA_trend structure.
Price Position evaluates if Close is above/below all EMAs.
Consistency = 3 × max(bullish,bearish bars within 10 candles).
-Strength Model (0 – 100)
Strength = ADX (0–50) + EMA Slope (0–25) + RSI (0–15) + MACD (0–10)
ADX measures trend energy; Slope shows EMA momentum %;
RSI assesses zone positioning; MACD confirms directional agreement.
Note: This formula represents a proprietary quantitative model by Ario_Pinelab, inspired by classical technical concepts but not published in any external reference.________________________________________
📊 Environment Classification
Based on Total Strength Score:
🟢 Strong Environment: Score ≥ 60
→ Well-defined momentum, clear directional bias
🟡 Moderate Environment: 40 ≤ Score < 60
→ Mixed signals, transitional conditions
🔴 Weak Environment: Score < 40
→ Ranging, choppy, low conviction movement
Color Coding:
• Green background: Strong (≥60)
• Yellow background: Moderate (40-59)
• Red background: Weak (<40)
________________________________________
📈 Visual Components
Main Chart Display
Score Labels (Top-Right Corner):
┌─────────────────────────────────┐
│ 📊 Alignment: 75 | Strength: 82 │
│ Environment: Strong 🟢 │
└─────────────────────────────────┘
Color-Coded Background:
• Environment strength visually indicated via background color
• Helps quick identification of market regime
• Customizable transparency (default: 90%)
Reference Lines:
• Dotted line at 60: Strong/Moderate threshold
• Dotted line at 40: Moderate/Weak threshold
• Mid-line at 50: Neutral reference
________________________________________
🔧 Customization Settings
Input Parameters
The best setting is the default mode.
🚫 Important Disclaimers & Limitations
What This Indicator IS:
✅ Educational measurement tool for trend quality research
✅ Quantitative assessment of current market environment
✅ Complementary analysis tool for pattern-based systems
✅ Historical data analyzer for systematic study
✅ Multi-factor scoring system based on technical calculations
What This Indicator IS NOT:
❌ NOT a trading system or signal generator
❌ NOT financial advice or trade recommendations
❌ NOT predictive of future price movements
❌ NOT a guarantee of pattern success/failure
❌ NOT a substitute for comprehensive risk management
________________________________________
Known Limitations
1. Lagging Nature:
⚠️ All components (EMA, ADX, RSI, MACD) are calculated
from historical price data
→ Scores reflect CURRENT and RECENT conditions
→ Cannot predict sudden reversals or black swan events
→ Trend measurements lag actual price turning points
2. Whipsaw Risk:
⚠️ In choppy/ranging markets, scores may fluctuate rapidly
→ Moderate zone (40-60) can see frequent transitions
→ Low timeframes more susceptible to noise
→ Consider higher timeframes for stable measurements
3. Component Conflicts:
⚠️ Individual components may disagree
→ Example: Strong ADX but weak RSI alignment
→ Scores average these conflicts (may hide nuance)
→ Check individual components for deeper insight
4. Not Predictive:
⚠️ High scores do NOT guarantee continuation
⚠️ Low scores do NOT guarantee reversal
→ Measurement ≠ Prediction
→ Use for CONTEXT, not SIGNALS
→ Combine with comprehensive analysis
________________________________________
Risk Acknowledgments
Market Risk:
• All trading involves substantial risk of loss
• Past performance (even systematic studies) does not guarantee future results
• No indicator, system, or methodology can eliminate market risk
Measurement Limitations:
• Scores are mathematical calculations, not market predictions
• Environmental classification is descriptive, not prescriptive
• Strong measurements can deteriorate rapidly without warning
Educational Purpose:
• This tool is designed for LEARNING about market structure
• Not designed, tested, or validated as a standalone trading system
• Any trading decisions are user’s sole responsibility
No Warranty:
• Indicator provided “as-is” for educational purposes
• No guarantee of accuracy, reliability, or profitability
• Users must verify calculations and apply critical thinking
Open Source
Full Pine Script code available for educational study and modification. Feedback and improvement suggestions welcome.
“All logic is presented for research and educational visualization.”
---
Consolidation-breakout

Advanced Range Analyzer ProAdvanced Range Analyzer Pro – Adaptive Range Detection & Breakout Forecasting
Overview
Advanced Range Analyzer Pro is a comprehensive trading tool designed to help traders identify consolidations, evaluate their strength, and forecast potential breakout direction. By combining volatility-adjusted thresholds, volume distribution analysis, and historical breakout behavior, the indicator builds an adaptive framework for navigating sideways price action. Instead of treating ranges as noise, this system transforms them into opportunities for mean reversion or breakout trading.
How It Works
The indicator continuously scans price action to identify active range environments. Ranges are defined by volatility compression, repeated boundary interactions, and clustering of volume near equilibrium. Once detected, the indicator assigns a strength score (0–100), which quantifies how well-defined and compressed the consolidation is.
Breakout probabilities are then calculated by factoring in:
Relative time spent near the upper vs. lower range boundaries
Historical breakout tendencies for similar structures
Volume distribution inside the range
Momentum alignment using auxiliary filters (RSI/MACD)
This creates a live probability forecast that updates as price evolves. The tool also supports range memory, allowing traders to analyze the last completed range after a breakout has occurred. A dynamic strength meter is displayed directly above each consolidation range, providing real-time insight into range compression and breakout potential.
Signals and Breakouts
Advanced Range Analyzer Pro includes a structured set of visual tools to highlight actionable conditions:
Range Zones – Gradient-filled boxes highlight active consolidations.
Strength Meter – A live score displayed in the dashboard quantifies compression.
Breakout Labels – Probability percentages show bias toward bullish or bearish continuation.
Breakout Highlights – When a breakout occurs, the range is marked with directional confirmation.
Dashboard Table – Displays current status, strength, live/last range mode, and probabilities.
These elements update in real time, ensuring that traders always see the current state of consolidation and breakout risk.
Interpretation
Range Strength : High scores (70–100) indicate strong consolidations likely to resolve explosively, while low scores suggest weak or choppy ranges prone to false signals.
Breakout Probability : Directional bias greater than 60% suggests meaningful breakout pressure. Equal probabilities indicate balanced compression, favoring mean-reversion strategies.
Market Context : Ranges aligned with higher timeframe trends often resolve in the dominant direction, while counter-trend ranges may lead to reversals or liquidity sweeps.
Volatility Insight : Tight ranges with low ATR imply imminent expansion; wide ranges signal extended consolidation or distribution phases.
Strategy Integration
Advanced Range Analyzer Pro can be applied across multiple trading styles:
Breakout Trading : Enter on probability shifts above 60% with confirmation of volume or momentum.
Mean Reversion : Trade inside ranges with high strength scores by fading boundaries and targeting equilibrium.
Trend Continuation : Focus on ranges that form mid-trend, anticipating continuation after consolidation.
Liquidity Sweeps : Use failed breakouts at boundaries to capture reversals.
Multi-Timeframe : Apply on higher timeframes to frame market context, then execute on lower timeframes.
Advanced Techniques
Combine with volume profiles to identify areas of institutional positioning within ranges.
Track sequences of strong consolidations for trend development or exhaustion signals.
Use breakout probability shifts in conjunction with order flow or momentum indicators to refine entries.
Monitor expanding/contracting range widths to anticipate volatility cycles.
Custom parameters allow fine-tuning sensitivity for different assets (crypto, forex, equities) and trading styles (scalping, intraday, swing).
Inputs and Customization
Range Detection Sensitivity : Controls how strictly ranges are defined.
Strength Score Settings : Adjust weighting of compression, volume, and breakout memory.
Probability Forecasting : Enable/disable directional bias and thresholds.
Gradient & Fill Options : Customize range visualization colors and opacity.
Dashboard Display : Toggle live vs last range, info table size, and position.
Breakout Highlighting : Choose border/zone emphasis on breakout events.
Why Use Advanced Range Analyzer Pro
This indicator provides a data-driven approach to trading consolidation phases, one of the most common yet underutilized market states. By quantifying range strength, mapping probability forecasts, and visually presenting risk zones, it transforms uncertainty into clarity.
Whether you’re trading breakouts, fading ranges, or mapping higher timeframe context, Advanced Range Analyzer Pro delivers a structured, adaptive framework that integrates seamlessly into multiple strategies.

Trend Range Detector (Zeiierman)█ Overview
Trend Range Detector (Zeiierman) is a market structure tool that identifies and tracks periods of price compression by forming adaptive range boxes based on volatility and price movement. When prices remain stable within a defined band, the script dynamically draws a range box; when prices break out of that structure, the box highlights the breakout in real-time.
By combining a volatility-based envelope with a custom weighted centerline, this tool filters out noise and isolates truly stable zones — providing a clean framework for traders who focus on accumulation, distribution, breakout anticipation, and reversion opportunities.
Whether you're range trading, spotting trend consolidations, or looking for volatility contractions before major moves, the Trend Range Detector gives you a mathematically adaptive, visually intuitive structure that maps the heartbeat of the market.
█ How It Works
⚪ Range Formation Engine
The core of this indicator revolves around two conditions:
Distance Filter: The maximum distance between all recent closes and a dynamic centerline must remain within a volatility envelope.
Volatility Envelope: Based on an ATR(2000) multiplied by a user-defined factor to account for broader market volatility trends.
If both conditions are satisfied over the most recent length bars, a range box is drawn to visually anchor the zone.
⚪ Dynamic Breakout Coloring
When price breaks out of the top or bottom of the active range box, the box color shifts in real-time:
Blue Boxes represent areas where price has remained within a defined volatility envelope over a sustained number of bars. These zones reflect stable, low-volatility periods, often associated with consolidation, equilibrium, or market indecision.
Green Boxes for bullish breakouts.
Red Boxes for bearish breakdowns.
This allows traders to visually spot transitions from consolidation to expansion phases without relying on lagging signals.
█ Why Use a Weighted Close Instead of SMA?
A standard Simple Moving Average (SMA) treats all past closes equally, which works well in theory, but not in dynamic, fast-shifting markets. In this script, we replace the traditional SMA with a speed-weighted average that reflects how aggressively the market has moved bar-to-bar.
⚪ Here's why it matters:
Bars with higher momentum (larger price differences between closes) are given more weight.
Slow, sideways candles (typical in noise or low volume) contribute less to the calculated centerline.
This method creates a more accurate snapshot of market behavior, especially during volatile phases. As a result, the indicator adapts to market conditions more effectively, helping traders identify real consolidation zones, not just average lines distorted by flat bars or noise.
█ How to Use
⚪ Range Detection
Boxes form only when price remains consistently close to the speed-weighted mean.
Helps identify sideways zones, consolidations, and low-volatility structures where price is “charging up.”
⚪ Breakout Confirmation
Once price exits the top or bottom boundary, the box immediately highlights the direction of the break.
Use this signal in conjunction with your own momentum, volume, or trend filters for higher-confidence trades.
█ Settings
Minimum Range Length: Number of candles required for a valid range to form.
Range Width Multiplier: Adjusts the envelope around the weighted average using ATR(2000).
Highlight Box Breaks: Enables real-time coloring of breakouts and breakdowns for immediate visual feedback.
-----------------
Disclaimer
The content provided in my scripts, indicators, ideas, algorithms, and systems is for educational and informational purposes only. It does not constitute financial advice, investment recommendations, or a solicitation to buy or sell any financial instruments. I will not accept liability for any loss or damage, including without limitation any loss of profit, which may arise directly or indirectly from the use of or reliance on such information.
All investments involve risk, and the past performance of a security, industry, sector, market, financial product, trading strategy, backtest, or individual's trading does not guarantee future results or returns. Investors are fully responsible for any investment decisions they make. Such decisions should be based solely on an evaluation of their financial circumstances, investment objectives, risk tolerance, and liquidity needs.

Range Finder [UAlgo]🔶 Description:
The "Range Finder " indicator aims at identifying and visualizing price ranges within a specified number of candles. By utilizing the Average True Range (ATR) indicator and Simple Moving Average (SMA), it detects potential breakout conditions and tracks consecutive candles that remain within the breakout range. This indicator offers flexibility by allowing users to customize settings such as range length, method for determining range breaks (based on either candle close or wick), and visualization options for displaying range breaks on the chart.
🔶 Key Features
Identifying Ranges: The Range Finder automatically adapts to the market by continuously evaluating the Average True Range (ATR) and its Simple Moving Average (SMA). This helps in dynamically adjusting the range based on market volatility.
Range Length: Users can specify the number of candles to be used for constructing the range via the "Range Length" input setting. This allows for customization based on trading strategies and preferences.
Range Break Method: The indicator offers the flexibility to choose between two methods for identifying range breaks. Users can select between "Close" or "Wick" based on their preference for using the closing price or the highs and lows (including wicks) of candles for defining the breakout.
Show Range Breaks: This option enables visual representation of range breaks on the chart. When activated, labels with the letter "B" will appear at the breakout point, colored according to the breakout direction (upward breakouts in the chosen up range color and downward breakouts in the chosen down range color).
Range Color Customization: The indicator provides the ability to personalize the visual appearance of the range by selecting preferred colors for ranges indicating potential upward and downward breakouts.
🔶 Disclaimer
It's important to understand that the Range Finder indicator is intended for informational purposes only and should not be solely relied upon for making trading decisions. Trading financial instruments involves inherent risks, and past performance is not necessarily indicative of future results.

TrendCylinder (Expo)█ Overview
The TrendCylinder is a dynamic trading indicator designed to capture trends and volatility in an asset's price. It provides a visualization of the current trend direction and upper and lower bands that adapt to volatility changes. By using this indicator, traders can identify potential breakouts or support and resistance levels. While also gauging the volatility to generate trading ranges. The indicator is a comprehensive tool for traders navigating various market conditions by providing a sophisticated blend of trend-following and volatility-based metrics.
█ How It Works
Trend Line: The trend line is constructed using the closing prices with the influence of volatility metrics. The trend line reacts to sudden price changes based on the trend factor and step settings.
Upper & Lower Bands: These bands are not static; they are dynamically adjusted with the calculated standard deviation and Average True Range (ATR) metrics to offer a more flexible, real-world representation of potential price movements, offering an idea of the market's likely trading range.
█ How to Use
Identifying Trends
The trend line can be used to identify the current market trend. If the price is above the trend line, it indicates a bullish trend. Conversely, if the price is below the trend line, it indicates a bearish trend.
Dynamic Support and Resistance
The upper and lower bands (including the trend line) dynamically change with market volatility, acting as moving targets of support and resistance. This helps set up stop-loss or take-profit levels with a higher degree of accuracy.
Breakout vs. Reversion Strategies
Price movements beyond the bands could signify strong trends, making it ideal for breakout strategies.
Fakeouts
If the price touches one of the bands and reverses direction, it could be a fakeout. Traders may choose to trade against the breakout in such scenarios.
█ Settings
Volatility Period: Defines the look-back period for calculating volatility. Higher values adapt the bands more slowly, whereas lower values adapt them more quickly.
Trend Factor: Adjusts the sensitivity of the trend line. Higher values produce a smoother line, while lower values make it more reactive to price changes.
Trend Step: Controls the pace at which the trend line adjusts to sudden price movements. Higher values lead to a slower adjustment and a smoother line, while lower values result in quicker adjustments.
-----------------
Disclaimer
The information contained in my Scripts/Indicators/Ideas/Algos/Systems does not constitute financial advice or a solicitation to buy or sell any securities of any type. I will not accept liability for any loss or damage, including without limitation any loss of profit, which may arise directly or indirectly from the use of or reliance on such information.
All investments involve risk, and the past performance of a security, industry, sector, market, financial product, trading strategy, backtest, or individual's trading does not guarantee future results or returns. Investors are fully responsible for any investment decisions they make. Such decisions should be based solely on an evaluation of their financial circumstances, investment objectives, risk tolerance, and liquidity needs.
My Scripts/Indicators/Ideas/Algos/Systems are only for educational purposes!

Consolidation Spotter Multi Time FrameThis tool is designed for traders looking to spot areas of consolidation on their charts across various time frames. It highlights these consolidation areas using visually appealing boxes, making it easier to identify potential breakout or breakdown zones.
How To Use:
Spotting Consolidation: When you see a box form on your chart, this represents a consolidation zone. Within this zone, the price is moving sideways without a strong upward or downward trend.
Anticipating Breakouts & Breakdowns: Watch the price as it approaches the edges of the box. A movement outside the box can signal a potential breakout (if above the box) or a breakdown (if below the box). This is where momentum shifts can happen.
Momentum Confirmation: Once the price clearly moves out of the box, it indicates a momentum shift. If the price moves upwards out of the box, this can be seen as bullish momentum. Conversely, if the price moves downwards out of the box, this can be seen as bearish momentum.
To use the tool effectively, adjust the settings to suit your trading style, choose your preferred visual theme, and watch as the script highlights key consolidation areas on your chart.
Tip: To visualize fractals, consider using multiple instances of the "Consolidation Spotter" indicator, each set to a different timeframe. This approach allows you to observe consolidations nested within larger consolidations, offering deeper insights into market structures. 😉

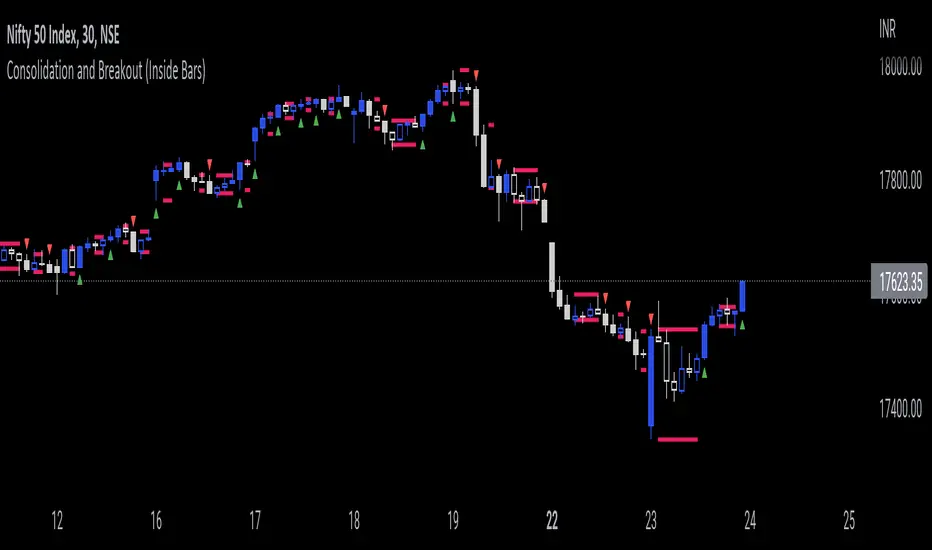
Consolidation and Breakout (Inside Bars)Consolidation indicates moments of market indecision when there is no shift in price. It is neither positive nor negative. Usually, after a price burst or strong trend movement that market falls back into a phase when traders are cautious about possible overbought or oversold positions. During this period, market reconciles before another breakout or trend emerges. Once you have identified consolidation, the next step is to keep an eye on a possible breakout.
This indicator would be useful for Breakout traders.
A candle's high and low is marked and if consequent candle fails to close above or below the marked candle, it's considered as an inside bar.
This can help breakout traders in tackling fakeouts since the wick above or below the initial candle are neglected and only the candle close above or below the range are considered as breakout.
MM Chop FilterBased On the "Chop and explode Indicator by fhenry0331
We Updated to Pine 5
- Added break out alerts and Signals
-Customize thresholds
How To use
when the line is blue confirmed Buy
Line is Red confirmed Sell
ALWAYS use in confirmation with your strategy and Trade with the trend.
Match with the on chart version for best results

Three Week Tight Pattern IndicatorThree Week Tight Pattern is a consolidation indicator which give extra buy point on strong fundamental stocks. You can read about it from IBD here: www.investors.com

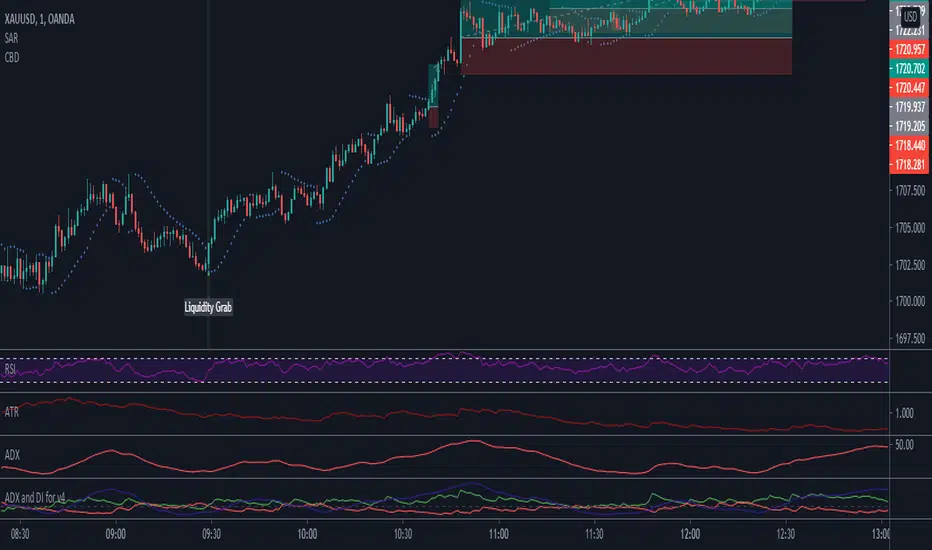
Combo Breaker DetectionA method I'm playing with to detect liquidity grabs and breaks from consolidation.
Consolidation Ranges [kingthies] Consolidation Range Analysis
Published by Eric Thies, January 2021
█ Indicator Summary
This tool calculates, analyzes and plots the visualization of a relative range over a given period of time
By adding to charts, users are enabled to see the impulsive nature of market cycles, along with their efforts to consolidate thereafter
The default period is 30, and should be adjusted to users preference
The default input is the current close price, on the chosen timeframe of the chart
█ Script Source
//
//@version=4
//© kingthies || This source code is subject to the terms of the Mozilla Public License 2.0 at mozilla.org
study("Consolidation Ranges ", shorttitle="CR ", overlay=true)
// !<------ User Inputs ----->
src = input(close, title='Range Input (Default set to Close'), lengthEMA=input(30,title='Length'),zoneToggle = input(true, title="Toggle Zone Highlights"), iCol = color.new(#FFFFFF, 100),
// !<---- Declarations & Calculations ---- >
trndUp = float(na),trndDwn = float(na), mid = float(na), e = ema(src, lengthEMA)
trndUp := src < nz(trndUp ) and src > trndDwn ? nz(trndUp ) : high, trndDwn := src < nz(trndUp ) and src > trndDwn ? nz(trndDwn ) : low, mid := avg(trndUp, trndDwn)
// !< ---- Plotting ----->
highRange = plot(trndUp == nz(trndUp ) ? trndUp : na, color=color.white, linewidth=2, style=plot.style_linebr, title="Top of Period Range")
lowRange = plot(trndDwn == nz(trndDwn ) ? trndDwn : na, color=color.white, linewidth=2, style=plot.style_linebr, title="Bottom of Period Range")
xzone = plot(zoneToggle ? src > e ? trndDwn : trndUp : na, color=iCol, style=plot.style_circles, linewidth=0, editable=false)
fill(highRange, xzone, color=color.lime,transp=70), fill(xzone, lowRange, color=color.red,transp=70)
//

Consolidation Zones - LiveHello Traders!
This is the script that finds Consolidation Zones in Realtime.
How it works?
- The script finds highest/lowest bars by using "Loopback Period"
- Then it calculates direction
- By using the direction and highest/lowest bar info it calculates consolidation zones in realtime
- If the length of consolidation area is equal/greater than user-defined min length then this area is shown as consolidation zone
- Then Consolidation Zone extends automatically if there is no breakout
if you increase the Loopback Length then you get bigger consolidation zones:
You have option to "Paint Consolidation Area" or not:
Enjoy!

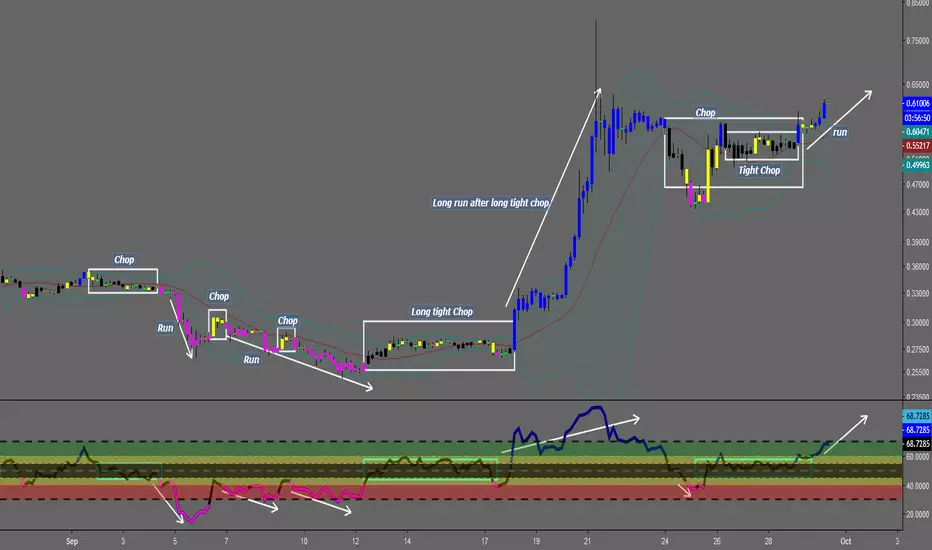
Chop and explodeThe purpose of this script is to decipher chop zones from runs/movement/explosion
The chop is RSI movement between 40 and 60
tight chop is RSI movement between 45 and 55. There should be an explosion after RSI breaks through 60 (long) or 40 (short). Tight chop bars are colored black, a series of black bars is tight consolidation and should explode imminently. The longer the chop the longer the explosion will go for. tighter the better.
Loose chop (whip saw/yellow bars) will range between 40 and 60.
the move begins with blue bars for long and purple bars for short.
Couple it with your trading system to help stay out of chop and enter when there is movement. Use with "Simple Trender."
Best of luck in all you do. Get money.