Cycles: 4x dual inputs: Swing / Time Cycles projected forward//Purpose/Premise:
To project forward vertical 'cycle' lines based on user-input anchor points, and to search for confluence.
The idea being that if several well-anchored cycles agree (i.e. we see multiple bunched vertical line confluence in the future), then this may add support to an already existing trade idea, or may indicate an increased likelihood of a shift in direction.
//Usage & notes:
~In the above chart I've anchored to obvious swing lows and swing highs in Btc/Usd from 2020-2022. You could also use fixed time-based cycles from a favored start anchor point. Bars per cycle are printed at the top of each cycle box if your're interested in time cycles. I.e. for 1, 2, 3 month cycles: for BTC you could use 30, 60, 90 bars on daily; for S&P you could use 20, 40, 60 bars on daily.
~On first loading the indicator you will be asked select 'start date', and 'end date' for each of 4 sessions (8x clicks on chart). After this you can easily reset points by clicking the indicator display line three dots>> reset points. Or you can simply drag the vertical box edges (purple lines) to change your cycle anchor points.
~Be sure the start anchor point is before the end anchor point or box/lines won't appear.
~When you drop down to low timeframes you might get bar_index error due to history available: you need then to click the three dots on indicator display line >> reset points >> 8x clicks on the chart.
~Vertical projected lines will match the color of the cycle box they origninate from.
~Lines will project into the future as far as is allowed by tradingview (500 bars max)
//Inputs:
~Time start and end dates for each cycle (change these as described above, or input manually)
~Show/hide each cycle (default is show all 4)
~Formatting options: color of forward projected lines, line width, line style, line / box / text color.
~Box transparancy: Set to 100 to make boxes invisible & declutter the chart. Set to 0 for maximum opacity. Default is 80.
thanks to @Sathyamurthie for his ideas on cycle confluence which caused me to write this.
Confluence

Volatility-Based Mean Reversion BandsThe Volatility-Based Mean Reversion Bands indicator is a powerful tool designed to identify potential mean reversion trading opportunities based on market volatility. The indicator consists of three lines: the mean line, upper band, and lower band. These bands dynamically adjust based on the average true range (ATR) and act as reference levels for identifying overbought and oversold conditions.
The calculation of the indicator involves several steps. The average true range (ATR) is calculated using a specified lookback period. The ATR measures the market's volatility by considering the range between high and low prices over a given period. The mean line is calculated as a simple moving average (SMA) of the closing prices over the same lookback period. The upper band is derived by adding the product of the ATR and a multiplier to the mean line, while the lower band is derived by subtracting the product of the ATR and the same multiplier from the mean line.
Interpreting the indicator is relatively straightforward. When the price approaches or exceeds the upper band, it suggests that the market is overbought and may be due for a potential reversal to the downside. On the other hand, when the price approaches or falls below the lower band, it indicates that the market is oversold and may be poised for a potential reversal to the upside. Traders can look for opportunities to enter short positions near the upper band and long positions near the lower band, anticipating the price to revert back towards the mean line.
The bar color and background color play a crucial role in visualizing the indicator's signals and market conditions. Lime-colored bars are used when the price is above the upper band, indicating a potential bearish mean reversion signal. Conversely, fuchsia-colored bars are employed when the price is below the lower band, suggesting a potential bullish mean reversion signal. This color scheme helps traders quickly identify the prevailing market condition and potential reversal zones. The background color complements the bar color by providing further context. Lime-colored background indicates a potential bearish condition, while fuchsia-colored background suggests a potential bullish condition. The transparency level of the background color is set to 80% to avoid obscuring the price chart while still providing a visual reference.
To provide additional confirmation for mean reversion setups, the indicator incorporates the option to use the Relative Strength Index (RSI) as a confluence factor. The RSI is a popular momentum oscillator that measures the speed and change of price movements. When enabled, the indicator checks if the RSI is in overbought territory (above 70) or oversold territory (below 30), providing additional confirmation for potential mean reversion setups.
In addition to visual signals, the indicator includes entry arrows above or below the bars to highlight the occurrence of short or long entries. When the price is above the upper band and the confluence condition is met, a fuchsia-colored triangle-up arrow is displayed above the bar, indicating a potential short entry signal. Similarly, when the price is below the lower band and the confluence condition is met, a lime-colored triangle-down arrow is displayed below the bar, indicating a potential long entry signal.
Traders can customize the indicator's parameters according to their trading preferences. The "Lookback Period" determines the number of periods used in calculating the mean line and the average true range (ATR). Adjusting this parameter can affect the sensitivity and responsiveness of the indicator. Smaller values make the indicator more reactive to short-term price movements, while larger values smooth out the indicator and make it less responsive to short-term fluctuations. The "Multiplier" parameter determines the distance between the mean line and the upper/lower bands. Increasing the multiplier widens the bands, indicating a broader range for potential mean reversion opportunities, while decreasing the multiplier narrows the bands, indicating a tighter range for potential mean reversion opportunities.
It's important to note that the Volatility-Based Mean Reversion Bands indicator is not a standalone trading strategy but rather a tool to assist traders in identifying potential mean reversion setups. Traders should consider using additional analysis techniques and risk management strategies to make informed trading decisions. Additionally, the indicator's performance may vary across different market conditions and instruments, so it's advisable to conduct thorough testing and analysis before integrating it into a trading strategy.

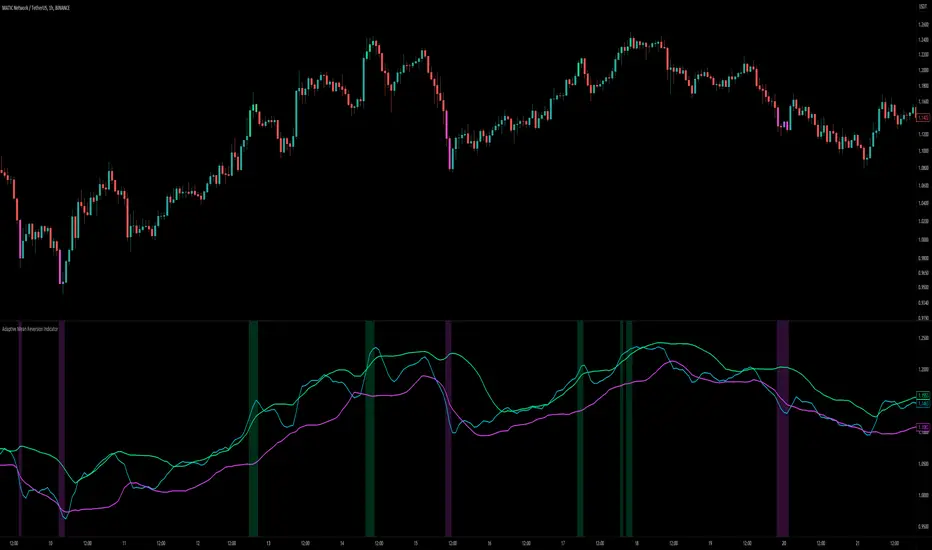
Adaptive Mean Reversion IndicatorThe Adaptive Mean Reversion Indicator is a tool for identifying mean reversion trading opportunities in the market. The indicator employs a dynamic approach by adapting its parameters based on the detected market regime, ensuring optimal performance in different market conditions.
To determine the market regime, the indicator utilizes a volatility threshold. By comparing the average true range (ATR) over a 14-period to the specified threshold, it determines whether the market is trending or ranging. This information is crucial as it sets the foundation for parameter optimization.
The parameter optimization process is an essential step in the indicator's calculation. It dynamically adjusts the lookback period and threshold level based on the identified market regime. In trending markets, a longer lookback period and higher threshold level are chosen to capture extended trends. In ranging markets, a shorter lookback period and lower threshold level are used to identify mean reversion opportunities within a narrower price range.
The mean reversion calculation lies at the core of this indicator. It starts with computing the mean value using the simple moving average (SMA) over the selected lookback period. This represents the average price level. The deviation is then determined by calculating the standard deviation of the closing prices over the same lookback period. The upper and lower bands are derived by adding and subtracting the threshold level multiplied by the deviation from the mean, respectively. These bands serve as dynamic levels that define potential overbought and oversold areas.
In real-time, the indicator's adaptability shines through. If the market is trending, the adaptive mean is set to the calculated mean value. The adaptive upper and lower bands are adjusted by scaling the threshold level with a factor of 0.75. This adjustment allows the indicator to be less sensitive to minor price fluctuations during trending periods, providing more robust mean reversion signals. In ranging market conditions, the regular mean, upper band, and lower band are used as they are more suited to capture mean reversion within a confined price range.
The signal generation component of the indicator identifies potential trading opportunities based on the relationship between the current close price and the adaptive upper and lower bands. If the close price is above the adaptive upper band, it suggests a potential short entry opportunity (-1). Conversely, if the close price is below the adaptive lower band, it indicates a potential long entry opportunity (1). When the close price is within the range defined by the adaptive upper and lower bands, no clear trading signal is generated (0).
To further strengthen the quality of signals, the indicator introduces a confluence condition based on the RSI. When the RSI exceeds the threshold levels of 70 or falls below the threshold level of 30, it indicates a strong momentum condition. By incorporating this confluence condition, the indicator ensures that mean reversion signals align with the prevailing market momentum. It reduces the likelihood of false signals and provides traders with added confidence when entering trades.
The indicator offers alert conditions to notify traders of potential trading opportunities. Alert conditions are set to trigger when a potential long entry signal (1) or a potential short entry signal (-1) aligns with the confluence condition. These alerts allow traders to stay informed about favorable mean reversion setups, even when they are not actively monitoring the charts. By leveraging alerts, traders can efficiently manage their time and take advantage of market opportunities.
To enhance visual interpretation, the indicator incorporates background coloration that provides valuable insights into the prevailing market conditions. When the indicator generates a potential short entry signal (-1) that aligns with the confluence condition, the background color is set to lime. This color suggests a bullish trend that is potentially reaching an exhaustion point and about to revert downwards. Similarly, when the indicator generates a potential long entry signal (1) that aligns with the confluence condition, the background color is set to fuchsia. This color represents a bearish trend that is potentially reaching an exhaustion point and about to revert upwards. By employing background coloration, the indicator enables traders to quickly identify market conditions that may offer mean reversion opportunities with a directional bias.
The indicator further enhances visual clarity by incorporating bar coloring that aligns with the prevailing market conditions and signals. When the indicator generates a potential short entry signal (-1) that aligns with the confluence condition, the bar color is set to lime. This color signifies a bullish trend that is potentially reaching an exhaustion point, indicating a high probability of a downward reversion. Conversely, when the indicator generates a potential long entry signal (1) that aligns with the confluence condition, the bar color is set to fuchsia. This color represents a bearish trend that is potentially reaching an exhaustion point, indicating a high probability of an upward reversion. By using distinct bar colors, the indicator provides traders with a clear visual distinction between bullish and bearish trends, facilitating easier identification of mean reversion opportunities within the context of the broader trend.
While the "Adaptive Mean Reversion Indicator" offers a robust framework for identifying mean reversion opportunities, it's important to remember that no indicator is foolproof. Traders should exercise caution and employ risk management strategies. Additionally, it is recommended to use this indicator in conjunction with other technical analysis tools and fundamental factors to make well-informed trading decisions. Regular backtesting and refinement of the indicator's parameters are crucial to ensure its effectiveness in different market conditions.
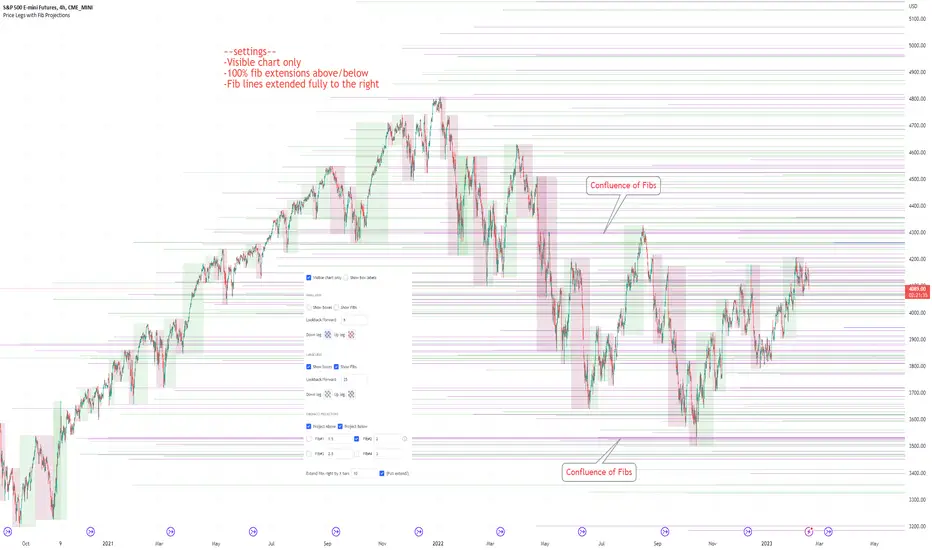
Price Legs & Fib Projections: Fibonacci Confluence-Plots price legs based on two user input lookback numbers. Smaller number for small legs, larger number for large legs.
-Plots Fib projections of these price legs, above and below; User can input four independent fib levels or standard deviation levels
## User Inputs ##
~Show visible chart only; Show price leg labels (time and price); show small legs (fibs and/or boxes); show large legs (fibs and/or boxes)
~Input 4 Fibonacci levels or measured move levels. Toggle each level on/off
~toggle on/off Fib levels ABOVE or fib levels BELOW
~extend Fib levels 'X' bars to the right, or toggle on/off 'Full Extend' to the right
## Tips & Notes ##
-use 'Full Extend' together with 'visible chart only' if searching for multiple confluence of Fib levels.
-can quickly get very cluttered, but the aim in writing this was to try to find area of confluence at a glance amongst a mess of levels, then hide the indicator and study/note that area.
-if lines don't print toward the left hand side of the chart you've likely reached the max line limit set by Tradingview.
-Fib level input of 1.0 represents zero % extension above the high or below the low of the leg; 2.0 represents 100% extension.
1hr S&P: Visible chart only; large legs only; 50%, 100%, 150%, 200% Fib extensions; Above only; lines extended fully to the right:
Usage notes; 15m S&P: Small & Large price legs; partial extend; all fib levels above/below:
Dynamic ADX - [The Pine Guru]Dynamic ADX by The Pine Guru
What is the Dynamic ADX?
The Dynamic ADX is an indicator created using the regular ADX, Line, and additional ADX Moving Average. This MA allows the script to calculate the ADX differently to the original ADX, providing greater input and accessibility to the user. As the ADX is a volatility indicator, it is communicates to trend strength in the markets. The Dynamic ADX displays these trending Periods through user controlled visualizers like Fills, Background Color, and Bar Color.
How do I use the Dynamic ADX?
This indicator has 4 different "versions" or "conditions" in which it displays trend strength. These are achieved by checking and unchecking ADX, ADX MA and Line. Different combinations of these 3 inputs will result in a change of true condition that the script outputs.
Dynamic ADX Achieved by checking the ADX and ADX MA, results in an ADX similar to an MA Crossover, with the ADX being over the MA indicating a true or strong trend condition.
Regular ADX Achieved by Checking the ADX and Line. Results in the regular calculation of the ADX.
Mixture Achieved by Checking all three sections, which results in the calculation a normal ADX as well as the MA. Provides and extra condition or confluence into the ADX.
MA and Line Achieved by checking the ADX MA and Line. Results in a similar calculation to an original ADX but with a smoother MA.
Recommendations
This indicator will work typically in all markets with high volume and volatility. It is recommended that it is used as a confluence in a trading system, and not as an outright indicator. As always do your own testing before live use with this indicator. Do your own Research and refinements.
Please Leave a like if you enjoy this Indicator

Triple ThreatThis indicator provides buy and sell signals for Bitcoin based on confluence from well-known momentum, volatility, and trend indicators. It has successfully captured the major directional trends on Bitcoin's daily chart since 2018, and the settings are currently optimized for this chart in particular. This indicator implements RSI to gauge momentum, BBWP to gauge volatility, and an EMA to gauge trend. Maximum confluence signals are represented by horizontal bars in the indicator's pane, where the tallest green bar is a confirmed buy signal, and the tallest red bar is a confirmed sell signal. The shortest bar represents a momentum-only signal, and the second-shortest bar represents a volatility signal in confluence with the previously given momentum signal.
To track momentum, the RSI is plotted to the indicator plane against a moving average of the RSI. A momentum signal is generated when the RSI crosses over its moving average, retests/approaches the moving average, and then continues in the crossover direction (i.e., it fails to cross the moving average to the opposite side, creating a successful retest). The settings that affect this trigger are the "Crossover Threshold," which specifies how much the RSI should exceed the moving average to be considered a crossover, and the "Retest threshold," which specifies how closely the RSI should approach the moving average to be considered a retest. A momentum signal is ALSO generated if the RSI or its moving average exceed their counterpart by a certain threshold. For example, if the threshold was set at 10, a BUY signal would be generated when the RSI exceeds the moving average by 10, or a SELL signal would be generated when the moving average exceeds the RSI by 10. This threshold can be set using the "Instant Signal Threshold" setting. Either type of momentum signal will be plotted on the pane as the shortest horizontal bar, with its color indicating the signal's direction.
Volatility is primarily measured using the Bollinger Band Width Percentile (BBWP) indicator, which was created by The_Caretaker. BBWP plots the volatility of the asset's price, given by Bollinger Band width, relative to past volatility by assigning the volatility readings into percentiles. The indicator also includes a moving average of the BBWP itself, where a crossover to the upside represents expanding volatility and a crossover to the downside represents contracting volatility. This indicator is used to confirm a signal given by the momentum indicators - a momentum signal that is given during a period of expanding volatility has a greater likelihood of success. Therefore, when the BBWP crosses above its moving average by a given threshold, a previously triggered momentum signal is considered to be "confirmed." The threshold for this crossover can be set using the "BBWP Confirmation Threshold" setting. However, it is also relevant that periods of extreme volatility often accompany an extremity in price action (a "top" or "bottom"), in which case the BBWP is likely to contract after price reaches such an extremity. This phenomenon is captured by also using "extreme reads" on the momentum indicator to signal that there has already been enough volatility to confirm a momentum signal. If the RSI gives an "extreme read" before triggering a signal, the momentum signal is also considered to be confirmed. For example, if the RSI is above 80, breaks below 80, and then gives a SELL signal, this sell signal is considered to be confirmed without requiring the BBWP to crossover its moving average to the upside. The threshold that would confirm a SELL signal can be set with the "Overbought" setting, and the threshold that would confirm a BUY signal can be set with the "Oversold" setting. Whenever a volatility signal confirms a momentum signal, a medium-sized horizontal bar will be plotted on the pane in the same directional color as the momentum signal. Note that a momentum signal may trigger at the exact same time as the volatility signal which confirms it; in this case, only the medium-sized bar will be visible on the pane, but its direction can still be identified by its color.
Lastly, to reduce the likelihood of "false signals," a trend indicator is used to confirm the direction of the signal. This is typically an exponential moving average. If a confirmed volatility SELL signal is given, and the closing price is below the moving average, then the SELL signal is also confirmed by the trend. Likewise, if a confirmed volatility BUY signal is given, and the closing price is above the moving average, then the BUY signal is confirmed by the trend. The type and length of the moving average used to verify the trend can be set using the "Moving Average Type" and "Moving Average Length" settings found below the momentum/volatility settings. A trend signal is plotted on the pane as a tall horizontal bar, and is more deeply colored than the momentum and volatility signals.
For maximum confluence, it is recommended that the trend signal, given by the tallest bar, is the one that forms the basis of trades executed while using the Triple Threat indicator. It is possible to enter more aggressive trades with better entries by using only the volatility signal, given by the medium-sized bar, however this entails greater risk and should only be done in confluence with an additional trading strategy of your own discretion. Backtesting has shown that using the volatility signal alone underperforms using the volatility signal in confluence with the trend signal.
Please also be advised that the default setting are optimized for Bitcoin's daily chart only. The indicator is still applicable to other timeframes and asset classes, but the settings may need to be modified. I have a list of settings for other Bitcoin timeframes, and I would be happy to share them upon request.
I hope you can find this indicator to be of some use to your trading strategies. I'd be happy to hear any feedback from the community, so please don't hesitate to reach out. Stay safe, and happy trading.

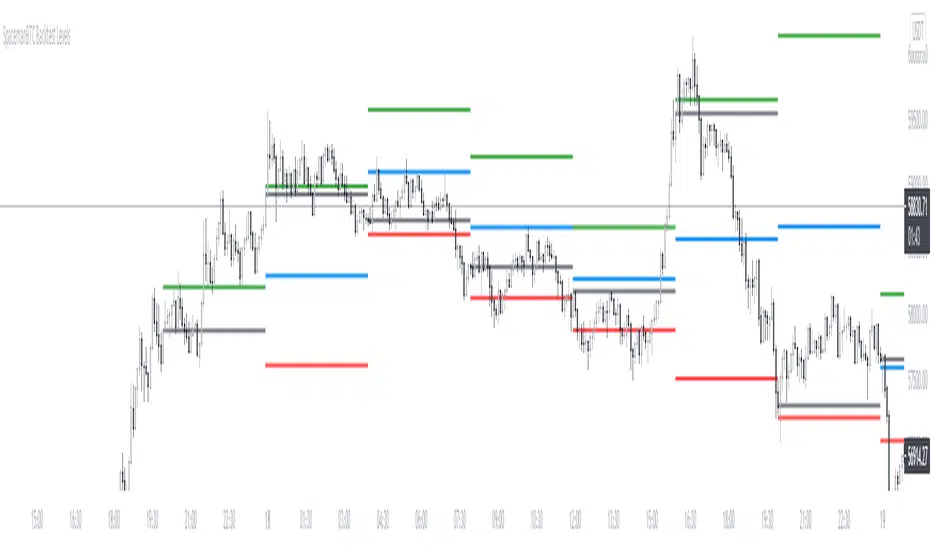
Key Levels CustomTF + Backtest: SpacemanBTCKey Levels Backtest, same logic as the key levels script, provide levels based:
High, Low, Mid and Close.
This was requested, took a long time to post as I fell sick and was given a lot of Dev Work.
Hope this helps those who use it, very useful to see liquidity grabs in my opinion.
Input time in minutes!
Result of a user request.
All LinesThe objective of this script is to try to display as many overlay indicators as possible simultaneously while keeping the clutter to a minimum.
--Included are Indicators are--
sma 20 50 100 200
ema 20 50 100 200
High/Low
Bollinger bands upper/lower
Pivot points PP R1 R2 R3 S1 S2 S3
-- For Time periods --
Hour,Day,Week
--- How To Use --
Switch it on when looking for likely support or resistance areas to plot your trade.
The more lines that overlay each other indicate even greater support/resistance at that point
meaning if the price is going down it may bounce up at this area or if the price is going up it may bounce down.
Also the more visible the line the more strength it has to effect the price. This value can be edited in settings by adjusting the power value for each indicator as it can often depend on what you are trading.
--Tips--
If you want to know what the line represents hover your cursor over the dot at the end of the line and a tool tip will appear.
If there are to many circles zoom in the price more to separate them and try to hover again.

Ichimoku ++ public v0.9Description:
The intention of this script is to build/provide a kind of work station / work bench for analysing markets and especially Bitcoin . Another goal is to get maximum market information while maintaining a good chart overview. A chart overloaded with indicators is useless because it obscures the view of the chart as the most important indicator. The chart should be clear and market structure should be easy to see. In addition, some indicator signals can be activated to better assess the quality of signals from the past. The chart environment or the chart context is important for the quality of a signal.
The intention of this script is not to teach someone how to trade or how to use these Indicators but to provide a tool to analyse markets better and to help to draw conclusions of market behaviour in a higher quality.
A general advise:
Use the included indicators and signals in a confluent way to get stoploss, buy and sell entry points. SR clusters can be identified for use in conjunction with fractals as entry and exit pints. My other scripts can also help. Prefer 4 hours, daily and a longer time frame. There is no "Holy Grail" :).
If someone is new to trading you should learn about the indicators first. Definitely learn about Ichimoku Cloud Indicator.
Integrated indicators are:
Ichimoku Cloud and signals
Parabolic SAR and signal
ATR stop
Bollinger Bands
EMA / SMA and background color as signal
Williams Fractals and signal
Puell Multiple signal

Automatic Fibonacci Pivot Point S/R LevelsThis is a great tool to find confluences between Fibonacci Pivot point on various time frames.
Fib Pivots used
23.6%
38.2%
50%
61.8%
76.4%
100%
127.2%
141.4%
161.8%
200%
If price is between two levels on the update the lines shift
Yearly Pivots shown on 1m - Daily timeframes
PIvots recalculate on every day
Monthly pivots show on 1m - 60m timeframes
Pivots recalculate every hour
Weekly pivots show on 1m - 15m timeframes
Pivots recalculate every 30m
There is a lot of code but it got the job done.
It would easy to interchange if you prefer different types of pivots
It would be easy to add an on/off if you dont want so many levels on your smaller time frames
If anyone can streamline it please do

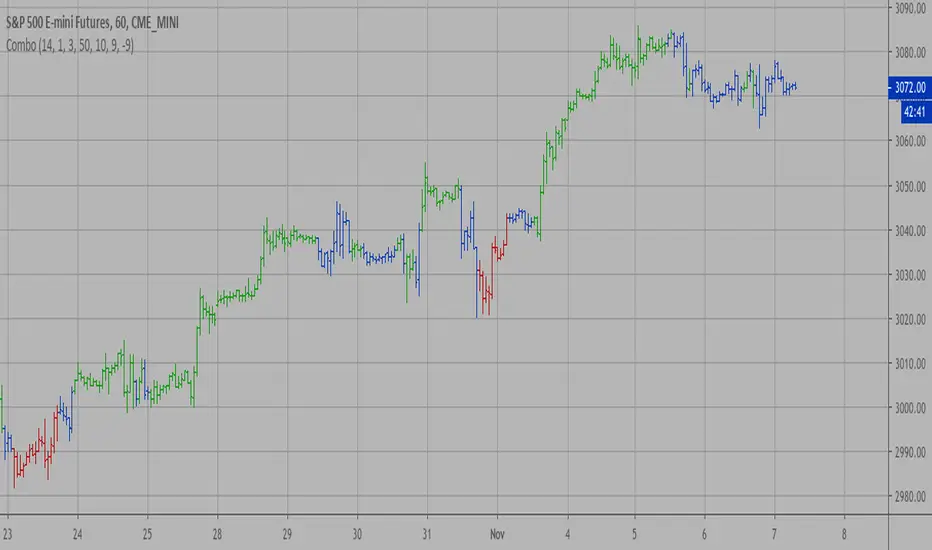
Combo Backtest 123 Reversal & Confluence This is combo strategies for get a cumulative signal.
First strategy
This System was created from the Book "How I Tripled My Money In The
Futures Market" by Ulf Jensen, Page 183. This is reverse type of strategies.
The strategy buys at market, if close price is higher than the previous close
during 2 days and the meaning of 9-days Stochastic Slow Oscillator is lower than 50.
The strategy sells at market, if close price is lower than the previous close price
during 2 days and the meaning of 9-days Stochastic Fast Oscillator is higher than 50.
Second strategy
This is modified version of Dale Legan's "Confluence" indicator written by Gary Fritz.
================================================================
Here is Gary`s commentary:
Since the Confluence indicator returned several "states" (bull, bear, grey, and zero),
he modified the return value a bit:
-9 to -1 = Bearish
-0.9 to 0.9 = "grey" (and zero)
1 to 9 = Bullish
The "grey" range corresponds to the "grey" values plotted by Dale's indicator, but
they're divided by 10.
WARNING:
- For purpose educate only
- This script to change bars colors.

Combo Strategy 123 Reversal & Confluence This is combo strategies for get a cumulative signal.
First strategy
This System was created from the Book "How I Tripled My Money In The
Futures Market" by Ulf Jensen, Page 183. This is reverse type of strategies.
The strategy buys at market, if close price is higher than the previous close
during 2 days and the meaning of 9-days Stochastic Slow Oscillator is lower than 50.
The strategy sells at market, if close price is lower than the previous close price
during 2 days and the meaning of 9-days Stochastic Fast Oscillator is higher than 50.
Second strategy
This is modified version of Dale Legan's "Confluence" indicator written by Gary Fritz.
================================================================
Here is Gary`s commentary:
Since the Confluence indicator returned several "states" (bull, bear, grey, and zero),
he modified the return value a bit:
-9 to -1 = Bearish
-0.9 to 0.9 = "grey" (and zero)
1 to 9 = Bullish
The "grey" range corresponds to the "grey" values plotted by Dale's indicator, but
they're divided by 10.
WARNING:
- For purpose educate only
- This script to change bars colors.
Multicolor Bollinger Bands - Market PhasesHi everyone
Hope you're all doing well 😘
Today I feel gracious and decided to give to the community. And giving not only an indicator but also a trading method
This trading method shows how a convergence based on moving averages is tremendous
Multicolour Bollinger Bands indicator that indicates market phases.
It plots on the price chart, thanks to different color zones between the bands, a breakdown of the different phases that the price operates during a trend.
The different zones are identified as follows:
- red color zone: trend is bearish, price is below the 200 periods moving average
- orange color zone: price operate a technical rebound below the 200 periods moving average
- yellow color zone: (phase 1 which indicate a new bearish cycle)
- light green zone: (phase 2 which indicate a new bullish cycle)
- dark green zone: trend is bullish, price is above the 200 periods moving average
- grey color zone: calm phase of price
- dark blue color zone: price is consolidating in either bullish or bearish trend
- light blue zones: price will revert to a new opposite trend (either long or short new trend)
By identifying clearly the different market phases with the multicolor Bollinger bands, the market entries by either a the beginning of a new trend or just after a rebound or a consolidating phase is easier to spot on.
Trade well and trade safe
Dave

Stochastic ConfluenceShows 5 stochastic plots with moving average cross marks for different time-frames. Each plot is based on the current interval times the configurable multiplier.
E.g.: If you are viewing 1h chart, the settings 1, 2, 3, 4, 6 will get you stochs for the 1h, 2h, 3h, 4h and 6h.

Confluence Strategy Backtest This is modified version of Dale Legan's "Confluence" indicator written by Gary Fritz.
================================================================
Here is Gary`s commentary:
Since the Confluence indicator returned several "states" (bull, bear, grey, and zero),
he modified the return value a bit:
-9 to -1 = Bearish
-0.9 to 0.9 = "grey" (and zero)
1 to 9 = Bullish
The "grey" range corresponds to the "grey" values plotted by Dale's indicator, but
they're divided by 10.
You can change long to short in the Input Settings
Please, use it only for learning or paper trading. Do not for real trading.

Confluence Strategy This is modified version of Dale Legan's "Confluence" indicator written by Gary Fritz.
================================================================
Here is Gary`s commentary:
Since the Confluence indicator returned several "states" (bull, bear, grey, and zero),
he modified the return value a bit:
-9 to -1 = Bearish
-0.9 to 0.9 = "grey" (and zero)
1 to 9 = Bullish
The "grey" range corresponds to the "grey" values plotted by Dale's indicator, but
they're divided by 10.

Confluence script This is modified version of Dale Legan's "Confluence" indicator written by Gary Fritz.
================================================================
Here is Gary`s commentary:
* I moved the core Confluence computations into a Confluence function.
Since the Confluence indicator returned several "states" (bull, bear, grey, and zero),
he modified the return value a bit:
-9 to -1 = Bearish
-0.9 to 0.9 = "grey" (and zero)
1 to 9 = Bullish
The "grey" range corresponds to the "grey" values plotted by Dale's indicator, but
they're divided by 10.
So -0.4 is equivalent to "grey -4" in Dale's indicator.
* I got rid of a bit of extra computation in the function. I didn't try to do a hard-core
Pierre-style optimization :-), but I noticed several significant chunks of calculation were
being done several times each bar, and I commented them out and replaced them with an intermediate
variable. It still calls sine/cosine a dozen times on each bar, which accounts for the bulk of the
processing time, but I think it's a bit easier to understand what the code is doing this way. (It also
seems to work better -- see below.) For the most part I didn't try to use mnemonic names for these
intermediate variables, because I don't understand exactly what the values represent!!
* I'm appending a simplified Confluence indicator using the function.
* I've also appended a simple Confluence system. This system sets an entry stop above/below the current
bar if Confluence goes into bull/bear mode, and similarly sets an exit stop below/above the bar where it
exits bull/bear mode. There's also an optional "aggressive" stop mode that tightens the stops if the market
moves in your direction; for example, if the high is 1000 and your "Trigger" offset is 2, the initial stop
is set at 1002. If the next bar has a high of 997, the stop is tightened to 997+2=999.
Interestingly, when I first wrote this system, I ran into a strange MaxBarsBack problem. The Confluence
indicator worked just fine with a MaxBarsBack setting of "Auto-Detect." But systems don't have a setting
like that -- you have to specify a fixed value. But NO fixed value (up to the maximum of 999) worked for
either the system OR the indicator! And I couldn't see anywhere that it was looking back that many bars.
Then, when I did the optimization on the Confluence code, the MaxBarsBack problem mysteriously disappeared.
Sometimes TradeStation is just spooky... Any ideas what happened?
I've appended a sample system report for the system on SPX, using the default parameters. The system actually
does pretty well. It probably won't make anyone rich, but I thought some folks might enjoy playing with it.
There are some other things you could do with it -- e.g. it might be interesting to change it to look for
long opportunities when Confluence hits -9, and short when it hits 9.
