Ichimoku Cloud Indicator [TradingFinder] Kinko Hyo Cross Alerts🔵 Introduction
The Ichimoku Cloud (Ichimoku Kinko Hyo) is one of the most powerful and complete trading indicators in technical analysis. Originally developed by Japanese journalist Goichi Hosoda, the Ichimoku system combines multiple tools in one indicator, providing traders with instant insights into trend direction, support and resistance levels, and momentum. Unlike simple moving averages (SMA – Simple Moving Average), the Ichimoku Cloud (Kumo – Cloud) integrates dynamic elements that help traders forecast potential price action with greater clarity.
The Ichimoku Indicator (Ichimoku Signal System) is widely used across global markets, from Forex trading (FX – Foreign Exchange) to stocks, indices, and even cryptocurrencies. Its popularity comes from its ability to generate clear buy signals and sell signals based on the interaction of its components: Tenkan Sen (Conversion Line), Kijun Sen (Base Line), Senkou Span A, Senkou Span B, and Chikou Span (Lagging Line). When combined, these lines create the Ichimoku Cloud, which visually represents the balance between price action and market structure.
Ichimoku Cloud Lines Formulas :
Conversion Line (Tenkan Sen / Conversion Line) : Average of the highest high and lowest low over the past 9 periods => (9-PH + 9-PL) ÷ 2
Base Line (Kijun Sen / Base Line) : Average of the highest high and lowest low over the past 26 periods => (26-PH + 26-PL) ÷ 2
Leading Span A (Senkou Span A / Leading Span A) : Average of the Conversion Line and Base Line, plotted 26 periods ahead => (Tenkan Sen + Kijun Sen) ÷ 2
Leading Span B (Senkou Span B / Leading Span B) : Average of the highest high and lowest low over the past 52 periods, plotted 26 periods ahead => (52-PH + 52-PL) ÷ 2
Lagging Span (Chikou Span / Lagging Span) : Current closing price, plotted 26 periods behind.
One of the biggest advantages of the Ichimoku Trading Strategy (Ichimoku Cloud Trading System) is that it allows traders to identify the market condition at a glance. When the price is above the Kumo (Cloud), it indicates a bullish trend (uptrend). When the price is below the Kumo, the market is in a bearish trend (downtrend). And when the price is inside the cloud, the market is ranging (sideways trend). This simplicity and visual clarity make Ichimoku an essential indicator for both beginner traders and professional analysts.
The Ichimoku Cloud Indicator (Ichimoku Technical Analysis Tool) continues to be one of the most reliable charting methods. Traders often consider it superior to basic moving averages (MA – Moving Average) or exponential moving averages (EMA – Exponential Moving Average), because it not only shows trend direction but also highlights potential future support and resistance levels. With its unique combination of trend analysis, price forecasting, and trading signals, Ichimoku remains a core strategy in modern trading systems.
🔵 How to Use
The Ichimoku Cloud is more than just a set of lines; it’s a complete trading system that helps traders identify trends, momentum, and key support and resistance levels. By combining its five lines Conversion Line, Base Line, Leading Span A, Leading Span B, and Lagging Span traders can develop clear buy and sell strategies.
🟣 Identifying Trend Direction
Bullish Trend (Uptrend) : Price is above the cloud (Kumo), and the cloud is green. Leading Span A is above Leading Span B, signaling strong upward momentum.
Bearish Trend (Downtrend) : Price is below the cloud, and the cloud is red. Leading Span A is below Leading Span B, confirming a downward momentum.
Ranging / Sideways Market : Price is inside the cloud, indicating indecision and consolidation. Traders often avoid opening strong positions during these periods.
🟣 Buy Strategies
Conversion/Base Line Crossover : A buy signal occurs when the Conversion Line (Tenkan Sen) crosses above the Base Line (Kijun Sen). The signal is strongest when this crossover happens above the cloud.
Price Above Base Line : If the price moves above the Base Line while in an uptrend, it confirms bullish momentum and provides a favorable entry point.
Cloud Support Pullback : During a pullback in an uptrend, the price may touch or slightly enter the cloud. Traders can use the cloud as a dynamic support zone for buying opportunities.
Lagging Span Confirmation : Ensure the Lagging Span (Chikou Span) is above the price of 26 periods ago to confirm the strength of the bullish trend.
🟣 Sell Strategies
Conversion/Base Line Crossover : A sell signal is generated when the Conversion Line (Tenkan Sen) crosses below the Base Line (Kijun Sen). This signal is strongest when it occurs below the cloud.
Price Below Base Line : If the price falls below the Base Line in a downtrend, it confirms bearish momentum and strengthens the sell setup.
Cloud Resistance Pullback : During a bounce in a downtrend, the cloud acts as a resistance zone. Traders can enter sell positions when price approaches or touches the cloud from below.
Lagging Span Confirmation : The Lagging Span should be below the price of 26 periods ago, confirming downward momentum.
🟣 Cloud Breakout Signals
A strong buy occurs when the price breaks above the cloud from below, signaling a potential trend reversal.
A strong sell occurs when the price breaks below the cloud from above, indicating a shift toward a bearish trend.
🟣 Combining Signals for Stronger Entries
For higher probability trades, combine multiple signals : trend direction (cloud color and position), crossovers (Tenkan/Kijun), and Lagging Span position.
Avoid trading against the overall trend. For example, avoid buying when price is below a red cloud or selling when price is above a green cloud.
🔵 Setting
Tenkan Sen Period : Lookback period for Conversion Line (default: 9).
Kijun Sen Period : Lookback period for Base Line (default: 26).
Span B Period : Lookback period for Leading Span B, forms one Cloud boundary (default: 52).
Shift Lines : Periods forward for Cloud / backward for Lagging Span (default: 26).
Cross Tenkan/Kijun Alert : Alert on Conversion/Base Line crossover.
Cross Price/Tenkan Alert : Alert when price crosses Tenkan Sen.
Cross Price/Kijun Alert : Alert when price crosses Kijun Sen
🔵 Conclusion
The Ichimoku Cloud (Ichimoku Kinko Hyo) is much more than a simple indicator it is a complete trading system that combines trend detection, momentum analysis, and support/resistance identification in one view. By interpreting the position of price relative to the cloud, the interaction between Tenkan Sen (Conversion Line) and Kijun Sen (Base Line), the leading spans (Senkou Span A and B), and the Chikou Span (Lagging Line), traders can identify potential buy and sell opportunities with higher confidence.
The main advantage of the Ichimoku Cloud is its ability to provide a “one-look equilibrium” snapshot of the market. It highlights bullish trends when the price is above the cloud, bearish conditions when the price is below it, and indecision or transition when the price is inside the cloud. Crossovers, cloud breakouts, and confirmations by the Chikou Span strengthen the trading signals.
However, traders should keep in mind the limitations of the Ichimoku system. It is based on historical data and should not be used in isolation. Combining it with other tools such as RSI, volume analysis, or candlestick patterns can significantly improve accuracy and reduce false signals.
Chikouspan

ChikouLibrary "Chikou"
This library contains Chikou Filter function to enhances functionality of Chikou-Span from Ichimoku Cloud using a simple trend filter.
Chikou is basically close value of ticker offset to close and it is a good for indicating if close value has crossed potential Support/Resistance zone from past. Chikou is usually used with 26 period.
Chikou filter uses a lookback length calculated from provided lookback percentage and checks if trend was bullish or bearish within that lookback period.
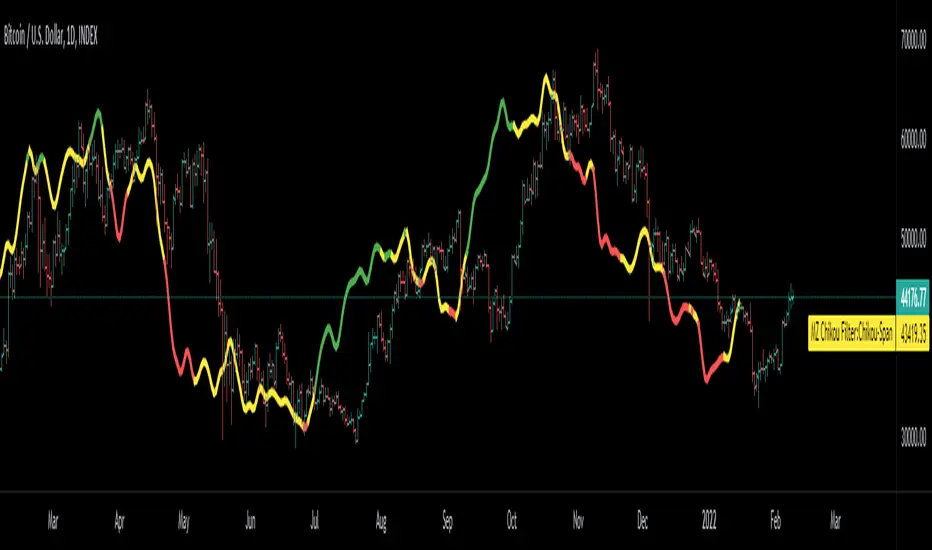
Bullish : Trend is bullish if Chikou span is above high values of all candles within defined lookback period. Bull color shows bullish trend .
Bearish : Trend is bearish if Chikou span is below low values of all candles within defined lookback period. This is indicated by Bearish color.
Reversal / Choppiness : Reversal color indicates that Chikou are swinging around candles within defined lookback period which is an indication of consolidation or trend reversal.
chikou(src, len, perc, _high, _low, bull_col, bear_col, r_col) Chikou Filter for Ichimoku Cloud with Color and Signal Output
Parameters:
src : Price Source (better to use (OHLC4+high+low/3 instead of default close value)
len : Chikou Legth (displaced source value)
perc : Percentage lookback period for Chikou Filter with defined how much candels of total length should be considered for backward filteration
_high : Ticker High Value
_low : Ticker Low Value
bull_col : Color to be returned if source value is greater than all candels within provided lookback percentage.
bear_col : Color to be returned if source value is lower than all candels within provided lookback percentage.
r_col : Color to be returned if source value is swinging around candles within defined lookback period which is an indication of consolidation or trend reversal.
Returns: Color based on trend. 'bull_col' if trend is bullish, 'bear_col' if trend is bearish. 'r_col' if no prominent trend. Integer Signal is also returned as 1 for Bullish, -1 for Bearish and 0 for no prominent trend.

Chikou Filter for Ichimoku CloudThis Indicator enhances functionality of Chikou-Span from Ichimoku Cloud using a simple trend filter.
Methodology
Chikou is basically close value of ticker offset to close and it is a good for indicating if close value has crossed potential Support/Resistance zone from past. Chikou is usually used with 26 period.
Chikou filter uses a lookback length calculated from provided lookback percentage and checks if trend was bullish or bearish within that lookback period.
Bullish : Trend is bullish if Chikou span is above high values of all candles within defined lookback period. Green color shows bullish trend.
Bearish: Trend is bearish if Chikou span is below low values of all candles within defined lookback period. This is indicated by red color.
Reversal / Choppiness : White color indicates that Chikou are swinging around candles within defined lookback period which is an indication of consolidation or trend reversal.
Default Settings
Different source types are included but I've found that (OHLC4+High+Low)/3 is better for Chikou and Symmetrically Weighted Moving Average (SWMA) is also applied but it produce some repainting though. Default period is set to 26 and lookback percentage is 50%. Low percentage would decrease filter's efficiency.
Usage
This filter can be used to check if Chikou crossover has occurred in past. This can be used with Donchain channels, Bollinger Bands or any Moving Average as replacement of High / Low values. I'll use this indicator in all my Ichimoku Cloud studies especially adaptive ones. Filter outputs in Color and Integer format; both can be used as signals definitions.
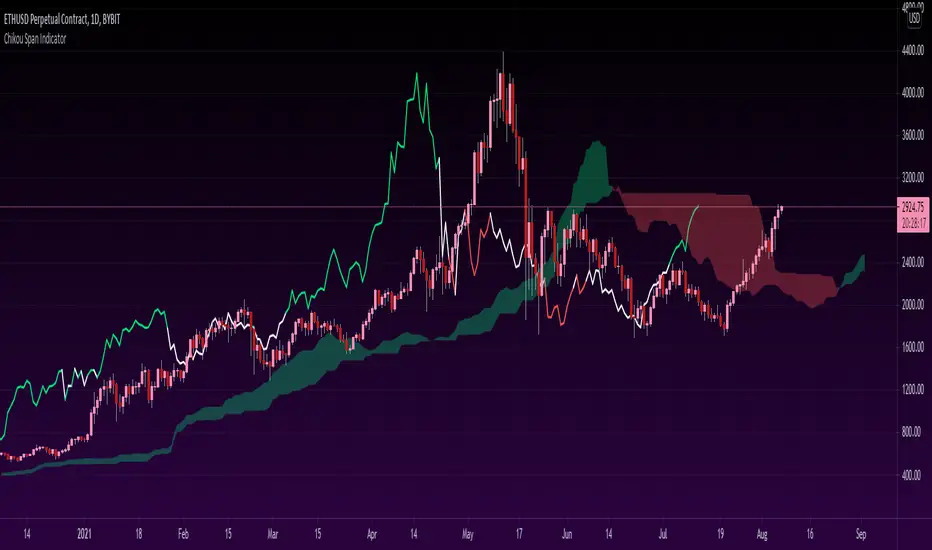
Chikou Span 'Open Space' ColorsThe Ichimoku Clouds strategy has been one of my favorite scripts to work with since I came across it a few months ago, so I thought I'd share one of the automated features I created for the strategy.
For the purpose of this script, I'll only explain the Chikou Span aspect of it since there are plenty of other explanations about Ichimoku Clouds.
The Chikou Span is one of the most useful aspects of the Ichimoku Clouds strategy despite it not being used in most people's strategies. It is calculated by simply taking the current closing value and plotting it backwards 26 bars. The Chikou Span is used to identify large trend moves and trend reversals by what is referred to as 'open space'. This occurs when the Chikou Span is not intersecting any candlestick within 10 bars (if you were to draw a horizontal line from the tip of the Chikou Span, it would not touch any part of a candle within 10 bars).
The purpose of this script is to better identify the Chikou Span reaching 'open space' by coloring the Chikou Span's line:
- Green when it is in upwards open space (bullish trend), and
- Red when it is in downwards open space (bearish trend).
I've also included my personal color scheme for the Ichimoku Clouds strategy as well as inputs to turn on/off every aspect of the strategy.
** Disclaimer: THIS IS NOT TRADING ADVICE. The Chikou Span should not be used on its own to make any trades. When trading with the Ichimoku Cloud strategy, one should utilize all 5 lines of the strategy to make realistic trades. If you'd like to learn more, I'd recommend reading "Trading with Ichimoku Clouds - The Essential Guide to Ichimoku Kinko Hyo Technical Analysis" **
Ichimoku by HosodaWritten from scratch Ichimoku indicator, based on original calculations from Hosoda books. All formulas are exactly the same as Hosoda put them in his books, it contains additionally analysis from Higher Timeframe allowing to display Chikou trend, Kijun and Senkou-span B which are crucial in determining trend. It also contains overlay of Kyushu Legs. This is initial version of script and will be contanstly improved.
Some Ichimoku scripts have basic bugs in calculations and I ensure that formulas in this indicator are fully correct in relation to formulas provided by Hosoda.

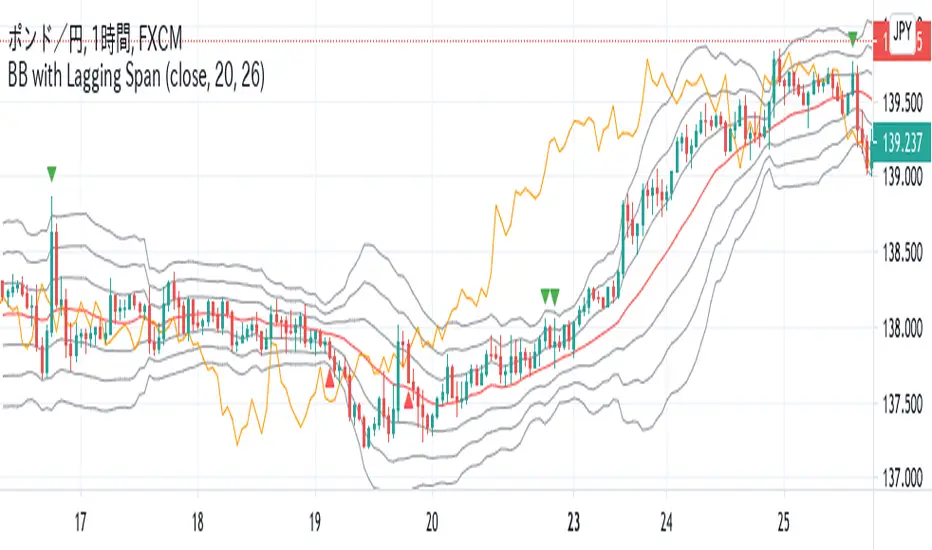
Bollinger Bands with Lagging Span(Chikou Span)Japanese below / 日本語説明は下記
Summary
This indicator shows Bollinger bands with plus/minus 3σ bands and lagging span(called chikou span in Japanese as used in Ichimoku cloud) showing alert when lagging span crossing plus/minus 2σ bands, which are buy/sell signal respectively.
Bollinger bands are one of frequently used technical analysis indicators in trading and some traders use Bollinger bands and lagging span together in order to identify trading opportunities.
When lagging span crosses upper bands in bullish trend and lower bands in bearish trend, that would be considered buying/selling opportunities respectively.
Generally, lagging span is used offsetting current price by 26 period.
This indicator shows signal and alerts when lagging span crossing ±2σ bands as potential trading opportunities.
Functions
-To show Bollinger bands with plus/minus 3 sigma bands
-To show SMA as Bollinger bands middle line with configurable period of SMA.
-To show lagging span, enabling users to set lagging period and control display of lagging span by checkbox
-To show signal on chart when lagging span crosses +2σ bands and -2σ band with ability to set alert
-To control display of the signal by checkbox
Sample chart with the indicator
——————————————————————————————
概要
ボリンジャーバンド(±3シグマ)と遅行スパンを同時に表示するインジケーターです。遅行スパンが±2シグマと交差するとチャート上にシグナルを表示するとともに、アラートを設定することができます。
ボリンジャーバンドはテクニカル分析で最も使われているインジケーターの一つです。トレーダーの中にはボリンジャーバンドと遅行スパンを共に用いることで売り買いのサインを捉える手法を使っている方もいます。
上昇トレンドにおいては、遅行スパンがプラスのバンドを上抜いた時を買いサイン、下降トレンドにおいては、遅行スパンがマイナスのバンドを下抜いた時を売りサインとして捉えるものです。
一般的には、遅行スパンは現在価格を26期間オフセットしたラインが用いられます。
このインジケーターでは、遅行スパンがプラスマイナス2シグマを抜いた時にチャートへのシグナル表示と、アラート設定が可能です。
機能
-±1-3シグマのボリンジャーバンドの表示
-ボリンジャーバンドの基準線としてのSMAの表示(期間は設定可能)
-遅行スパンの表示(遅行期間の設定及び表示非表示の切り替え可能)
-遅行スパンがプラス2シグマバンドを上抜いた場合、マイナス2シグマバンドを下抜いた場合にチャート上にシグナルを表示(同じ条件でアラート設定が可能)
-シグナルの表示・非表示の切り替え
サンプルチャート
【Super Bollinger】The market consists of three phases: an uptrend phase, a downtrend phase, and a range-bound phase.Furthermore, if we include a trend phase and a correction phase, the market has five phases. In other words, the market is classified into the “five phases” as below:
1) Uptrend market (trend phase, upward bias)
2) Downtrend market (trend phase, downward bias)
3) Upward correction phase (correction phase, upward bias)
4) Downward correction phase (correction phase, downward bias)
5) Range-bound phase, sideways (correction phase, basically not biased)
For your judgment of the above market trends, Super Bollinger is extremely useful and effective. And Super Bollinger has advantage in judging market price level.
そもそも、相場は、5つの局面に分けることができます。
すなわち、
1)上昇トレンド局面(上昇バイアス)
2)下降トレンド局面(下降バイアス)
3)調整の反騰局面(上昇バイアス)
4)調整の反落局面(下降バイアス)
5)レンジ局面(バイアスなし)
そして、スーパーボリンジャー、これら5つの局面の判断を下す際にきわめて有効なツールです。また、とりわけ、価格分析に優れたチャートです。
With regard to Chikou Span,this span gives very useful information about (1) the direction of the market (being in an upward bias by buying pressure or in a downward bias by selling pressure) , (2) the timing of buying on the dip or selling on the rally, (3) the market’s temporal rhythm etc..
遅行スパンに関しては、基本的に、
(1)相場の方向性(買い優勢か売り優勢か)
(2)押し目買いや戻り売りのタイミング
(3)相場の時間的リズム
等々に関して実に有効な情報を与えてくれます。
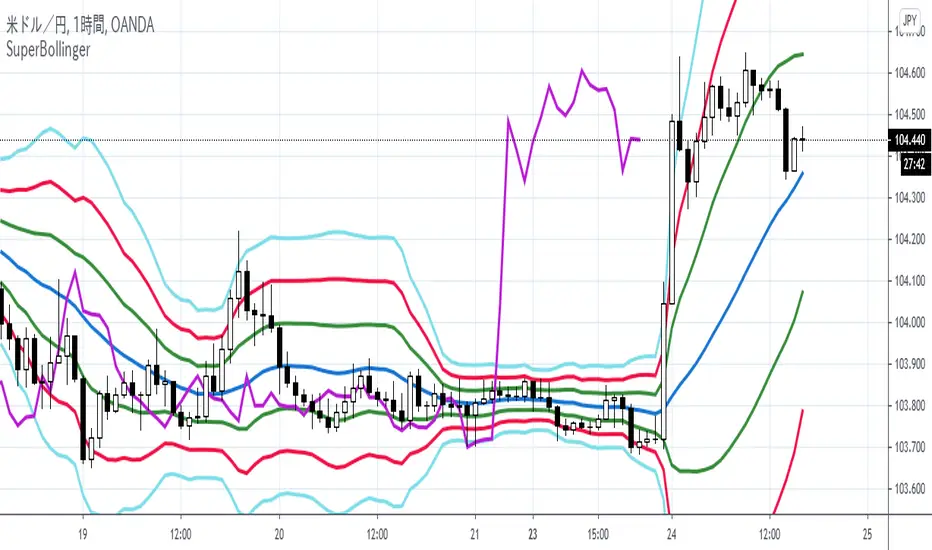
【SpanModel】The Span Model is a very unique chart which shows us especially when to buy and when to sell. And the Span Model has advantage in judging the trade timing.
スパンモデルとは、いつ買うか、いつ売るかを教えてくれるとてもユニークなチャートです。とりわけ、トレードのタイミングを判断する上で優れています。
The Span Model is composed of only three lines (spans).
They are the Blue Span, the Red Span and the Chikou Span.
And a major characteristic of the Span Model is the signals (Span Model Signals) of the two types explained below:
1) Buy signal
The buy signal is lit when the Blue Span sits above, and the Red Span sits below.
2) Sell signal
The sell signal is lit when the Red Span sits above, and the Blue Span sits below.
スパンモデルには、構成要素(3つのスパン)として、青色スパン、赤色スパン、そして、遅行スパンがあります。
スパンモデルの大きな特長として、シグナル(スパンモデルシグナル)があります。そして、2種類のシグナルがあります。
1)買いシグナル
青色スパンが上方、赤色スパンが下方に位置するときに点灯します。
2)売りシグナル
赤色スパンが上方、青色スパンが下方に位置するときに点灯します。

Ichimoku Kinko Hyo Strategy+ EMA + 3ATRThis trading strategy uses combination of the Ichimoku Kinko Hyo system with Fibonacci numbers based 13/21/55 exponential moving average ( EMA ) crossover, giving good results in various trending assets !
Also has the Trend-following indicator combining SuperTrend with Chiku breakout from Ichimoku is added in order to confirm trend pattern.
The Ichimoku Kinko Hyo system includes five kinds of signal, of which this strategy uses the most recent of ones i.e. Tenkan Sen / Kijun Sen Cross and price crosses the Kijun Sen. As the Chikou Span, Senkou Span A and Senkou Span B are shifted into the past/future.
The Tenkan Sen, also known as the Turning or Conversion line, is a moving average of the highest high and lowest low over the last 9 periods in this strategy.
The Kijun Sen, also known as the Standard or Base line, is a moving average of the highest high and lowest low over the last 26 periods in this strategy.
The Chikou Span, also known as the Lagging line, is the closing price plotted 26 periods behind in this strategy.
The Senkou Span A, also known as the 1st leading line, is a moving average of the Tenkan Sen and Kijun Sen and is plotted 26 periods ahead in this strategy.
The Senkou Span B, also known as the 2nd leading line, is a moving average of the highest high and lowest low over the last 52 trading days is plotted 26 periods ahead in this strategy.
EMA is quicker to react to the current market price is because EMA gives more importance to the most recent data points. This helps the trader to take quicker trading decisions. Just used the laws of nature for EMA numbers: taken from Fibonacci sequence numbers 13/21/55
A SuperTrend employs ATR values to calculate the indicator values. The SuperTrend indicator combined with Chiku breakout from Ichimoku and plotted. The indicator line changes its color between green and red based on the price momentum in the underlying.
bg_Ichimoku_AlertsVersion 1.0
This script is a version of the Ichimoku Cloud indicator, which has its default settings optimized for Cryptocurrency trading. (20 Period Tenkan, 60 Period Kijun, 120 Period Senkou A, 30 Period Senkou B, 30 Period Offset/Displacement).
This script contains shape-plots and alert conditions for the following events:
- Bullish Entry into Red Kumo Cloud (Long Signal)
- Bearish Entry into Green Kumo Cloud (Short Signal)
- Edge-To-Edge(E2E) Completion on either type of Cloud (Possible Reversal Signal)
- Red & Green Kumo Cloud Breakout (Long or Continuing Long Signal)
- Kumo Cloud Support Breakdown, Top and Bottom of Cloud (Short Signal)
- Kumo Cloud Potential Bounce and Rejection
- Tenkan/Kijun Crossup/Down
Some things to note:
- Using short timeframes can cause certain alerts to fire many times, such as an E2E detection in a very thin cloud, or short/breakout when price is back-and-fourth at the edge of a cloud.
- The shapes are mostly there to provide a way to backtest when alerts would be triggered. They can be turned off in the settings if they become obnoxious and fill the screen with clutter.
At the time of releasing this script, the strategy version of this is still in development, but should be similarly released relatively soon. This indicator version of the script is intended for alerts, notifications, bot calls, and just general visual analysis of price action.
Thanks,
Bryan

My Ichimoku indicator & Strategyhello I'm a beginner in trading, but I try to learn how to code strategies.
I recoded the Ichimoku indicator, and created my personnal strategy based on it.
The backtesting is done from 1/1/2017 to today in 45 min Time Unit for candles, with a 1 000 € equity.
The trades are all Long Entries and Exits with no pyramiding, no short trades at all.
/!\ Exchanges commission fees are not calculated and can in reality easily divide by 2 the total profit (am I right guys?) /!\
A buy signal is triggered upon these conditions:
- close is above the Kuma (cloud)
AND
- close crosses over Kijunsen AND Kijunsen is not flat (calculated with rising and falling with input "Kijunsen Lag")
OR
- Close crosses over ChikouSpan AND there was a sell signal in the last 8 candles
Sell signal is the same but reversed.
I appreciate your feedback ! Maybe I will update this later if I get better results.
