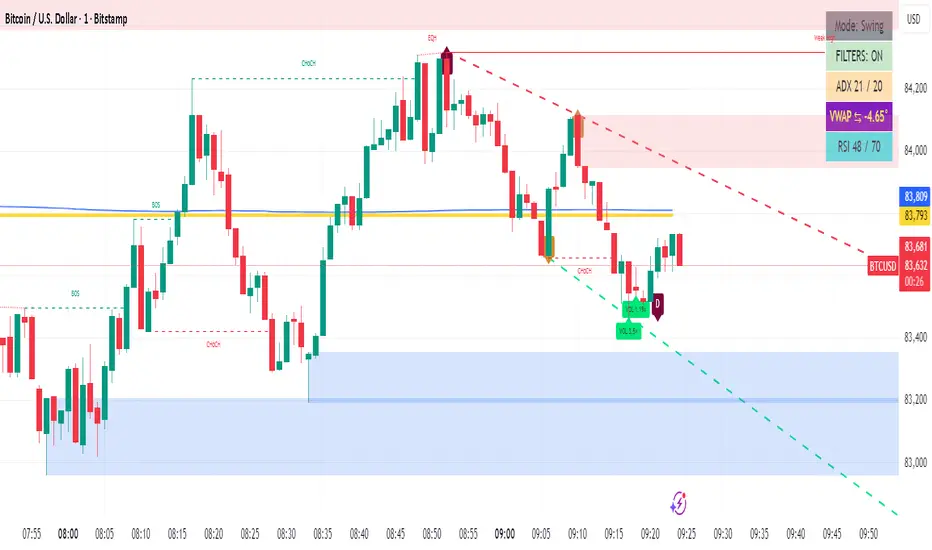
A+ Setup Strategy Trendline Features Added:
1. Automatic Trendline Detection
Support Trendline (green) - Connects swing lows
Resistance Trendline (red) - Connects swing highs
Uses pivot points to identify key swing levels
Validates trendlines by counting touches (minimum 3 touches required)
2. Trendline Settings
Show Trendlines - Toggle on/off
Lookback Period - How far back to look for pivots (default: 50 bars)
Min Touches - How many touches needed for valid trendline (default: 3)
3. Trendline Break Detection
Bullish Break - Price breaks above support trendline (marked with small green circle)
Bearish Break - Price breaks below resistance trendline (marked with small red circle)
Generates signals when breaks occur
4. Enhanced A+ Setups
Now includes ULTRA setups - the absolute best trades:
ULTRA BUY Setup (Aqua label):
Bullish FVG + BOS + Volume Spike + Uptrend
PLUS: Support trendline break OR near key support
PLUS: Trendline breakout confirmation
ULTRA SELL Setup (Fuchsia label):
Bearish FVG + BOS + Volume Spike + Downtrend
PLUS: Resistance trendline break OR near key resistance
PLUS: Trendline breakdown confirmation
5. Confluence Integration
The strategy now considers price near trendlines as additional confluence, similar to how it uses daily S/R levels.
6. Additional Alerts
Support Trendline Break
Resistance Trendline Break
ULTRA BUY/SELL Setup alerts
This gives you multiple tiers of signal quality:
Standard A+ Setup - All conditions met
ULTRA A+ Setup - All conditions + trendline break (highest probability)
The trendlines will help you identify major trend reversals and breakouts for even better entry timing!
Motif-Motif Chart

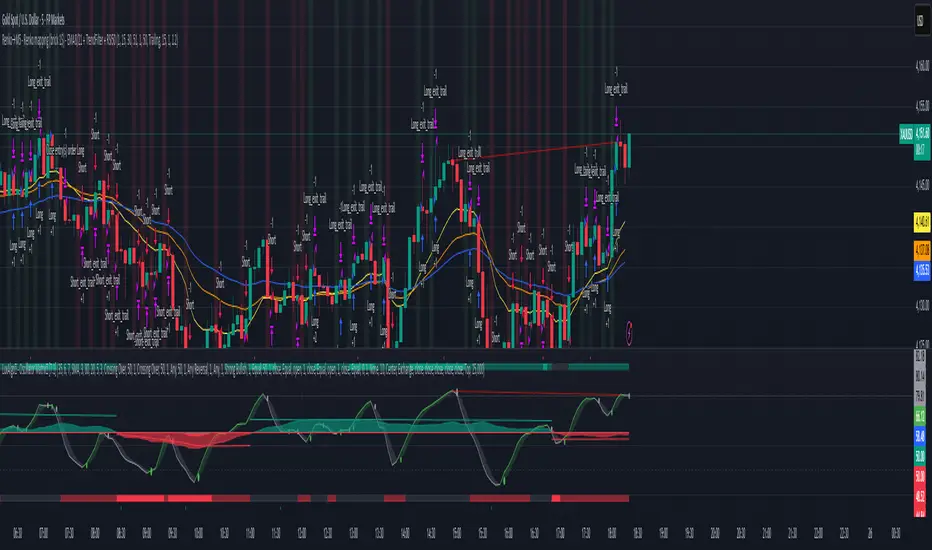
VWolf – Apex GateOverview
VWolf – Apex Gate is a trend-continuation system that blends a Pivot-weighted Supertrend (PVT ST) with an optional **Normal Supertrend** trigger, all **gated by a 200-EMA directional filter. The strategy’s risk controls are volatility-aware—**stops and targets scale by ATR**, and quantity is computed from a fixed **% risk per trade**. Clear **Backtest / Forwardtest** modes with date windows let you validate on segmented datasets before committing to live use.
Recommended Use
- **Markets:** High-liquidity instruments (indices, large-cap equities, liquid FX and major crypto pairs) where trends and pullbacks are clean.
- **Timeframes:** 15m–1h for active intraday; 4h–1D for swing. Lower timeframes may benefit from stricter EMA gating and slightly wider ATR stops.
- **Workflow:**
1. Start with **Backtest** to set baseline ATR/EMA parameters.
2. Move to **Forwardtest** to confirm generalization.
3. Consider walk-forward or multi-symbol rotation to assess robustness.
Strengths & Precautions
Strengths
- **Dual engine** (PVT ST + Normal ST) improves signal quality; the **EMA gate** screens counter-trend noise.
- **ATR-native** stops/targets standardize risk across regimes/instruments.
- **Capital-proportional sizing** preserves account geometry and smooths drawdowns.
- **Clear test segmentation** supports objective evaluation.
Precautions
- **Whipsaw risk** in tight ranges: widen ATR multipliers, enable the EMA gate, or require co-confirmation.
- **Supertrend-anchored stops** can expand in volatility spikes; ensure **% risk** remains within tolerance.
- **One-position policy** avoids stacking risk but forgoes scaling into strong trends; advanced users may prefer add-on frameworks outside this baseline.
Conclusion
VWolf – Apex Gate seeks to enter shortly after **regime flips**, demanding alignment between a **pivot-aware Supertrend** and (optionally) a **classic Supertrend**, while an **EMA gate** enforces directional discipline. With **ATR-driven** stops/targets and **fixed-fraction** sizing, the system adapts naturally to changing volatility. Use the **Backtest** window to dial ranges and the **Forwardtest** window to prove durability on unseen data. For best results, tailor ATR multipliers and the EMA gate to your instrument’s structure and your personal drawdown tolerance.

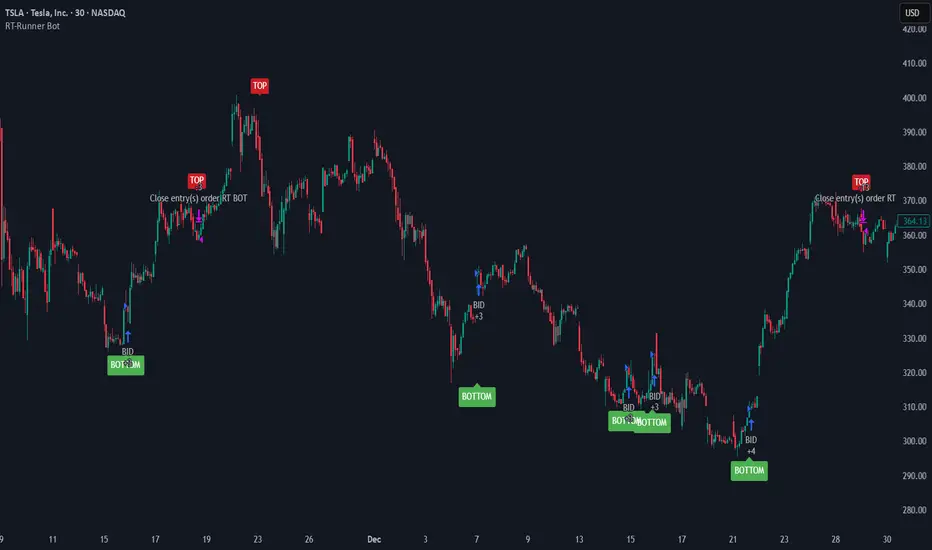
RT-Runner BotRunner Bot is a trend following tool designed to highlight when price shifts from normal back and forth rotation into stronger directional moves. It is built to help traders focus on higher quality trend legs, stay patient during chop, and avoid forcing trades when conditions are not aligned.
Blurring The Lines - Indicator vs Bot
Rainbow Trends set out to combine some of the ideas behind automated trading bots with the flexibility of trading indicators. After years of development, Runner Bot was built as an "indicator bot" that can be applied across multiple assets and multiple timeframes from the same interface.
How It Works
This tool aims to identify points where large market players - the "whales" - may be more likely to reverse the trend. It generates BOTTOM signals when its conditions suggest a potential market bottom has formed, and TOP signals when it detects that a potential top has been reached.
These signals are plotted directly on the chart so traders can visually review where Runner Bot has flagged prior tops and bottoms and compare them with their own levels, structure, and risk management.
How It Changes With Timeframe
Runner Bot identifies trend reversals based on the selected timeframe. The same logic can be applied across intraday, swing, and macro views, but its behavior will naturally change:
For macro level reversals, many traders focus on higher timeframes such as H4 to H12.
If you are scalping, you can switch to much lower timeframes, but keep in mind that bottoms detected on shorter intervals are less reliable at predicting a true long term bottom.
Choosing the timeframe intentionally is important: higher timeframes tend to highlight larger structural tops and bottoms, while lower timeframes are more sensitive to short term noise.
Tuning The Bot
Runner Bot was built to be relatively turnkey, but it does allow users to tune it for specific timeframes and assets.
To adjust the sensitivity of the TOP/BOTTOM prints, adjust the first two values in the settings column:
Decreasing these values (negative adjustments) will generally increase the number of TOP/BOTTOM signals the bot will fire.
Increasing these values will do the opposite and make TOP/BOTTOM signals less common.
This lets traders decide whether they want Runner Bot to be more selective (fewer, higher conviction style signals) or more frequent (more signals for active traders).
The trader also has the option to toggle the signals On/Off as desired. Some traders prefer to only plot TOPs and not BOTTOMs, or only BOTTOMs and not TOPs, depending on their strategy.
Limitations Of The Tool
Under the hood, Runner Bot uses internal algorithms working together to analyze price action. It can be applied across multiple timeframes, but like any tool, it has its sweet spots:
On higher ranges like 12H to 1D, you will mostly see TOP signals, which can be useful for monitoring extended moves.
On ultra low timeframes under 15 minutes, market noise can increase and short term bottoms are less reliable as long term turning points.
Fine tuning your settings to match your strategy, asset, and timeframe is recommended rather than relying on one configuration for every situation.
Preferred Settings
Over time, a few configurations have become common starting points:
H4 - A core timeframe to start catching both Tops and Bottoms across TradFi, Crypto, and Commodities.
H2/H4 Combo - Monitoring Bottoms on H2 and taking profits on H4 has been a popular combination among Rainbow Theory traders. H2 can provide earlier entries, while H4 offers a more conservative, lagging exit.
1D/H24 - Helpful for macro Tops in both TradFi and Crypto when combined with other higher timeframe context.
These are not rules, but practical examples of how some traders choose to deploy Runner Bot.
Automating Alerts
Runner Bot can also be connected to standard TradingView alerts so TOP and BOTTOM signals do not need to be watched manually on every bar.
A typical alert setup:
Symbol - Set to the asset you are charting.
Condition - Set to Runner Bot (this will use the settings you currently have on the chart).
Condition detail - Use the alert() function calls only so the tool can send alerts when TOP or BOTTOM signals fire.
Interval - Same as chart (this locks alerts to the timeframe you set them up on).
Once alerts are configured, TradingView can notify you according to your alert preferences whenever Runner Bot detects a new TOP or BOTTOM based on your current settings.
Important Note
Runner Bot is intended to provide additional context around tops, bottoms, and broader trend behavior. It is not a standalone signal generator and should always be used together with your own analysis, testing, and risk management. Historical Runner Bot signals and past market reversals do not guarantee future results.
🐋 Tight lines and happy trading!

stormytrading orb botshows entries for 15m orb based on 5m break and retest made solely for mnq or nq, works good with smt
shows trades for ldn, nyc, nyc overlap and Asia session, pls follow stormy trading on insta for more


ZanScritp 1:3 | 21.00-22.00 WIB | XAUUSD TF 5MStrategy Overview (Short & Simple Explanation)
This strategy focuses on taking high-quality trades during a specific hour of the day (20:00–21:00 WIB), when market movement is often more reliable. It looks for clear trends, avoids extreme market conditions, and only trades when volatility is healthy.
It uses a fixed Risk–Reward of 1:2, meaning every trade aims for twice the potential profit compared to the risk. Stop Loss (SL) and Take Profit (TP) levels are set immediately when a trade opens and never move afterward.
When a buy or sell signal appears, the strategy automatically draws:
An entry line
A Stop Loss line
A Take Profit line
A label showing the trade information
The system is designed to avoid “repainting,” ensuring trade entries stay consistent, while SL and TP always trigger exactly when price touches them—creating a stable and predictable trading workflow.
Target Audience
This strategy is designed for:
1. Beginner to Intermediate Traders
Those who want a simple, rule-based system focused on:
Clear trend direction
Fixed risk-reward
Easy-to-understand SL/TP logic
2. Scalpers & Intraday Traders
Traders who prefer:
Short trading windows
High-probability session filtering
Clean execution without repainting

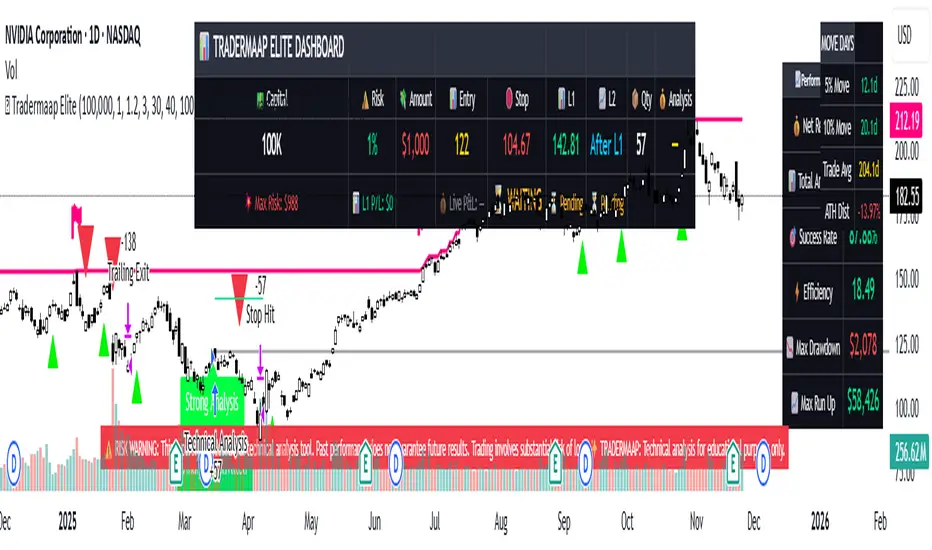
Tradermaap Elite System [Institutional Grade Analysis]Description:
🚀 Institutional Trend Modeling & Automated Risk Engine
Tradermaap Elite is a proprietary quantitative trading system designed for professional scalpers, swing traders, and prop firm challengers. It moves beyond standard indicators by utilizing a Dynamic Mean Reversion Algorithm to identify high-probability structural turning points in the market.
This is NOT just a buy/sell arrow tool. It is a complete Decision Support System that mathematically calculates your risk, entry, and exit zones based on institutional order flow concepts.
🛠️ Key Features
✅ 100% Non-Repainting Engine: Signals are locked on candle close. No disappearing acts. ✅ Institutional Baseline Logic: Uses a proprietary blend of long-term trend filters to avoid false signals in choppy markets. ✅ Auto Risk Guard: Automatically calculates Position Size based on your account balance and defined risk (1% Prop Mode). ✅ Multi-Asset Calibration: Algorithmically tuned for Bitcoin, Gold, Indices (US30/NAS100), and Equities. ✅ Live Dashboard: Tracks real-time Win Rate and Profit Factor directly on your chart. ✅ Dynamic Currency: Switch between USD ($) and INR (₹) in settings.
🧠 How It Works (The Logic)
The system operates on a 3-Stage "Confluence" Mechanism:
Macro Trend Identification: The algorithm scans for the dominant market direction using a Weighted Trend Filter.
Equilibrium Reversion: It identifies when price is "overextended" and waits for it to return to the "Value Zone" (Discount/Premium levels).
Volatility Trigger: A trade is only validated when specific volume and price action conditions are met, filtering out weak moves.
Projected Outcomes:
Protective Stop: Structure-based invalidation levels.
Target 1: Conservative banking zones.
Target 2: Trend-following extensions.
🔒 Access & Licensing
This operates as a Protected Algorithm. It is strictly Invite-Only. To obtain a license key or start a trial, please refer to the link in the signature below.
⚠️ RISK DISCLAIMER: This script is for educational and chart analysis purposes only. It incorporates mathematical modeling to assist in decision-making but does not guarantee profits. Trading is inherently risky. Use responsibly.
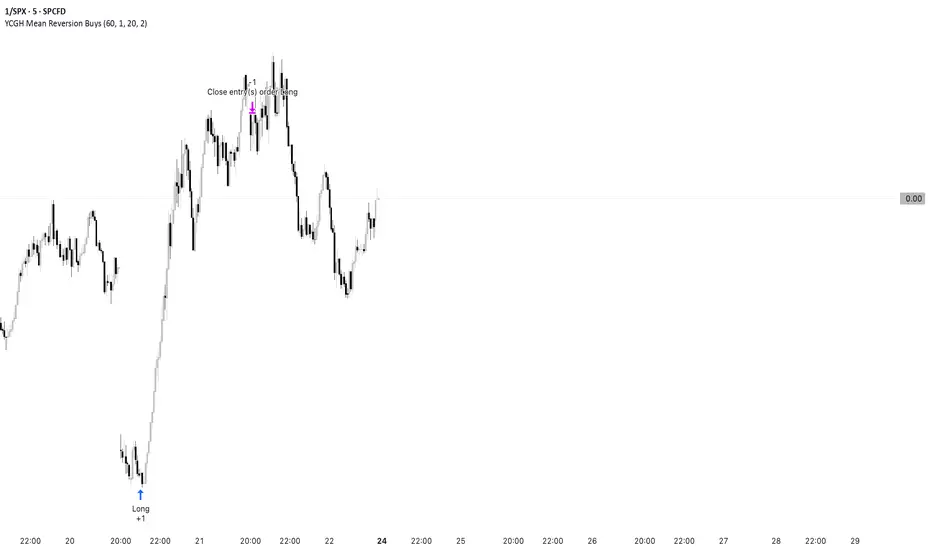
YCGH Mean Reversion StrategyThis strategy applies a classic mean-reversion framework inspired by the concepts popularized by Ernest P. Chan in his quantitative trading books.
It uses Bollinger Bands and RSI to identify statistically stretched conditions where price has moved too far from its average. When price dips below the lower band with weakening momentum, the strategy accumulates small long positions, expecting reversion toward the mean. As price rebounds above the upper band, it exits positions gradually. Position sizing limits help control risk and avoid excessive exposure.
Special thanks to Ernest P. Chan for his influential work in quantitative trading, which motivated the structure and logic behind this model.
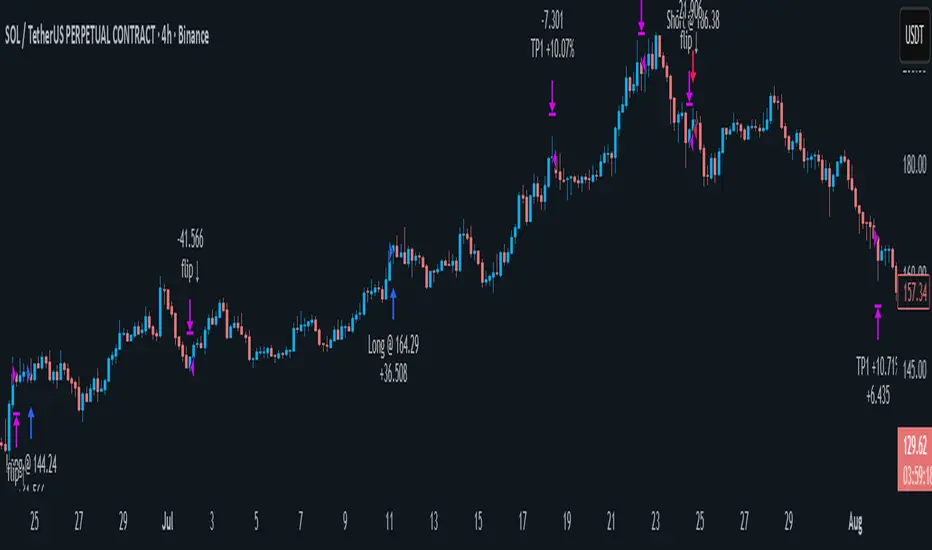
AlgomaticPro - Trend Sniper (BTC, ETH, SOL) 4H timeframeBest performing coins - BTC, ETH, SOL, ADA, DOGE, AVAX, DOT, NEAR, VET, KAS
Best Performing timeframe - 4H
CBS Strategy with Trailing Stop _ IK3-Candle High/Low Breakout Strategy – Clean, Powerful, Fully Customizable (Pine Script v6)
A simple yet effective momentum breakout strategy that triggers trades when price closes above the highest high or below the lowest low of the previous 3 completed candles.
Perfect for trending markets (stocks, forex, crypto, indices) on any timeframe.
Key Features:
• Pure price-action breakout logic (no repainting)
• Long & Short entries with visual triangle signals
• Built-in Stop Loss & Take Profit (fixed % or ATR-based)
• Optional Trailing Stop (percentage or ATR multiplier)
• All risk parameters fully adjustable from the settings panel
• Clean on-chart visualization of SL, TP, and active trailing stop levels
• Works on all instruments and timeframes
Default Settings (2:1 Reward/Risk):
• Stop Loss: 1.5%
• Take Profit: 3.0%
• Trailing Stop: 1.0% (optional)
How to Use:
1. Add to chart
2. Adjust risk settings to match your style (fixed % or ATR)
3. Enable/disable trailing stop as needed
4. Backtest and optimize per instrument/timeframe
Fully open-source • No external libraries • Pine Script v6
Great for swing trading, intraday breakouts, or as a base for further enhancements.
Happy trading!

V15.0 Adaptive Chameleon [Pro]
# **V15.0 Adaptive Chameleon – Strategy Description**
**Adaptive Chameleon** is a fully automated TradingView strategy powered by a signal engine based on multi-timeframe trend analysis, adaptive moving averages, and a volatility filter. The goal is to trade in the direction of a strong and confirmed trend, avoid opening trades in weak or manipulative price zones, and establish positions with a clearly defined risk/reward ratio.
---
## **1. General Logic and Philosophy**
The strategy divides tasks between two timeframes:
* **4-Hour Chart → Trend Manager (Boss)**
Determines the direction and strength of the trend.
* **4-Minute Chart → Entry Trigger (Operating Unit)**
Generates the ideal entry signal in the direction of the trend.
Thanks to this structure, the strategy both follows the long-term main direction and finds clear entries with low lag on smaller timeframes.
---
## **2. Trend Detection (4H)**
The strategy uses **KAMA (Kaufman Adaptive Moving Average)** and **ADX** to identify trends on the higher timeframe.
### **KAMA – Adaptive Trend Line**
* The KAMA is much more "smart" than traditional moving averages.
* It accelerates during price movements and decelerates during sideways movements.
* This allows for much clearer detection of trend direction.
### **ADX – Trend Strength Meter**
The strategy only opens trades when **trend strength** is rising (above the ADX average).
This prevents unnecessary trades when the trend is weak.
### **Trend Rules**
* Price above the KAMA → **Uptrend**
* Price below the KAMA → **Downtrend**
* ADX widening → **Trend strong**
The entry trigger is activated when these three conditions are met together.
---
## **3. Entry Engine (45m)**
On the 45-minute timeframe, the system uses the following components:
### **AlphaTrend (MFI + ATR-Based Adaptive Line)**
* Measures market flow direction with MFI (Money Flow Index),
* Measures price level breakouts with ATR (Volatility).
AlphaTrend detects whether the price is likely to reverse upwards or downwards.
### **Entry Signal**
* **Buy signal:** If the AlphaTrend has reversed upwards based on recent bars
* **Sell signal:** If the AlphaTrend has broken downwards
### **Pivot Points (For Stop)**
* The **pivotLow** and **pivotHigh** levels of the last 10 bars are calculated.
* These are used to determine the most logical stop distance.
---
## **4. Protection Shields**
The strategy uses two main filters to protect against the most dangerous conditions in the crypto market:
### **1. Pump/Dump Filter**
* A candlestick length greater than 4% is considered a "pump bar."
* Never open a trade on these bars.
The goal: to avoid sudden manipulation candlesticks.
### **2. RSI Filter**
* Long trades: RSI > 45 (open long on weak momentum)
* Short trades: RSI < 55 (open short on extremely strong momentum)
These filters provide more balanced entries.
---
## **5. Final Entry Conditions**
### **All conditions are required simultaneously for long:**
1. 4H trend up
2. ADX trend strength increasing
3. 45m AlphaTrend issued a "buy" signal
4. RSI > 45
5. No candlestick pump
6. Date range is suitable
### **All conditions apply in the opposite direction for short.**
---
## **6. Exit Mechanism (Stop, TP, Trailing)**
The strategy uses a three-layer structure on the exit side:
### **1. Pivot-Based Stop**
* Stop distance = Entry price − Pivot Low (for long)
* Minimum stop distance = **1% of the price**
Provides both structural and mathematical security.
### **2. Fixed R:R (Default 1:2)**
* TP = Entry + Stop Distance × R:R
The default 2R target is ideal for trend systems.
### **3. Optional Trailing Stop**
* Dynamic trailing stop that follows the price by a certain percentage.
* Allows trend trades to yield greater profits.
---
## **7. Chart Displays**
* Purple line:** 4H WEDGE (main trend line)
* Yellow background:** Pump protection is active (trades will not be opened on that bar)
---
## **8. Practical Effect of the Strategy**
This system has an adaptive structure based on trend variations.
**Strengths:**
* Very high accuracy (76–80% in SOL and ETH tests)
* Low drawdown (approximately 6–7%)
* Safe entries thanks to pump/dump and extreme momentum filters
* Clearly defined stop and target structure
* Low noise thanks to multi-timeframe compatibility
**Weaknesses:**
* Performance may decrease in sideways markets without trends
* Overtrading may occur if the ADX filter is closed
* Very small stops can sometimes cause unnecessary triggers
---
## **9. Conclusion**
**Adaptive Chameleon** is a trend-based and highly stable strategy with well-established risk management, manipulation filtering, and entry into lower timeframes with clear trend direction detection and low-latency signals.
SOL and ETH demonstrated strong and balanced performance in backtests with metrics such as:
* **600+ trades**
* **30–37% profit**
* **76–80% win rate**
* **Low max drawdown**

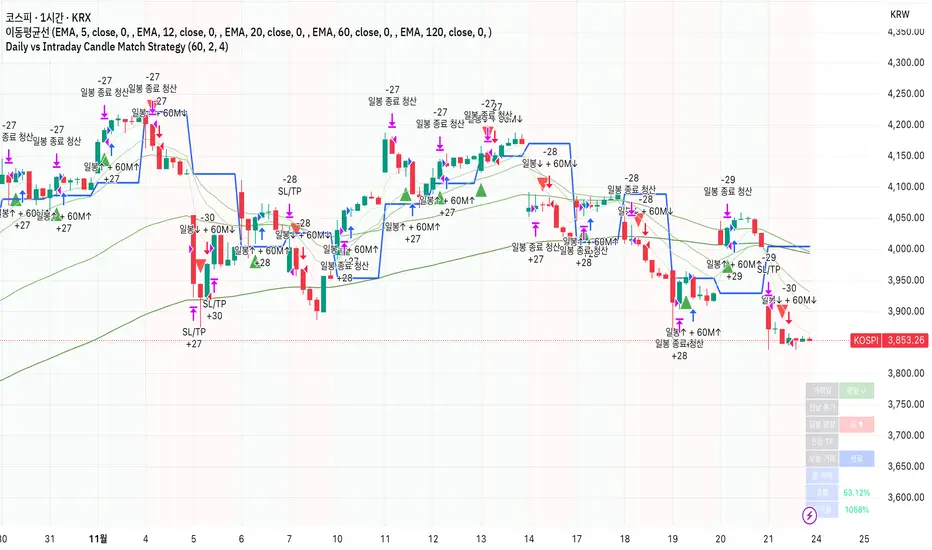
Daily vs Intraday Candle Match Strategy고죠 훈의 차트공부방
Gojo Hoon’s Trading Room
전일 종가 대비 현재 일봉 방향과 시간봉 방향이 일치할 때 진입
Trade when current daily direction (vs. previous close) matches the hourly/15-minute candle direction.
Kill Zone Strategy - Exact Match고죠 훈의 차트공부방
Gojo Hoon’s Trading Room
Kill Zone 시간대 방향성과 일중 추세의 상관관계
The 9–10 AM Kill Zone candle on the KOSPI chart determines the day’s long or short trading direction.

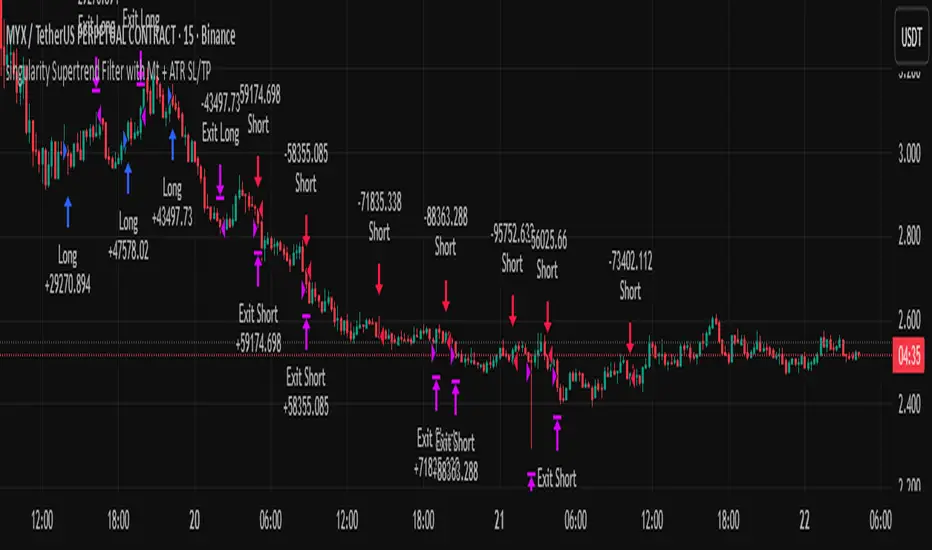
singularity crypto editionA trend following strategy that enters in a pullback of a trend . works greate on 3m to 15m timeframe. should be optimize on current market regime
Simple MA Crossover w/ SLTPPicture two cheetahs on a racetrack made of price candles. One cheetah is fast and twitchy (the short-term EMA). The other is chill, lumbering, and takes its sweet time (the long-term EMA). When the twitchy cheetah sprints ahead and crosses above the chill one → “BUY, YOU MAGNIFICENT DEGEN!” When the twitchy one gets tired, slows down, and gets lapped from above → “SELL before this turns into a horror movie!”
That, my friend, is the EMA crossover strategy in its purest, most dramatic form.

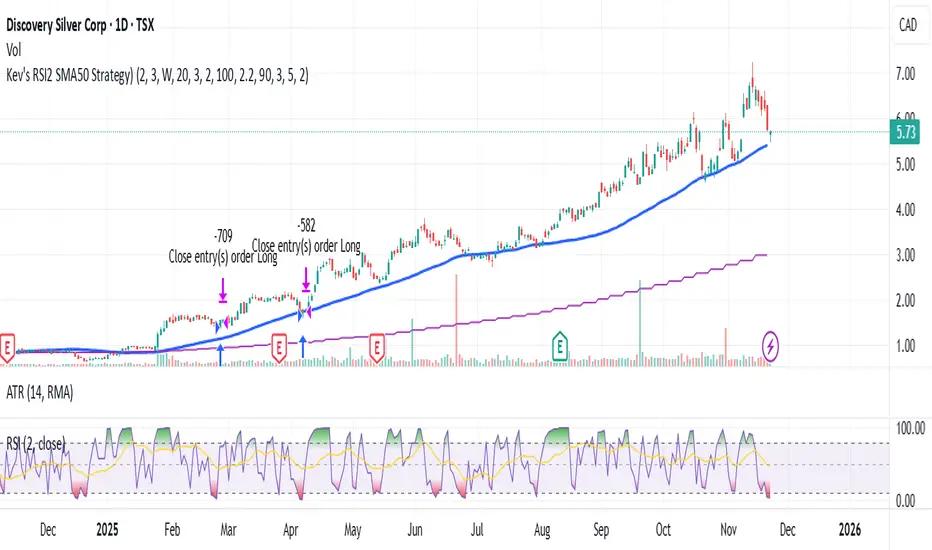
Kev's RSI2 SMA50 Strategy⭐ Kev’s RSI2 SMA50 Strategy — Institutional Edition (TSX Optimized + RR Filter)
A professional swing-trading system based on Larry Connors’ RSI(2) mean-reversion framework, optimized for TSX equities. Designed for Daily timeframe trading with institutional trend alignment, volatility filtering, and strict risk-reward controls.
📌 Overview
This strategy enhances the classic RSI(2) setup with:
• Strong trend confirmation (SMA50 + Weekly SMA50)
• Deep pullback detection (RSI2 < 3)
• Structural swing-based stop-loss
• Fixed 2R profit target (non-repainting)
• Optional Connors RSI (CRSI) confirmation
• Volatility filtering via ATR range
• Mechanical, deterministic, no-discretion rules
Works best on TSX large & mid-caps, ETFs, and liquid equities.
🔍 Core Philosophy
Buy strong stocks on pullbacks → Price must be above SMA50 + Weekly SMA50.
Pullback must be statistically meaningful → RSI(2) < 3.
R:R must justify the trade → Swing-low SL + 2R target with structural room to hit TP.
🧠 Entry Conditions (Non-Repainting)
• RSI(2) < 3 → Identifies extreme short-term oversold dips.
• SMA50 Filter → Ensures uptrend alignment.
• Weekly HTF Filter (Default = 1W) → Confirms broader trend direction.
• ATR Filter → Rejects volatile bars (range < ATR(14) × 2.2).
• Optional:
– SMA50 Slope (positive trend strength)
– Bullish Reversal Candle
– Connors RSI < 20 (deep pullback confirmation)
🎯 Risk Management
All levels are locked at entry and never repaint.
• Swing-Low SL (last 5 bars)
• 2R Profit Target = Entry + (Risk × 2)
• R:R Feasibility Filter → Only enters if recent swing high is above TP.
• Optional RSI Exit → Exit when RSI2 > 90 (enabled by default).
• Optional SMA Exit (disabled by default) → Conservative early exit.
📈 Visuals
The script plots:
• SMA50
• Weekly SMA50
• Swing-Low SL (fixed)
• 2R TP (fixed)
• Optional SMA exit line
All are non-repainting and update only on confirmed bars.
🔔 Alerts
Buy Signal → All entry filters aligned (RSI2, SMA50, HTF, ATR, RR check).
Exit Signal → 2R hit, SL hit, RSI exit, or SMA exit (if enabled).
🧭 Recommended Usage
• Timeframe: Daily
• HTF: Weekly (default)
• Best For: TSX equities, mid/large-cap stocks, ETFs
• Style: Short-term swing trading (1–10 bars)
• Avoid: Low-volume tickers, microcaps, crypto, biotech, news-driven spikes.
🛑 Notes
• All HTF data uses lookahead_off → non-repainting.
• Rules are fully mechanical and deterministic.
• Position sizing uses % equity by default.
• This script is for educational purposes only and not financial advice.
• Always forward-test before using live capital.
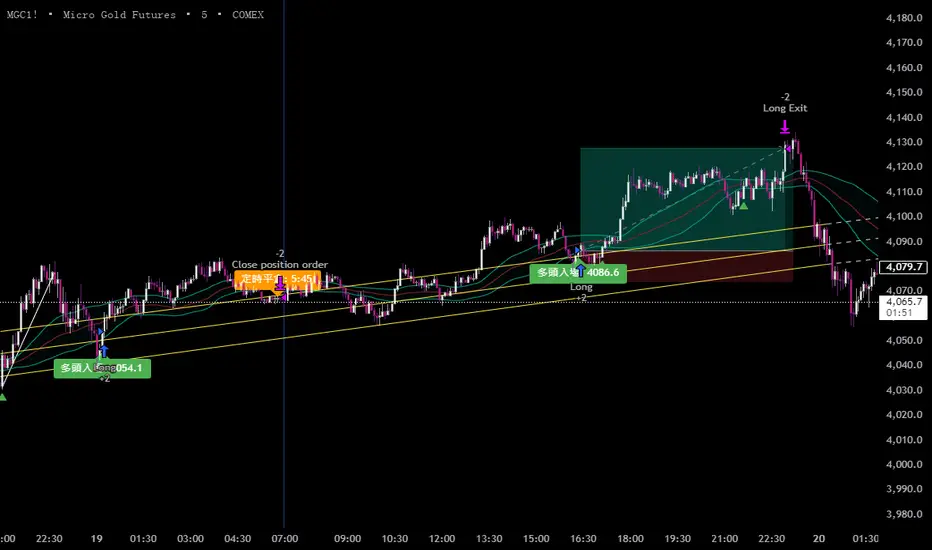
黃金5KCompelling Sales Description:
Unlock the Treasure of Consistent Profits!
Want to know where the market's hidden opportunities lie?
Go find them—with our powerful RSI + BB + Channel Automated Trading Strategy!
Tired of guessing when to enter or exit trades? Let our advanced algorithm do the heavy lifting for you. This strategy seamlessly combines:
RSI (Relative Strength Index) to identify overbought or oversold conditions.
Bollinger Bands (BB) to track volatility and pinpoint potential breakouts.
Channel Trading to capitalize on trending markets and price boundaries.
Fully automated, this system executes trades with precision, eliminating emotional decisions and saving you time. Whether you're a beginner or an experienced trader, this strategy adapts to market shifts to help you stay ahead.
Don't just chase profits—unlock the treasure of disciplined, data-driven trading.
Ready to transform your trading journey?
Contact us for details at: kbocc123@gmail.com
Seize the strategy. Secure your success. 🚀
Mir Khans QQQThis strategy is built around how I actually trade QQQ intraday: Opening-Range continuation, VWAP trend reads, OI magnets, and a simple but strict risk framework. It’s designed to keep you on the right side of the session theme (trend vs fade), then only take trades when multiple pieces of confluence line up.
The strategy is tuned for QQQ on intraday timeframes, but the logic is generic enough to experiment with other liquid index products. It’s not financial advice—use it as a structured framework for reading OR, VWAP, and trend strength, and then layer your own execution rules and risk management on top.
Macketings 1min ScalpingThis is a hyper-reactive scalping strategy designed for the 1-minute chart. It utilizes a strict four-EMA hierarchy (80/90/340/500) to ensure trades are only taken in the strongest aligned market trend. The strategy is built to be extremely tight on risk and focuses on capturing the immediate, high-momentum swing that follows a confirmed EMA retest or breakout.
Key Mechanics (How it Works):
Strict Trend Alignment: Entry is only permitted when the faster EMA band (80/90) and the price action are correctly aligned with the slow trend (340/500).
Long: EMA 80/90 must be above EMA 340/500, AND EMA 340 must be above EMA 500. (And vice-versa for Short.)
Expanded Retest Entry: The strategy waits for the price to retest or briefly enter the 80/90 band, then immediately enters upon the confirmed momentum breakout from that band.
Dynamic Risk Management (Tight Ride): The strategy is engineered to ride the wave aggressively while protecting capital immediately:
Extremely Tight Initial Stop Loss (0.2% default): Limits initial risk instantly.
Break-Even Security: Once profit hits 0.3%, the Stop Loss is automatically trailed to secure 0.2% profit (a risk-free trade).
Aggressive Exit Logic: Positions are closed not only upon hitting the Take Profit target (2.5%) but also immediately if the 80/90 EMA band crosses the 340 EMA, signaling a critical loss of momentum.
Disclaimer:
This strategy requires high-liquidity instruments and is best used on low timeframes (1-minute) due to its dependency on fast momentum shifts and tight stops. Backtesting and forward testing are crucial before deployment.

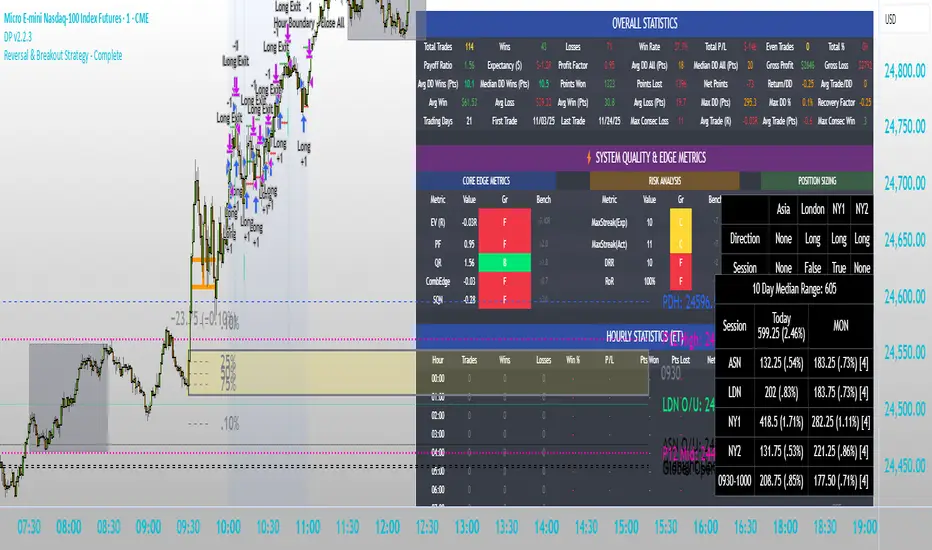
Intraday Market Structure Research Tool (Reversal + Breakout)This script is a fully rule-based intraday strategy designed for research and backtesting purposes, not financial advice. It is intended to help traders study market behavior, time-based price patterns, and statistical trade outcomes under realistic trading assumptions.
What the Strategy Does
This strategy operates in two selectable trade modes:
1. Reversal Mode
Identifies statistically large candles relative to recent volatility
Enters counter-direction trades when price shows exhaustion behavior
Designed to study fade-type behavior around session extremes
2. Breakout Mode
Tracks recent swing highs/lows over a user-defined lookback
Executes trades only after confirmed price expansion beyond these levels
Designed to test momentum continuation behavior
Time & Session Filtering
Trades are only taken during user-defined market sessions, including:
New York 1
New York 2
London
Asia
This allows users to analyze performance differences between global trading sessions.
9:30 AM Opening Range Logic
The script captures the 9:30 AM (Eastern) one-minute candle high/low and uses that as an Opening Range:
Breakout trades can be confirmed above or below this range
The range is visualized for clarity
Risk Management & Realism Controls
This script includes realistic execution mechanics:
Fixed stop-loss and take-profit defined by the user (points or ticks)
Built-in slippage modeling
Commission assumptions included
Position sizing designed to keep risk per trade under 5–10% of account equity when used with realistic account sizes
Users are responsible for choosing realistic account sizes and risk values when running backtests.
Statistical Performance Tracking
The strategy records and displays performance data including:
Win rate
Average win and loss
Maximum drawdown per trade series
Expectancy
Trade distribution by:
Time of day
Session
Market classification
This allows users to study market tendencies and structural behavior over large sample sizes.
Visual Tools
The script displays:
Entry and exit markers
Blocked trade labels (when conditions are not met)
Opening range box
Breakout levels
Use Case Disclaimer
This script is designed for:
Backtesting
Market structure research
Statistical study
It is not guaranteed to be profitable, and results depend heavily on user-selected settings, market conditions, and realistic brokerage assumptions.