Motif-Motif Chart

ETH/BTC/XRP Strategy - Powered by BCHETH/BTC/XRP Strategy — Cross-Asset Momentum-Based Strategy
Overview
This strategy aims to identify medium-term long trade opportunities on ETH/BTC/XRP 2 or 4 hour charts by leveraging cross-asset momentum signals from Bitcoin Cash (BCH) relative to Ethereum (ETH). It integrates volatility filters, volume validation, and momentum confirmations to improve trade timing and risk management.
Key Features and Logic
Cross-Asset Momentum Filter: Enters long trades when BCH outperforms ETH in the prior candle, supporting relative strength confirmation.
Volume Confirmation: BCH volume must exceed 135% of its 20-period average, validating market interest before entry signals.
Volatility Filter: ETH price near or below 110% of the lower Bollinger Band (20 periods, 2σ) indicates oversold conditions.
Momentum Indicators: ETH RSI below 70 ensures the asset is not overbought, coupled with BCH MACD line crossing above its signal line for bullish bias.
Risk Controls: Includes trailing stop losses and take profit targets to protect gains and limit drawdowns.
Timing Constraints: Controlled cooldown periods between trades help prevent overtrading and false signals.
Usage Recommendations
Optimized for 2 or 4hour ETH/BTC/XRP USDT candles; 5-minute data optionally used for finer entries and exits.
Suitable for traders seeking dynamic timing based on multi-asset interactions rather than blind holding.
Works as a complement within diversified or rotational strategies focusing on Ethereum exposure.
Performance Summary (Backtest Jan 2023 – Jul 2025) ; ETHUSDT 2hour basis.
Total trades: 65
Win rate: 61.5%
Profit factor: 5.1
Note: The sample size is limited; results should be interpreted with caution. Past performance is not indicative of future results.
Important Notes
This script represents an original combination of cross-asset momentum with volatility and volume filters tailored to ETH and BCH interaction.
Source code is protected to safeguard unique implementation details while allowing free usage without restrictions.
Use appropriate risk management, and consider these signals as part of a broader trading analysis.
No guarantees on profitability; trading involves significant risk.

Lunar calendar day Crypto Trading StrategyLunar calendar day Crypto Trading Strategy
This strategy explores the potential impact of the lunar calendar on cryptocurrency price cycles.
It implements a simple but unconventional rule:
Buy on the 5th day of each lunar month
Sell on the 26th day of the lunar month
No trades between January 1 (solar) and Lunar New Year’s Day (holiday buffer period)
Research background
Several academic studies have investigated the influence of lunar cycles on financial markets. Their findings suggest:
Returns tend to be higher around the full moon compared to the new moon.
Periods between the full moon and the waning phase often show stronger average returns than the waxing phase.
This strategy combines those observations into a practical implementation by testing fixed entry (lunar day 5) and exit (lunar day 26) points, while excluding the transition period from solar New Year to Lunar New Year, effectively capturing mid-month lunar effects.
How it works
The script includes a custom lunar date calculation function, reconstructing lunar months and days for each year (2020–2026).
On lunar day 5, the strategy opens a long position with 100% of equity.
On lunar day 26, the strategy closes the position.
No trades are executed between Jan 1 and Lunar New Year’s Day.
All trades include:
Commission: 0.1%
Slippage: 3 ticks
Position sizing uses the entire equity (100%) for simplicity, but this is not recommended for live trading.
Why this is original
Unlike mashups of built-in indicators, this script:
Implements a full lunar calendar system inside Pine Script.
Translates academic findings on lunar effects into an applied backtest.
Adds a realistic trading filter (holiday gap) based on cultural/seasonal calendar rules.
Provides researchers and traders with a framework to explore non-traditional, time-based signals.
Notes
This is an experimental, research-oriented strategy, not financial advice.
Results are highly dependent on the chosen period (2020–2026).
Using 100% equity per trade is for simplification only and is not a viable money management practice.
The purpose is to investigate whether cyclical patterns linked to lunar time can provide any statistical edge in ETHUSDT.

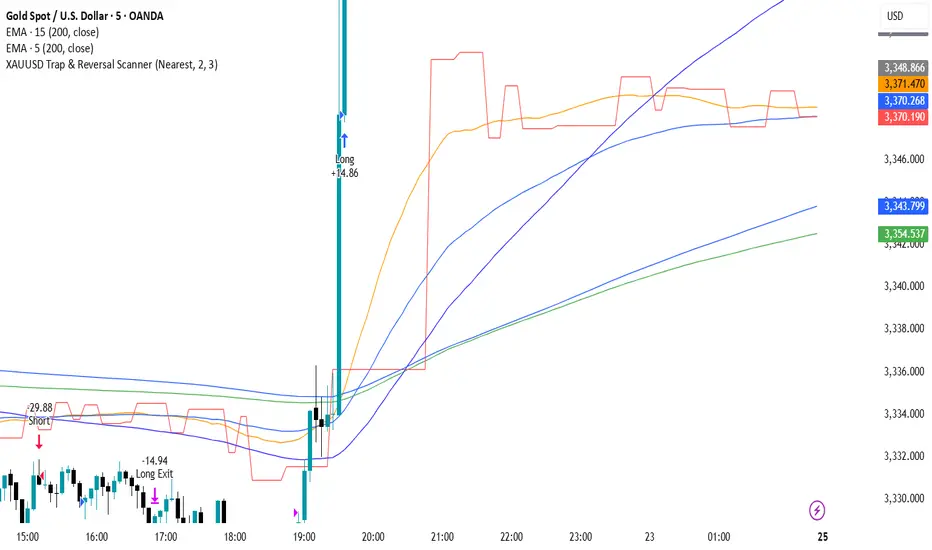
XAUUSD Trap & Reversal ScannerThis strategy is designed for XAUUSD (Gold) on 5m/15m timeframes.
It detects and trades reversal traps confirmed by classic patterns:
Double Tops / Double Bottoms
Head & Shoulders / Inverse H&S
Fair Value Gaps (FVG / IFVG)
Trap Sweeps (stop hunts)
Additional filters:
EMA200 trend confirmation
London & New York trading session filter (12:00–17:00 UTC)
Risk management with ATR-based stop loss
Partial profit-taking (50% at 1:1, remainder at 1:RR up to 1:4)
MTF RSI + ADX + ATR SL/TP vivekDescription:
This strategy combines the power of multi-timeframe RSI filtering with ADX trend confirmation and ATR-based risk management to capture strong directional moves.
🔑 Entry Rules:
• Daily RSI > 60
• 4H RSI > 60
• 1H RSI > 60
• 10m RSI > 40
• ADX (current timeframe) > 20
When all conditions align, a long entry is triggered.
🛡 Risk Management:
• ATR-based Stop-Loss (customizable multiplier)
• Take-Profit defined as a Risk-Reward multiple of the ATR stop
🎯 Why this Strategy?
• Ensures alignment across higher timeframes before entering a trade
• Uses ADX to avoid choppy/range-bound markets
• Built-in ATR stop-loss & take-profit for disciplined risk control
• Fully customizable parameters
This strategy is designed for trend-following swing entries. It works best on liquid instruments such as indices, forex pairs, and large-cap stocks. Always optimize the parameters based on your preferred asset and timeframe.

MTF RSI + ADX + ATR SL/TPThis strategy combines the power of multi-timeframe RSI filtering with ADX trend confirmation and ATR-based risk management to capture strong directional moves.
🔑 Entry Rules:
• Daily RSI > 60
• 4H RSI > 60
• 1H RSI > 60
• 10m RSI > 40
• ADX (current timeframe) > 20
When all conditions align, a long entry is triggered.
🛡 Risk Management:
• ATR-based Stop-Loss (customizable multiplier)
• Take-Profit defined as a Risk-Reward multiple of the ATR stop
🎯 Why this Strategy?
• Ensures alignment across higher timeframes before entering a trade
• Uses ADX to avoid choppy/range-bound markets
• Built-in ATR stop-loss & take-profit for disciplined risk control
• Fully customizable parameters
This strategy is designed for trend-following swing entries. It works best on liquid instruments such as indices, forex pairs, and large-cap stocks. Always optimize the parameters based on your preferred asset and timeframe.


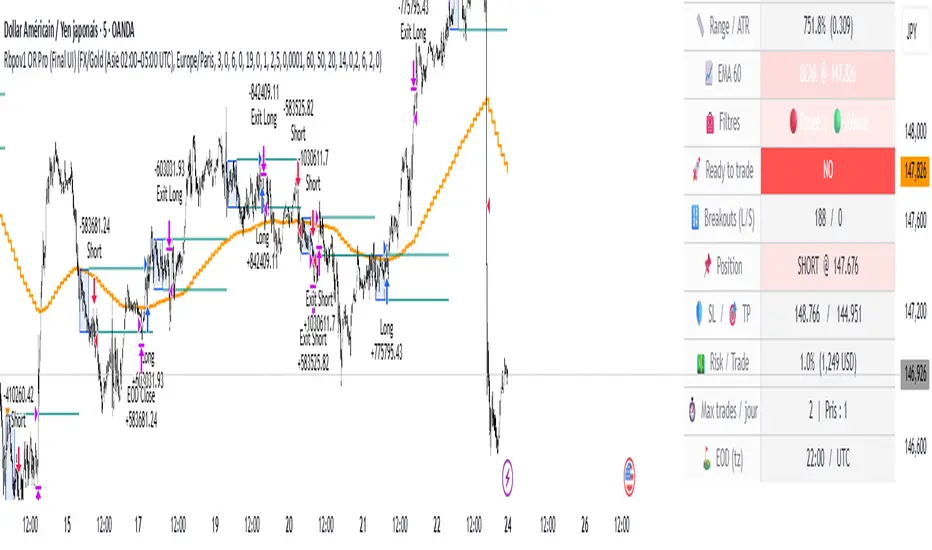
Rbpov1 – Opening Range Multi-Actifs Final📌 Strategy Bio – Rbpov1 Opening Range Pro
🎯 Core Concept
The Rbpov1 Opening Range Pro is an advanced algorithmic trading system built around the opening range breakout concept.
It is based on the observation that, after a period of consolidation (the opening range), markets often generate strong directional moves once the range is broken.
This strategy is designed to be multi-asset (Forex, indices, commodities, crypto) and multi-timeframe, with the following key principles:
A reference range (default: 03:00 → 06:00 UTC+2, customizable).
Trade entries are taken only after the range closes.
Smart filtering (trend, volatility, volume) to reduce false signals.
Strict risk management in USD, with Stop Loss and Take Profit defined in multiples of R.
Automatic end-of-day flat rule: all positions are closed by session end.
⚙️ Filters & Conditions
🔹 1. Trend Filter (EMA HTF)
A 21-period EMA is applied to a higher timeframe (default: H4).
If price is above EMA, only longs are allowed.
If price is below EMA, only shorts are allowed.
👉 This aligns intraday trades with the dominant trend.
🔹 2. Volatility Filter (ATR)
Uses a 14-period ATR to validate range conditions.
Opening range is valid only if:
Range > minATR × ATR
Range < maxATR × ATR
Default: minATR = 0.2, maxATR = 6.0.
👉 Filters out noise (tiny ranges) or overextended volatility.
🔹 3. Volume Filter (Optional)
Breakout candle must show higher volume than the average (default SMA 20).
Prevents low-liquidity breakouts.
🔹 4. Session & Trading Rules
No trades during weekends (Forex).
Maximum X trades per day (default: 2).
Positions are force-closed at EOD (default: 19:00 UTC+2).
💰 Risk Management
Dynamic position sizing in USD (capital × risk%).
Stop Loss automatically set at the opposite side of the range (with optional buffer).
Take Profit in multiples of R (default: 1.5R).
Equity-based recalculation ensures consistency as account grows.
📊 Key Benefits
✅ Professional and modular architecture.
✅ Works across Forex, indices, gold, and crypto.
✅ Smart filtering for cleaner signals.
✅ Robust and consistent risk management.
✅ Automatic end-of-day flattening (no overnight risk).
✅ Modern and visual dashboard interface for readability.
🏆 Use Cases
Forex (USD/JPY, EUR/USD, GBP/USD) → Asian session ranges.
Indices (NAS100, US30, DAX) → NYSE opening ranges.
Gold (XAU/USD) → Tokyo or pre-London ranges.
Crypto (BTC, ETH) → Tailored to volatility peaks.
VWAP Executor — v6 (VWAP fix)tarek helishPractical scalping plan with high-rate (sometimes reaching 70–85% in a quiet market)
Concept: “VWAP bounce with a clear trend.”
Tools: 1–3-minute chart for entry, 5-minute trend filter, VWAP, EMA(50) on 5M, ATR(14) on 1M, volume.
When to trade: London session or early New York session; avoid 10–15 minutes before/after high-impact news.
Entry rules (buy for example):
Trend: Price is above the EMA(50) on 5M and has an upward trend.
Entry zone: First bounce to VWAP (or a ±1 standard deviation channel around it).
Signal: Bullish rejection/engulfing candle on 1M with increasing volume, and RSI(2) has exited oversold territory (optional).
Order: Entry after the confirmation candle closes or a limit close to VWAP.
Trade Management:
Stop: Below the bounce low or 0.6xATR(1M) (strongest).
Target: 0.4–0.7xATR(1M) or the previous micro-high (small return to increase success rate).
Trigger: Move the stop to breakeven after +0.25R; close manually if the 1M candle closes strongly against you.
Filter: Do not trade if the spread widens, or the price "saws" around VWAP without a trend.
Sell against the rules in a downtrend.
Why this plan raises the heat-rate? You buy a "small discount" within an existing trend and near the institutional average price (VWAP), with a small target price.
مواقعي شركة الماسة للخدمات المنزلية
شركة تنظيف بالرياض
نقل عفش بالرياض


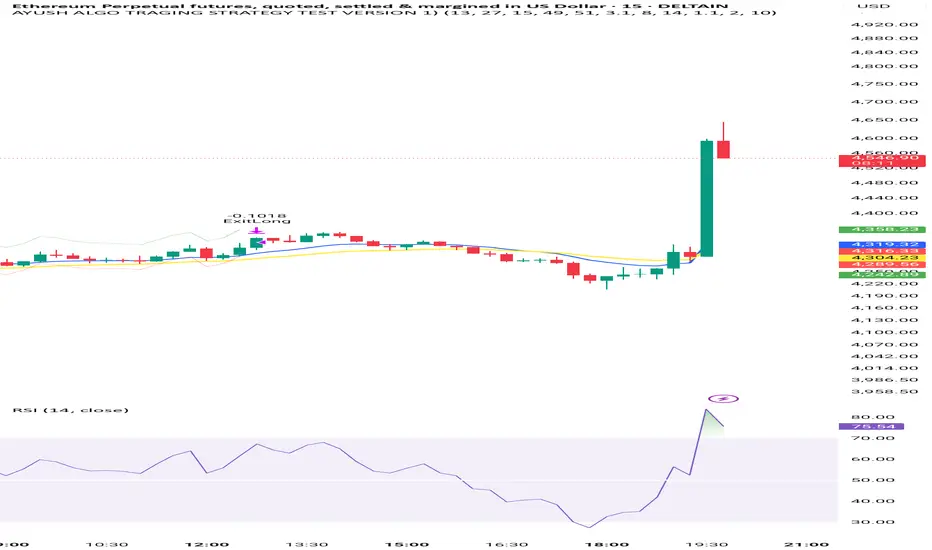
AYUSH ALGO TRAGING STRATEGY TEST VERSION 1)Very good strategy , it uses two moving avg crossovers and also rsi and atr for confirmation, this strategy is fully automated
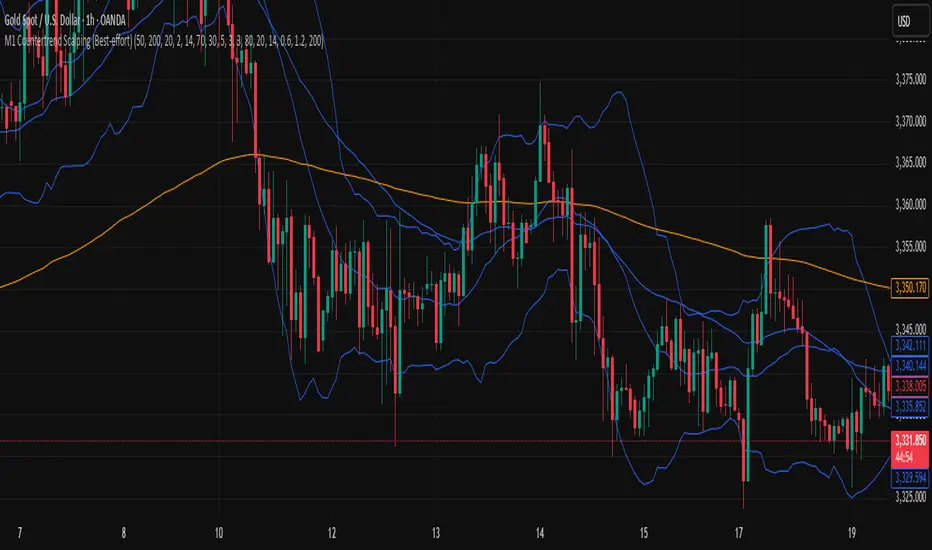
M1 Countertrend Scalping (Best-effort)M1 Countertrend Scalping (Best-effort)
M1 Countertrend Scalping (Best-effort)
Close Above/Below Prev 2 Candle Strategy (Any Timeframe)Title: Close Above/Below Previous 2 Candle Strategy (Any Timeframe)
Description:
This strategy identifies potential breakout and trend continuation signals by analyzing the closing price relative to the highs and lows of the previous two candles. It works on any chart timeframe, making it versatile for intraday, swing, and daily trading.
How it works:
Long Entry (Bullish Signal): Triggered when the current candle closes above the highs of the previous two candles.
Short Entry (Bearish Signal): Triggered when the current candle closes below the lows of the previous two candles.
Visual Indicators:
Green triangles above the bar indicate bullish signals.
Red triangles below the bar indicate bearish signals.
Strategy Features:
Works on any timeframe, from 1-minute charts to daily/weekly charts.
Configurable risk/reward ratio for automatic stop-loss and take-profit levels.
Alerts trigger immediately when the condition is met, helping traders react to potential breakouts.
Provides clean visual signals for easy chart reading and decision-making.
Benefits:
Reduces noise by focusing on candle close confirmations.
Versatile and suitable for intraday, swing, and long-term trading.
Easy to combine with other indicators or strategies.

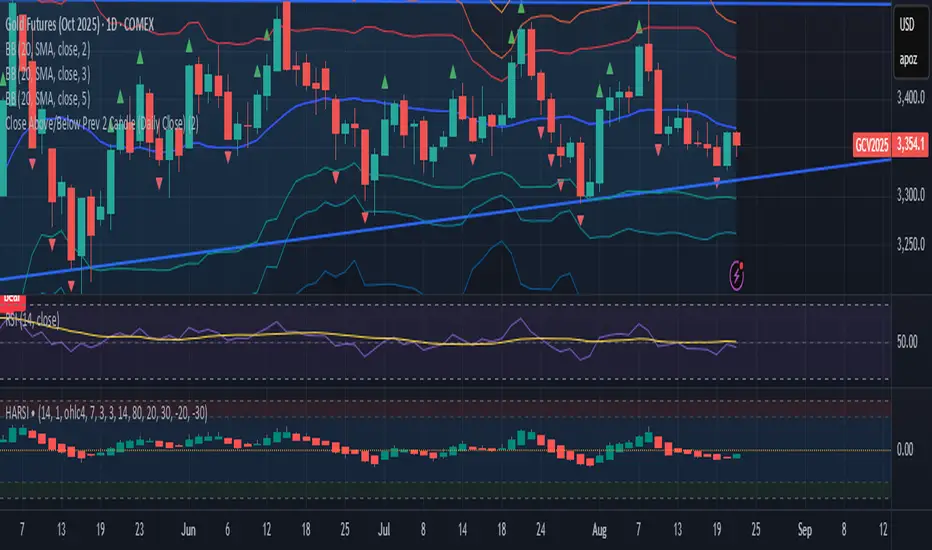
Close Above/Below Prev 2 Candle (Daily Close)This strategy identifies potential trend continuation or breakout signals by analyzing the daily candle closes relative to the previous two daily candles. It generates clear alerts and trade signals only after the daily candle has fully closed, reducing false intraday triggers.
How it works:
Long Entry (Bullish Signal): Triggered when the daily candle closes above the highs of the previous two daily candles.
Short Entry (Bearish Signal): Triggered when the daily candle closes below the lows of the previous two daily candles.
Visual Indicators: Green triangles indicate bullish signals, red triangles indicate bearish signals.
Strategy Features:
Optional long and short entries with configurable risk/reward ratio.
Automatic stop-loss and take-profit calculation based on candle structure.
Works on intraday charts using daily candle analysis.
Alerts:
Alerts trigger only after the daily candle closes above/below the previous two daily candles.
Helps traders receive precise notifications for potential breakout trades.
Benefits:
Reduces noise by using daily candle closes.
Easy to integrate with other swing or trend strategies.
Provides clear visual and alert signals for both bullish and bearish setups.
Valid H/L Strategy Tester with MFE/MAE Analytics
## Overview
A data-driven trading indicator that identifies valid high/low price levels and provides statistical insights through Maximum Favorable Excursion (MFE) and Maximum Adverse Excursion (MAE) analytics. Make informed trading decisions based on historical price behavior rather than guesswork.
## Key Features
### 🎯 Smart Pattern Recognition
- Automatically detects valid highs and lows with confirmation system
- Color-coded candles and lines for clear visual identification
- Inside/Outside print filtering for higher probability setups
### 📊 Statistical Analytics
- Analyzes up to 500 historical setups for MFE/MAE calculations
- 1-hour and 3-hour timeframe data with percentile-based targets (20th, 50th, 80th)
- Real-time performance tracking with comprehensive statistics table
### ⚙️ Flexible Strategy Options
**Entry Methods:** Confirmation-based or MAE percentile entries
**Take Profit:** MFE-based, fixed points, percentage, or R:R ratio targets
**Risk Management:** Multiple stop loss types with position sizing controls
### 🕐 Advanced Time Filtering
- Session filters (Asia, London, New York)
- Individual hourly controls (24-hour precision in ET)
- Pre-configured for optimal NY trading hours (9 AM - 2 PM)
### 📈 Visual Dashboard
- MFE target lines (blue) and MAE risk lines (orange)
- Customizable colors, styles, and line weights
- Statistics table showing daily/hourly/weekly performance breakdowns
## How It Works
1. **Pattern Detection** - Scans for valid high/low formations using price structure and gap behavior
2. **Statistical Analysis** - Calculates historical MFE/MAE percentiles from past setups
3. **Trade Framework** - Executes entries/exits based on your configuration with real-time performance tracking
## Ideal For
- **Day/Swing Traders** seeking data-driven entry/exit levels
- **Risk Managers** wanting historical drawdown data for stop placement
- **Performance Trackers** needing detailed analytics across timeframes and sessions
- **Flexible Strategies** - adapts to scalping, day trading, or swing trading styles
## Quick Setup
1. Select analysis timeframe (default: 5-minute)
2. Choose entry method and exit strategy
3. Enable MFE/MAE analytics display
4. Apply session/hourly filters
5. Customize visual elements and table settings
Transform your trading from guesswork to statistical precision with historical price behavior insights.

Three-Step 9:30 Range Scalping# Three-Step 9:30 Range Scalping Strategy Rules
## Step 1: Mark the Levels (9:30 AM)
- Wait for the **first 5-minute candle** starting at 9:30 AM EST to close
- Mark the **HIGH** and **LOW** of this candle
- Switch to **1-minute chart** for trading
## Step 2: Find Your Entry (Trade for 1 hour only: 9:30-10:30 AM)
### BREAK Entry
- Need: **Fair Value Gap (FVG)** + **ANY** of the 3 FVG candles closes outside the range
- FVG = Gap between candle wicks (3-candle pattern)
### TRAP Entry
- Need: Break outside range → Retest back inside → Close back outside again
### REVERSAL Entry
- Need: Failed break in one direction → Opposite FVG back into the range
## Step 3: Trade Management
### Stop Loss:
- **Break/Trap**: Low/High of first candle that closed outside the range
- **Reversal**: Low/High of first candle in the FVG pattern
### Take Profit:
- **Always 2:1 risk-to-reward ratio**
- If you risk $100, you make $200
## Key Rules:
- ✅ **Body close** outside range (not just wicks)
- ✅ Trade on **1-minute chart** only
- ✅ Only trade **first hour** (9:30-10:30 AM EST)
- ✅ **Fixed 2:1** take profit every time
- ✅ One strategy, stay consistent
**That's it. No complicated indicators, no higher timeframe bias, no guesswork.**
